Serverless Observability: X-Ray, Powertools and Structured Logs
When a parcel goes missing, you need the tracking number across every warehouse. Serverless observability is that tracking: structured logs, metrics, and X-Ray traces tied by a correlation id so on-call finds the failing hop in minutes — not by SSH into a server you do not have.
What you'll learn in this chapter
- Emit structured JSON logs with request ids
- Use EMF / Powertools metrics
- Trace with AWS X-Ray across API+Lambda+DDB
- Design alarms that page humans
- Link CloudWatch chapter
1. Everyday example: courier tracking number
Fatima in Casablanca (MAD) pastes a tracking id and sees each warehouse scan. Diego in São Paulo (BRL) needs the same for checkout: API Gateway request id → Lambda → DynamoDB. Without one id in every log line, he greps in the dark during a Black Friday incident.
Metrics/alarms depth: CloudWatch. Compute basics: Lambda. Here we wire an observability pattern for serverless apps.
2. Why observability pattern?
Why do we need this?
No SSH. Short-lived environments. Failures hide in retries and async hops. You need logs, metrics, traces, and alarms designed on day one — not after the first 2 AM page in USD production.
What is it?
Serverless observability = structured logs + metrics (EMF/Powertools) + distributed traces (X-Ray) + actionable alarms, all correlated by ids (requestId, orderId, trace id).
3. Vertical diagram
4. How: minimum viable observe
How to do it (step by step)
- JSON log each request with level, msg, orderId, requestId.
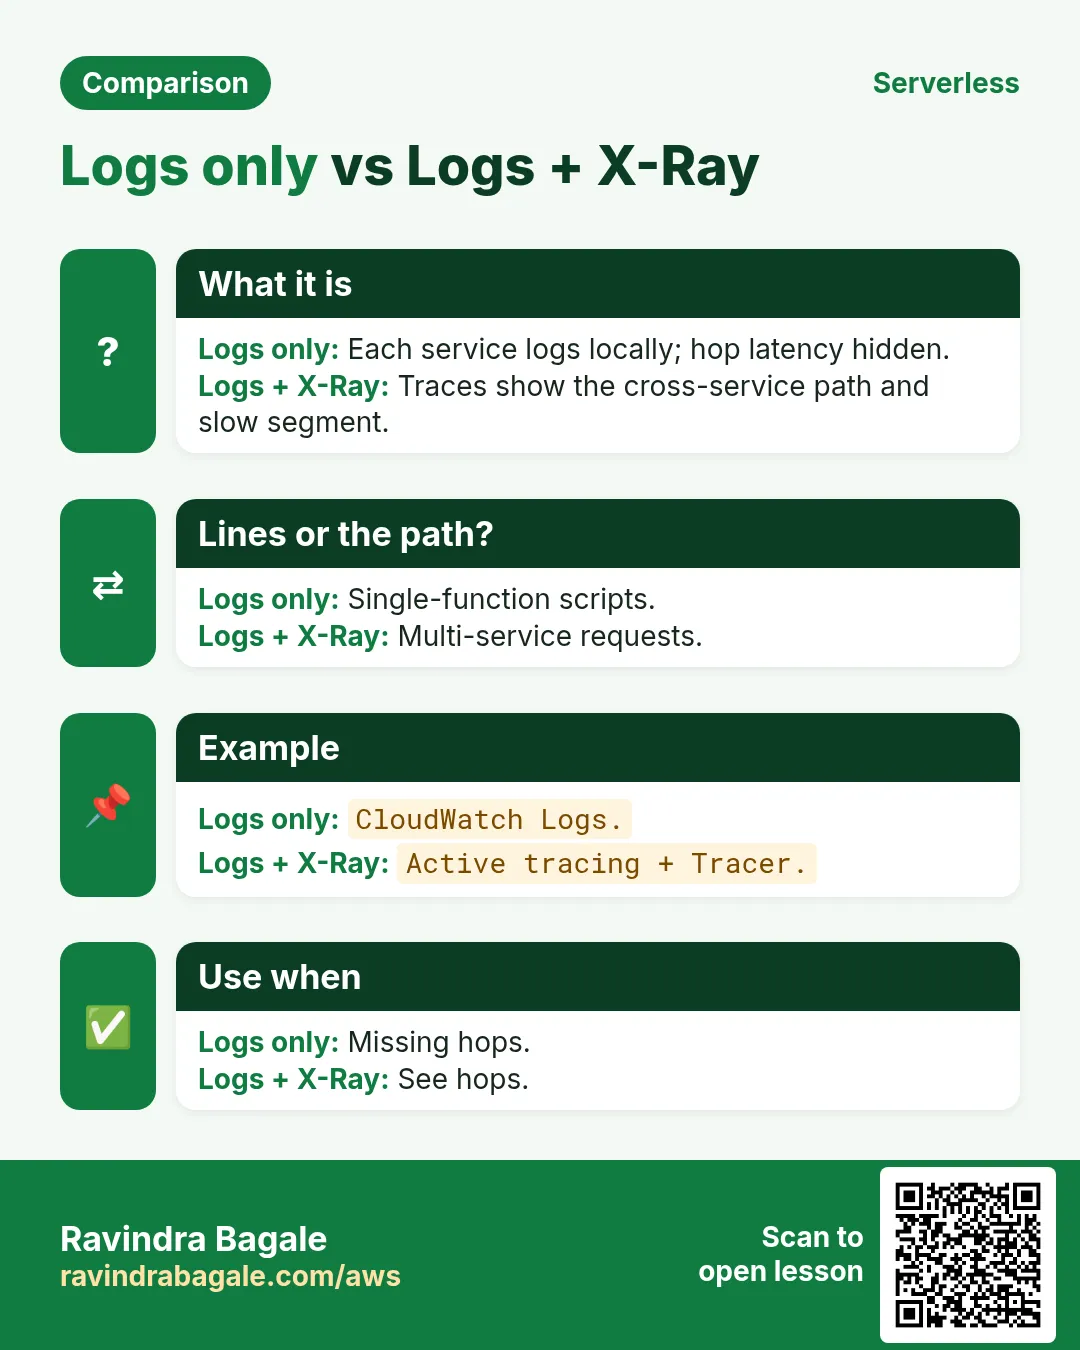
- Enable X-Ray on API stage + Lambda; use AWS SDK instrumentation.
- Emit 3 business metrics: OrdersCreated, PaymentFailed, LagMs.
- Alarm: errors, throttles, DLQ depth, iterator age, p99 latency.
- Alarm description = runbook URL + owner.
- Redact PII — never log full card or national id.
5. Per-concept commands
Tail recent Lambda logs
aws logs tail /aws/lambda/checkout-api --region ap-south-1 --since 10m --format shortMeaning: Fast incident view; prefer JSON fields you can filter.
X-Ray service graph summary
aws xray get-service-graph --region ap-south-1 \
  --start-time $(date -u -d '30 minutes ago' +%s) \
  --end-time $(date -u +%s) \
  --query 'Services[].{N:Name,E:RootSummaryStatistics.ErrorCount}'
Meaning: Shows which hop is erroring in the last half hour.
Put a safe test metric alarm sketch
aws cloudwatch describe-alarms --region ap-south-1 \
  --alarm-name-prefix checkout --max-records 10 \
  --query 'MetricAlarms[].{N:AlarmName,S:StateValue}'
Meaning: Lists checkout alarms and state — verify WARNING/ALARM paths in staging first.
Filter logs by orderId
aws logs filter-log-events --region ap-south-1 \
  --log-group-name /aws/lambda/checkout-api \
  --filter-pattern '{ $.orderId = "ord-7841" }' --limit 20
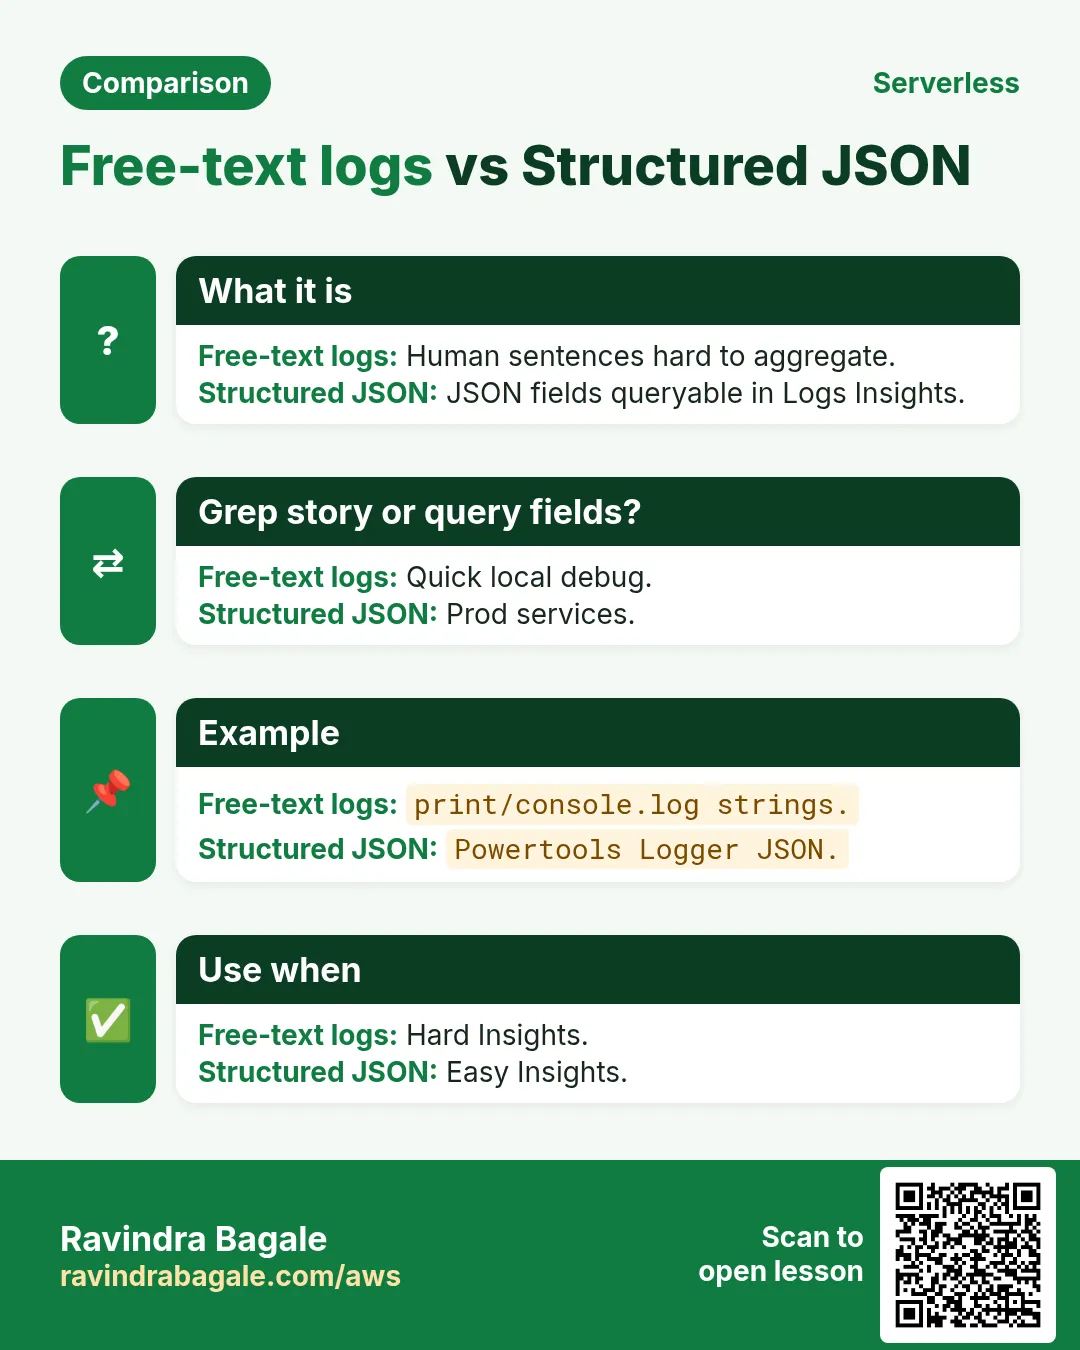
Meaning: Correlation search — only works if you logged orderId as JSON.
6. Powertools habits
- Logger: bind correlation keys once per invoke.
- Tracer: capture outbound SDK calls.
- Metrics: cold start metric dimension.
- Idempotency utility where payments matter.
7. Alarm design
| Signal | Page? | Notes |
|---|---|---|
| Lambda Errors spike | Yes if user path | Exclude known probes |
| Throttles | Yes | Concurrency headroom |
| DLQ depth >0 money | Yes | Notify DLQ maybe ticket |
| IteratorAge high | Yes for streams | Stale projections |
| p99 latency | If SLO | Cold start chapter link |
8. Industries
- Fintech (Aisha, Lagos, NGN): ledger correlation mandatory.
- Ecommerce (Rohan, Pune, INR): checkout trace + payment metric.
- Healthcare (Mei, Singapore, SGD): redact PHI in logs.
- Logistics (Omar, Amman, JOD): scan events metrics per hub.
- SaaS (Priya, Bengaluru, INR): per-tenant error dashboards.
9. Lab
10. Lab - logs + one alarm
Do this in ap-south-1 (Mumbai) unless your org forbids it. Set a budget alert first.
How to do it (step by step)
- Invoke a lab Lambda; confirm JSON log with a fake orderId.
- Enable X-Ray on that function; open service map once.
- Create or inspect an alarm on Errors with SNS email in sandbox.
- Write a 5-line runbook in a text file for that alarm.
Cleanup (stop billing)
- Delete lab alarms and SNS test subscriptions.
- Disable X-Ray if not needed to save cost.
11. Same pattern across industries
- Fintech (Aisha, Lagos): payment webhooks → SQS → Lambda; never block the bank callback thread.
- Ecommerce (Rohan, Pune): checkout API on API Gateway+Lambda; inventory fan-out on SNS.
- Healthcare (Mei, Singapore): appointment SMS via SNS; PHI stays in DynamoDB with fine-grained IAM.
- EdTech (Diego, São Paulo): nightly cleanup EventBridge → Lambda on student drafts.
- Logistics (Fatima, Casablanca): package scan events on EventBridge bus; Step Functions for customs saga.
- Media (Kenji, Osaka): S3 upload → Lambda thumbnails; fan-out to moderation + CDN invalidate.
- SaaS multi-tenant (Priya, Bengaluru): Cognito groups + DynamoDB partition per tenant.
- Gov portal (Omar, Amman): strangler fig — peel one PDF form route per sprint to Lambda.
12. Troubleshooting checklist
- Confirm region (ap-south-1 vs us-east-1 for CloudFront/ACM quirks).
- Check CloudWatch Logs for the function name and request id.
- Verify IAM execution role allows the API you call.
- For async: check DLQ depth and SQS age of oldest message.
- For APIs: curl -v and compare status, CORS headers, body.
- For workflows: open Step Functions execution event history.
- Re-read the linked deep chapter before reinventing a service.
- If cost spikes: check concurrency, retries, and provisioned capacity.
13. Common errors and fixes
Each row is a real mistake students and juniors hit. Read the fix before you panic.
| Error / symptom | Fix |
|---|---|
| Logs are plain text soup | Switch to JSON; one event per line. |
| X-Ray empty | Enable on API stage + Lambda; IAM xray:PutTraceSegments. |
| Alarm flapping | Widen period; use anomaly or buffered threshold. |
| PII in logs | Redact; structured allow-list fields. |
| Cannot find order across async | Propagate orderId in SQS message attributes + logs. |
| Metrics missing | EMF namespace typo; flush on exit. |
| Cost of traces huge | Sampling rules; trace user paths not every ping. |
| On-call gets email storms | Page only money path; ticket the rest. |
| Wrong region in console | Always set ap-south-1 when debugging Mumbai apps. |
14. FAQ
Q. Powertools required?
Strongly recommended; not mandatory if you emit JSON+EMF yourself.
Q. X-Ray vs OpenTelemetry?
X-Ray native; OTel growing — pick one consistent story.
Q. How long to keep logs?
Balance cost vs compliance; often 7-30 days online + archive.
Q. Link CloudWatch chapter?
amazon-cloudwatch-metrics-namespaces-alarms-and-sns-email-alerts.
Q. Async observability?
DLQ depth, age of oldest message, trace across producers.
15. Interview Q&A (Beginner / Mid / Senior + MNC)
Q. Beginner: correlation id?
Same id in every log for one request/order.
Q. Beginner: structured log?
JSON fields, not free text only.
Q. Mid: EMF?
Embedded Metric Format — logs become CloudWatch metrics.
Q. Mid: what to alarm?
Errors, throttles, DLQ, latency vs SLO.
Q. Senior: sampling?
Trace enough to debug; not 100% of health checks.
Q. MNC: evidence?
Trace+log retention meeting audit; runbooks linked.
16. Tips in English, Marathi and Hindi
Ravindra Bagale's Tip (EN)
No SSH: your tracking number is the correlation id across logs, metrics and traces.
Ravindra Bagale's Tip (MR)
SSH नाही: tracking = correlation id.
Tip (HI)
SSH नहीं: ट्रैकिंग नंबर = correlation id।
Try at home
- Add orderId to one log line.
- Name 3 alarms for checkout.
In short
- Start from a real story, then name the AWS services.
- Link existing chapters — do not copy their labs.
- Design for failure: retries, DLQ, idempotency, rollback.
- Measure before you buy provisioned concurrency or multi-region.
17. Architecture decision checklist
- Write the user journey in five bullets with no AWS names.
- Mark each step sync (user waits) or async.
- Name failure mode: retry, DLQ, compensate, or alert-only.
- Name the idempotency key for every write.
- Pick data store from access patterns (link DynamoDB modeling).
- Estimate monthly cost at 1x and 10x traffic (USD and INR).
- Confirm account concurrency and service quotas in ap-south-1.
- Decide auth: Cognito, IAM, Lambda authorizer, or none.
- Name on-call and which CloudWatch alarm pages them.
- Link the deep chapter you will not rewrite.
- Only then open console or IaC.
18. Copy-paste quick commands (read-only first)
# Region and identity
aws configure get region
aws sts get-caller-identity

# Lambda landscape
aws lambda list-functions --region ap-south-1 --max-items 20 \
  --query 'Functions[].{N:FunctionName,R:Runtime,T:Timeout,M:MemorySize}' --output table
aws lambda get-account-settings --region ap-south-1

# API Gateway (HTTP APIs)
aws apigatewayv2 get-apis --region ap-south-1 --query 'Items[].{N:Name,Id:ApiId,Ep:ProtocolType}' --output table

# Queues and topics
aws sqs list-queues --region ap-south-1
aws sns list-topics --region ap-south-1 --query 'Topics[].TopicArn'

# Event buses and state machines
aws events list-event-buses --region ap-south-1
aws stepfunctions list-state-machines --region ap-south-1 --query 'stateMachines[].name'

# DynamoDB tables (names only)
aws dynamodb list-tables --region ap-south-1
Run these in a sandbox account. Prefer read-only IAM while learning.
19. More industry and stack stories
- Fintech (Aisha, Lagos, NGN): bank webhooks must return 200 fast — SQS absorbs spikes; ledger Lambda is idempotent on paymentId.
- Ecommerce (Rohan, Pune, INR): Black Friday — API Gateway throttle + SQS order intake; SNS fans inventory, email, analytics.
- Healthcare (Mei, Singapore, SGD): appointment reminders via SNS SMS; PHI only in DynamoDB with condition keys.
- EdTech (Diego, São Paulo, BRL): EventBridge nightly cleanup of draft quizzes; Lambda timeout 30s, not 15 min.
- Logistics (Fatima, Casablanca, MAD): package scans on custom EventBridge bus; Step Functions customs saga.
- Media (Kenji, Osaka, JPY): S3 → Lambda thumbnails; never write thumbs to the watched prefix.
- SaaS (Priya, Bengaluru, INR): Cognito groups + DynamoDB PK tenantId; one Lambda authorizer for all routes.
- Gov (Omar, Amman, JOD): strangler — peel one PDF form route per sprint from the monolith.
- Startup (Sofia, Sofia, EUR): start with Function URL for demos; move to HTTP API when partners need JWT.
- Retail (Luis, Mexico City, MXN): store POS sync via SQS FIFO when order matters; Standard when it does not.
- Python: handlers thin; put domain logic in plain modules for unit tests without Lambda.
- Node: prefer async/await; never block the event loop on sync DNS.
- Java: SnapStart for cold starts; keep dependencies lean.
- .NET: AspNetCoreServer for low-traffic tenants; watch package size.
- Go: single static binary; great for SQS workers.
- PHP: keep Laravel queues on ECS; Lambda for S3/webhooks glue.
20. Glossary (short)
| Term | Meaning |
|---|---|
| Cold start | First invoke pays init; later invokes reuse the env |
| Idempotency | Same request twice → same effect |
| DLQ | Dead-letter queue for failed messages |
| Choreography | Services react to events; no central conductor |
| Orchestration | Central workflow (Step Functions) directs steps |
| Fan-out | One event → many consumers |
| Fan-in | Many branches join before next step |
| Strangler fig | Peel routes from monolith gradually |
| Saga | Distributed tx via steps + compensations |
| Provisioned concurrency | Keep N envs warm; you pay for ready capacity |
21. Practice: explain out loud
- 60 seconds: everyday story for serverless observability.
- 60 seconds: sync vs async with a checkout example.
- 60 seconds: when you refuse Lambda.
- 60 seconds: DLQ + idempotency in one breath.
- Record once; cut fillers; record again.
22. Safe lab hygiene
- Tag every lab resource with owner and expiry date.
- Set a monthly AWS Budget alarm in INR or USD before experiments.
- Prefer read-only commands first; mutate in a sandbox account.
- Delete queues, APIs, tables you created — DynamoDB and APIGW leave footprints.
- Never put production secrets in env vars or screenshots.
- Do not enable provisioned concurrency for a hello-world.
23. How this chapter links others
- Compute depth: Lambda.
- HTTP edge: API Gateway.
- Data modeling: DynamoDB.
- Messaging: SQS/SNS.
- Events: EventBridge.
- Workflows: Step Functions.
- Project chapters (build-*): worked assemblies — link, do not paste.
24. Myths to drop
| Myth | Reality |
|---|---|
| Serverless means zero servers | Servers exist; you do not manage them |
| Always cheaper than EC2 | Steady high load can favor EC2/Savings Plans |
| No Ops needed | You own IAM, data, alarms, cost, incidents |
| One Lambda per app is fine | Bounded contexts scale better |
| Queues are optional decoration | Queues are the load leveler and blast-radius wall |
25. Error budget thinking for serverless
If your monthly error budget is 0.1% on checkout, a fan-out that retries aggressively can burn the budget with duplicate emails while money stays correct. Separate business correctness SLOs from notification SLOs.
- Write two SLOs: money-correct and notify-delivered.
- Retries on money path: bounded + idempotent.
- Retries on notify path: best-effort + DLQ.
- Page humans on money DLQ; ticket on notify DLQ.
26. Regional notes (ap-south-1)
- Build labs in Mumbai (ap-south-1) unless your org mandates elsewhere.
- Some services launch first in us-east-1 — check feature availability.
- Data residency for INR fintech may require in-region only.
- Latency to end users in India usually favors ap-south-1.
27. Naming conventions that save incidents
# Suggested prefixes
# Lambda:  pay-intake-prod, pay-worker-prod
# SQS:     pay-orders.fifo / pay-orders-dlq
# SNS:     pay-order-events
# EB bus:  pay.domain
# SFN:     pay-refund-saga
# DDB:     pay-orders-prod
Include env (dev/stage/prod) and domain. Future you grepping CloudWatch will thank present you.
28. Pre-mortems (ten minutes)
- Imagine tomorrow headline: double charge in AED. What broke?
- Imagine DLQ depth 50,000 after a bad deploy. How do you drain?
- Imagine Cognito outage. Do APIs fail closed or serve read-only?
- Write answers in the runbook before go-live.
29. Currency and locale in examples
Rotate currencies in designs: INR, USD, EUR, AED, NGN, BRL, JPY, SGD. Rotate names: Aisha, Rohan, Mei, Diego, Fatima, Kenji, Priya, Omar, Sofia, Luis. This keeps mental models global — not one-country samples.
30. Worked story: Aisha ledger page (NGN)
- PaymentFailed metric spikes; alarm pages.
- X-Ray shows DynamoDB throttle on ledger table.
- Logs filter paymentId show retries exhausted to DLQ.
- Fix capacity; redrive; postmortem updates runbook.
31. Anti-patterns
- console.log without request id.
- Alarm with no owner or runbook.
- Tracing 100% including synthetic freeloaders.
Revision, interview and comparison cards
Revise this lesson in a few minutes. Save the cards on your phone or download them as PNG files. The QR code on each card opens this lesson.
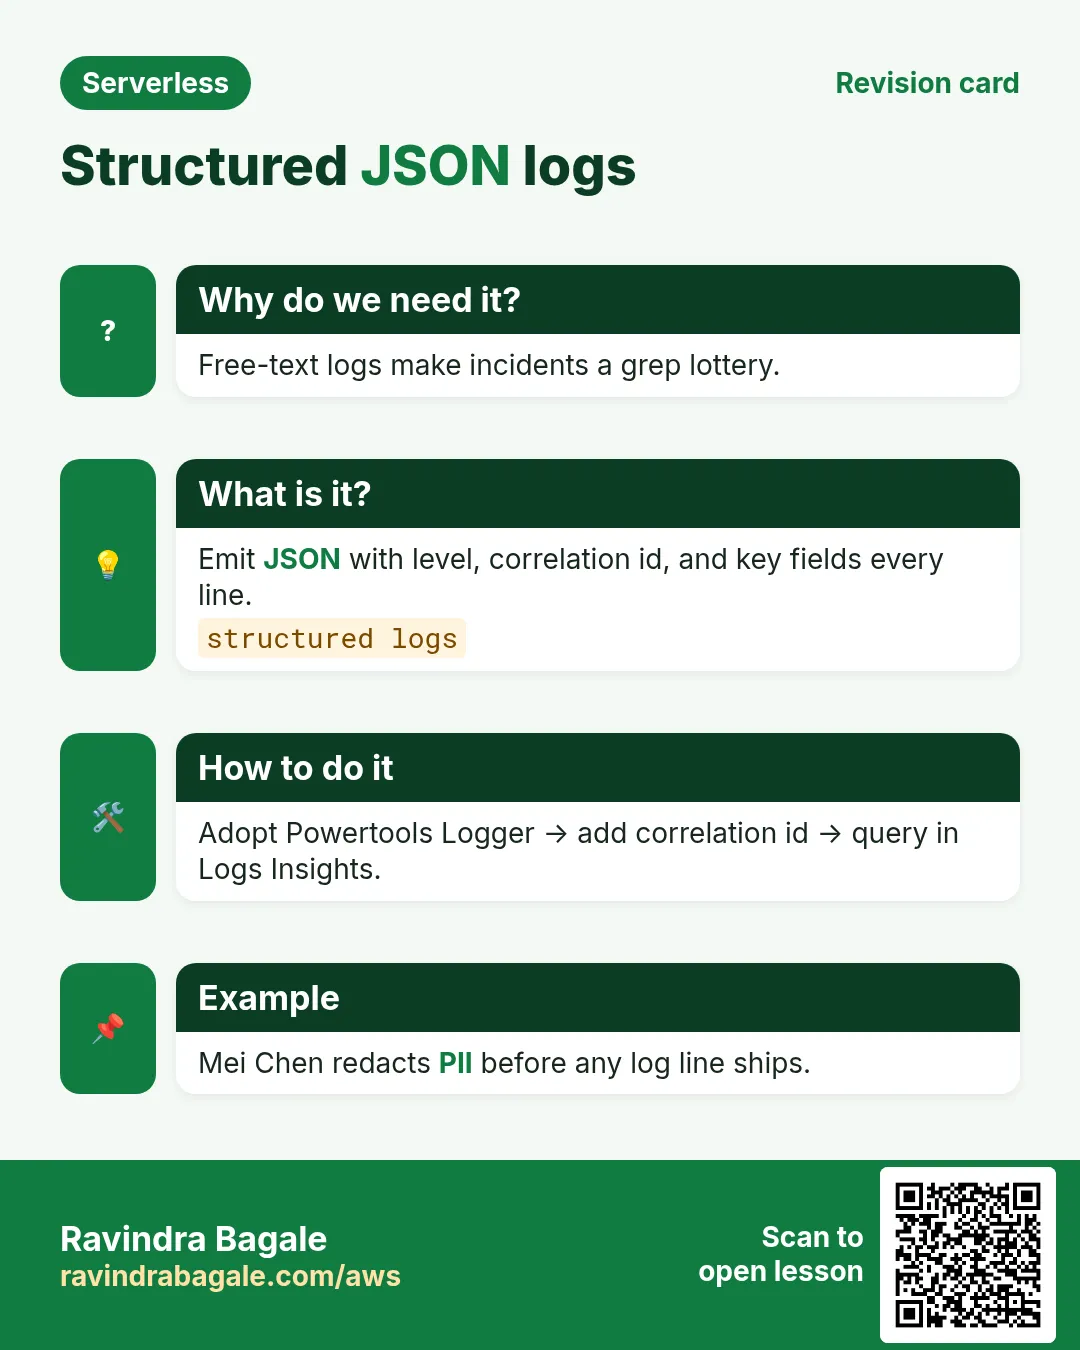
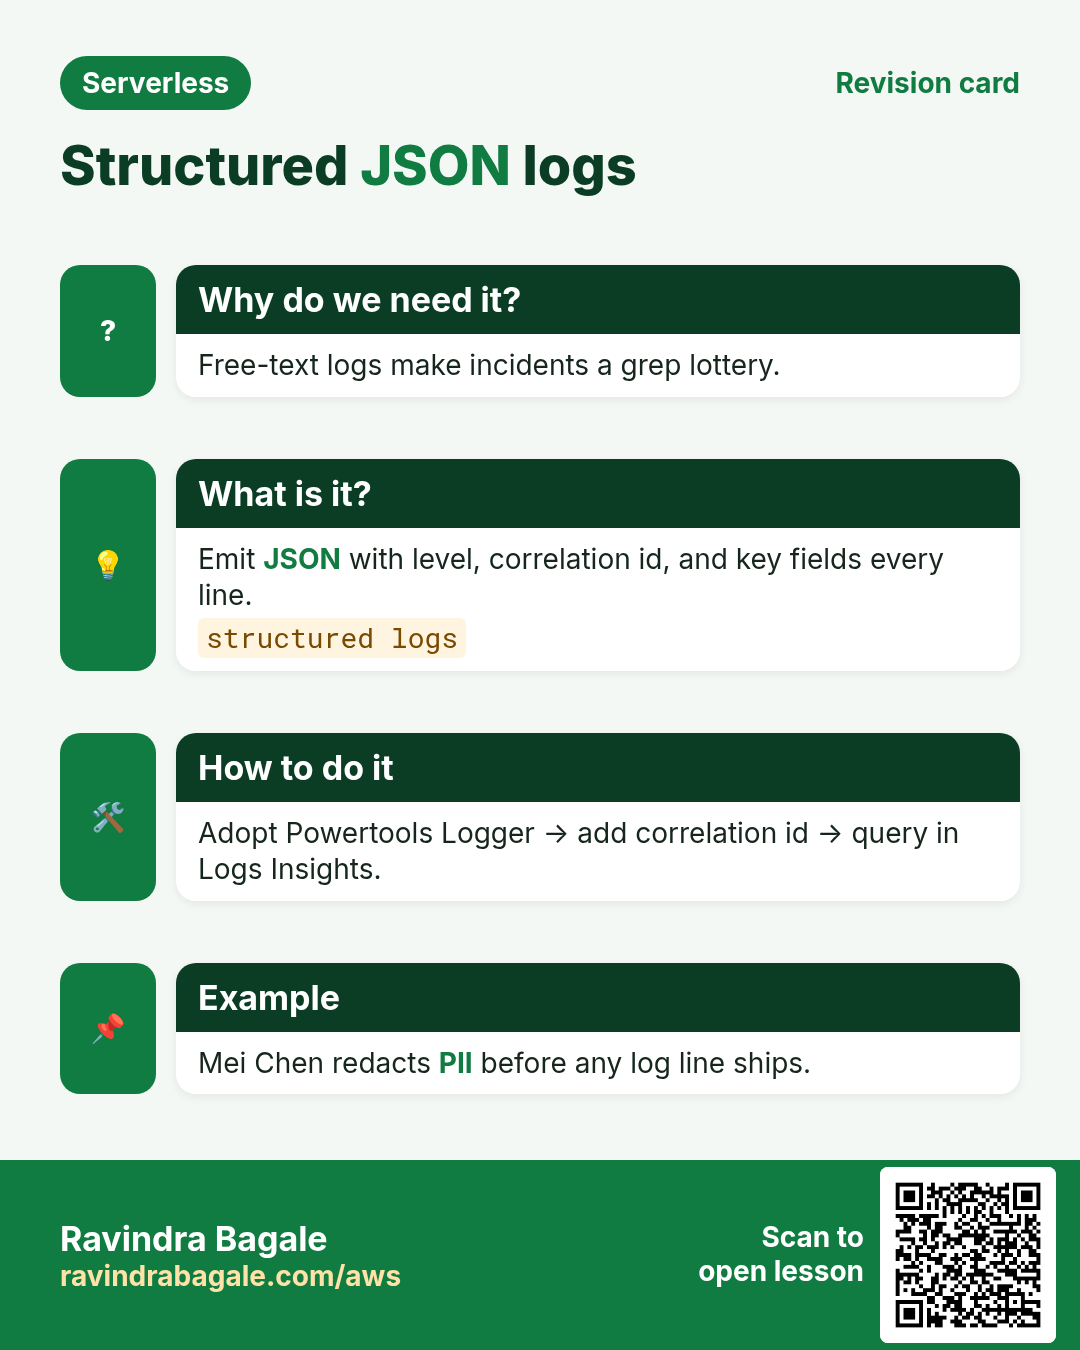
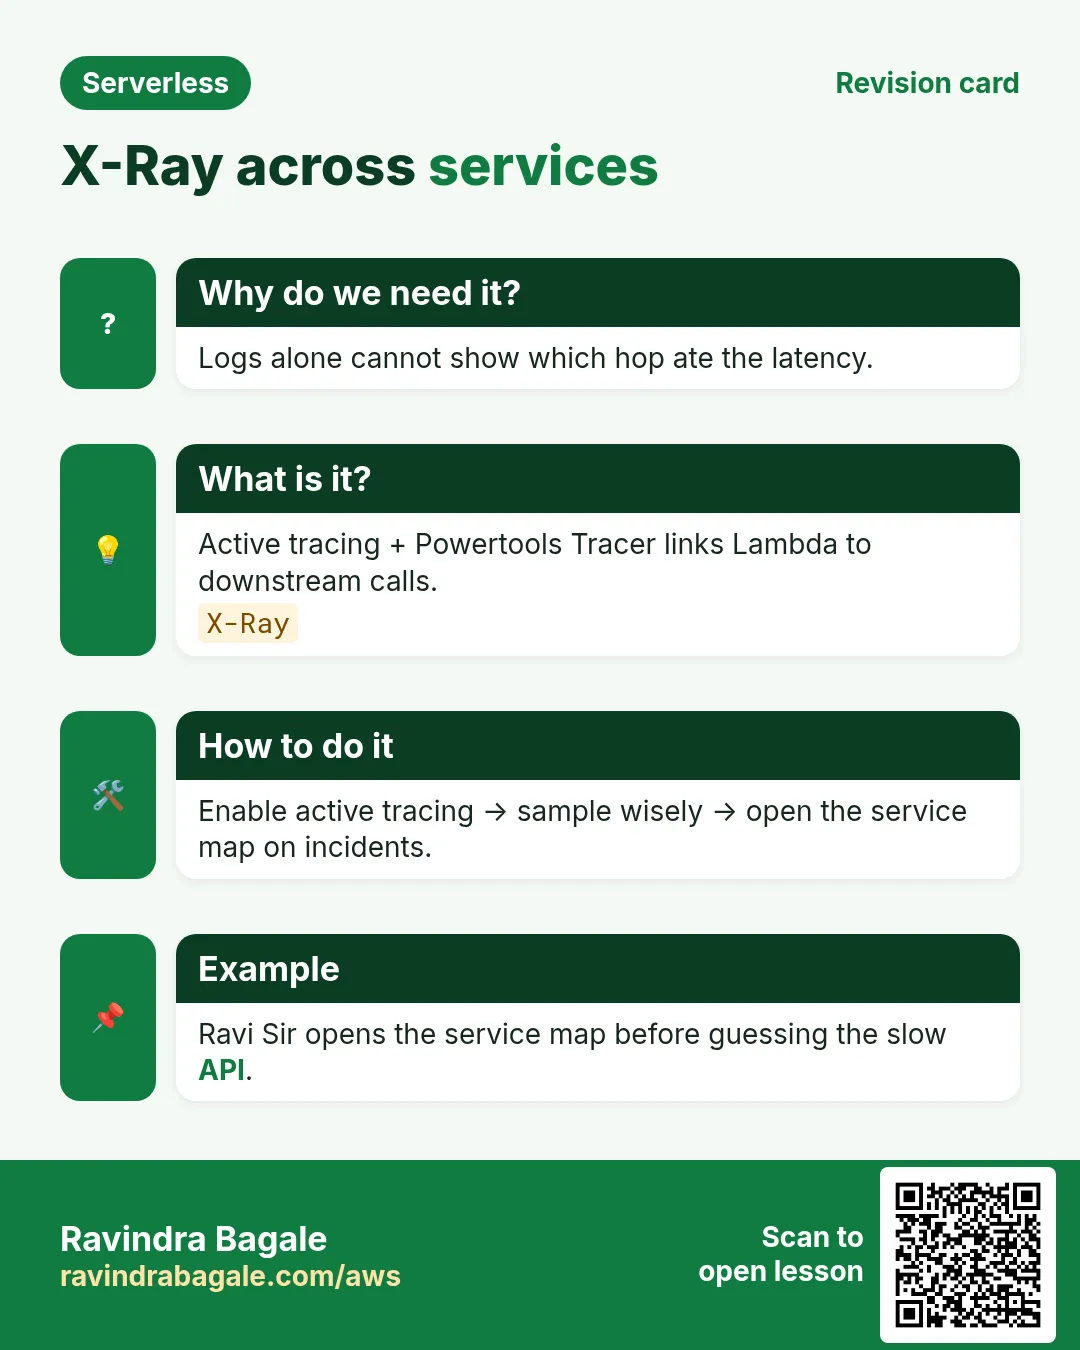
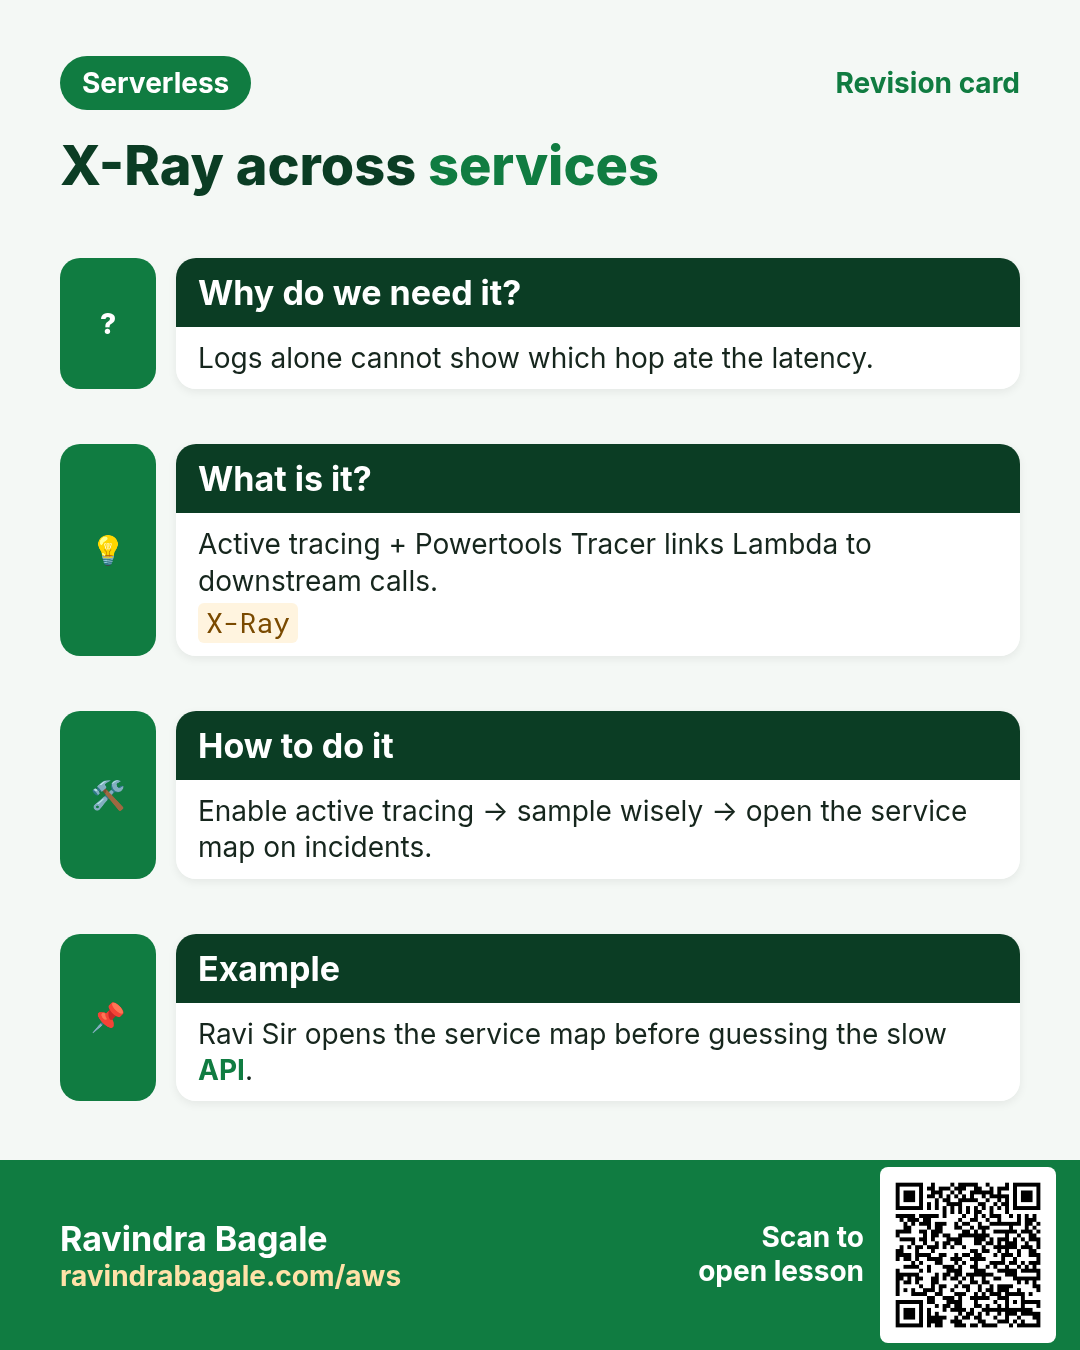
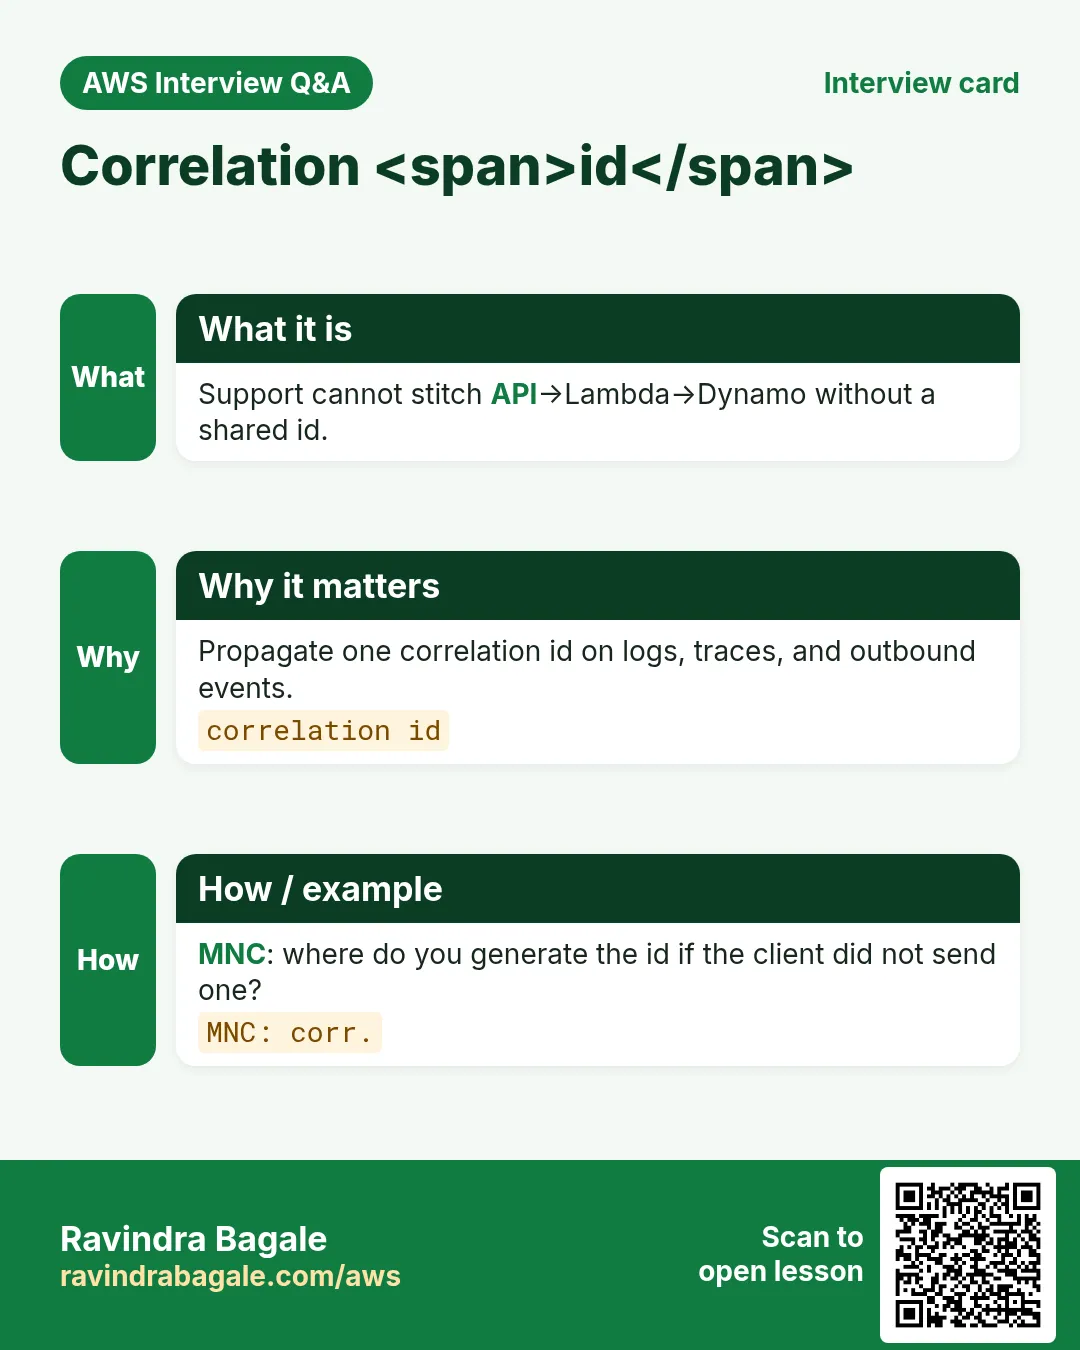
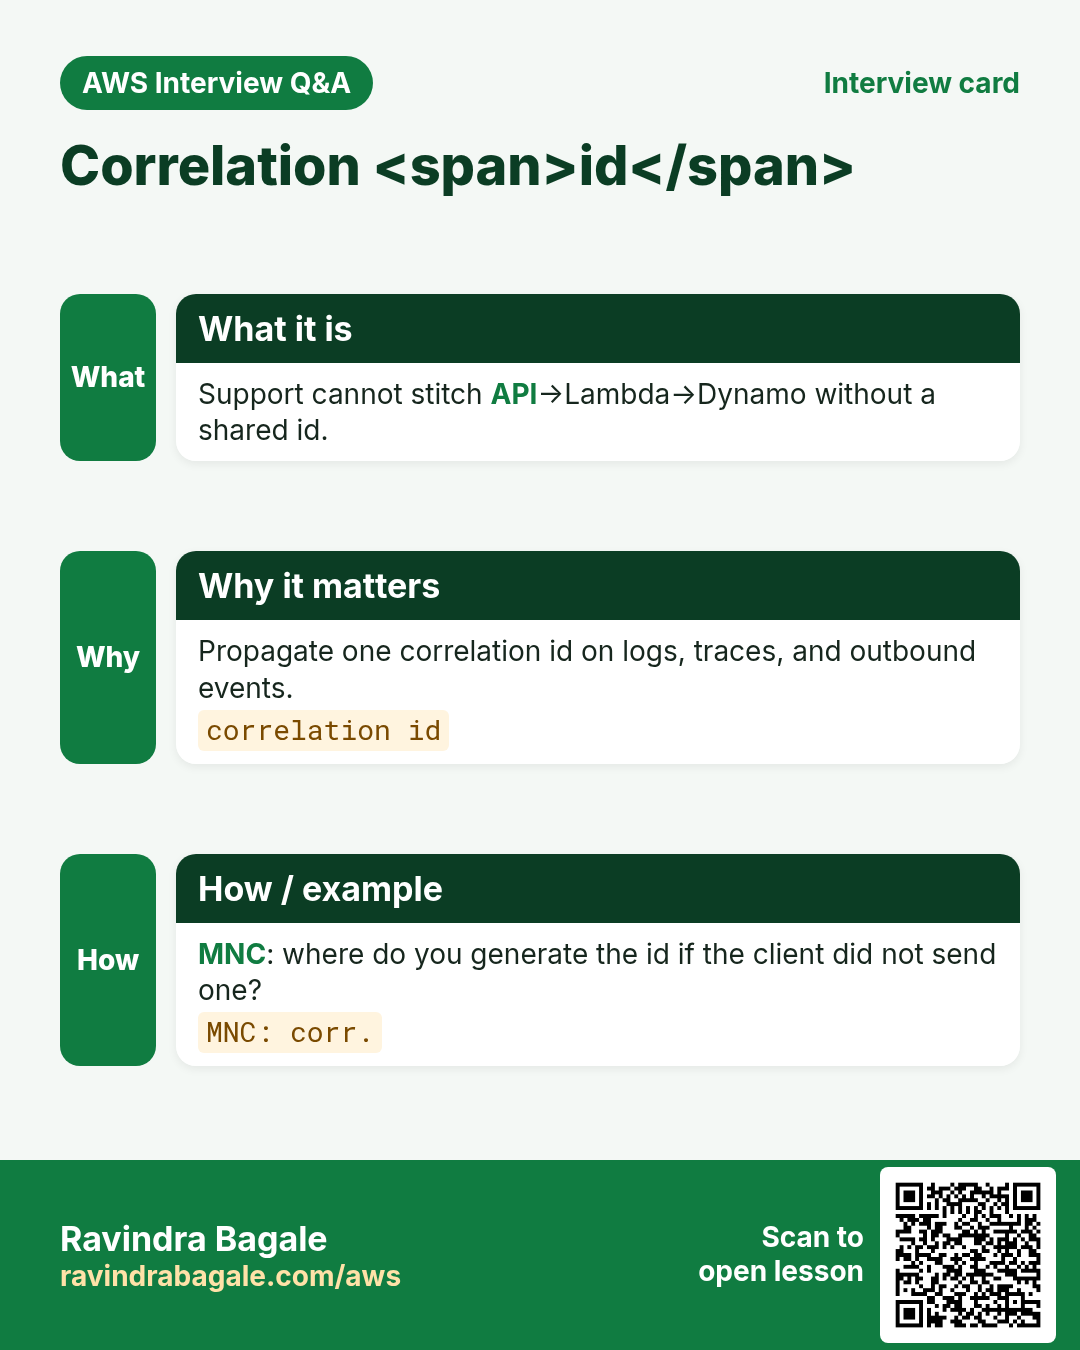
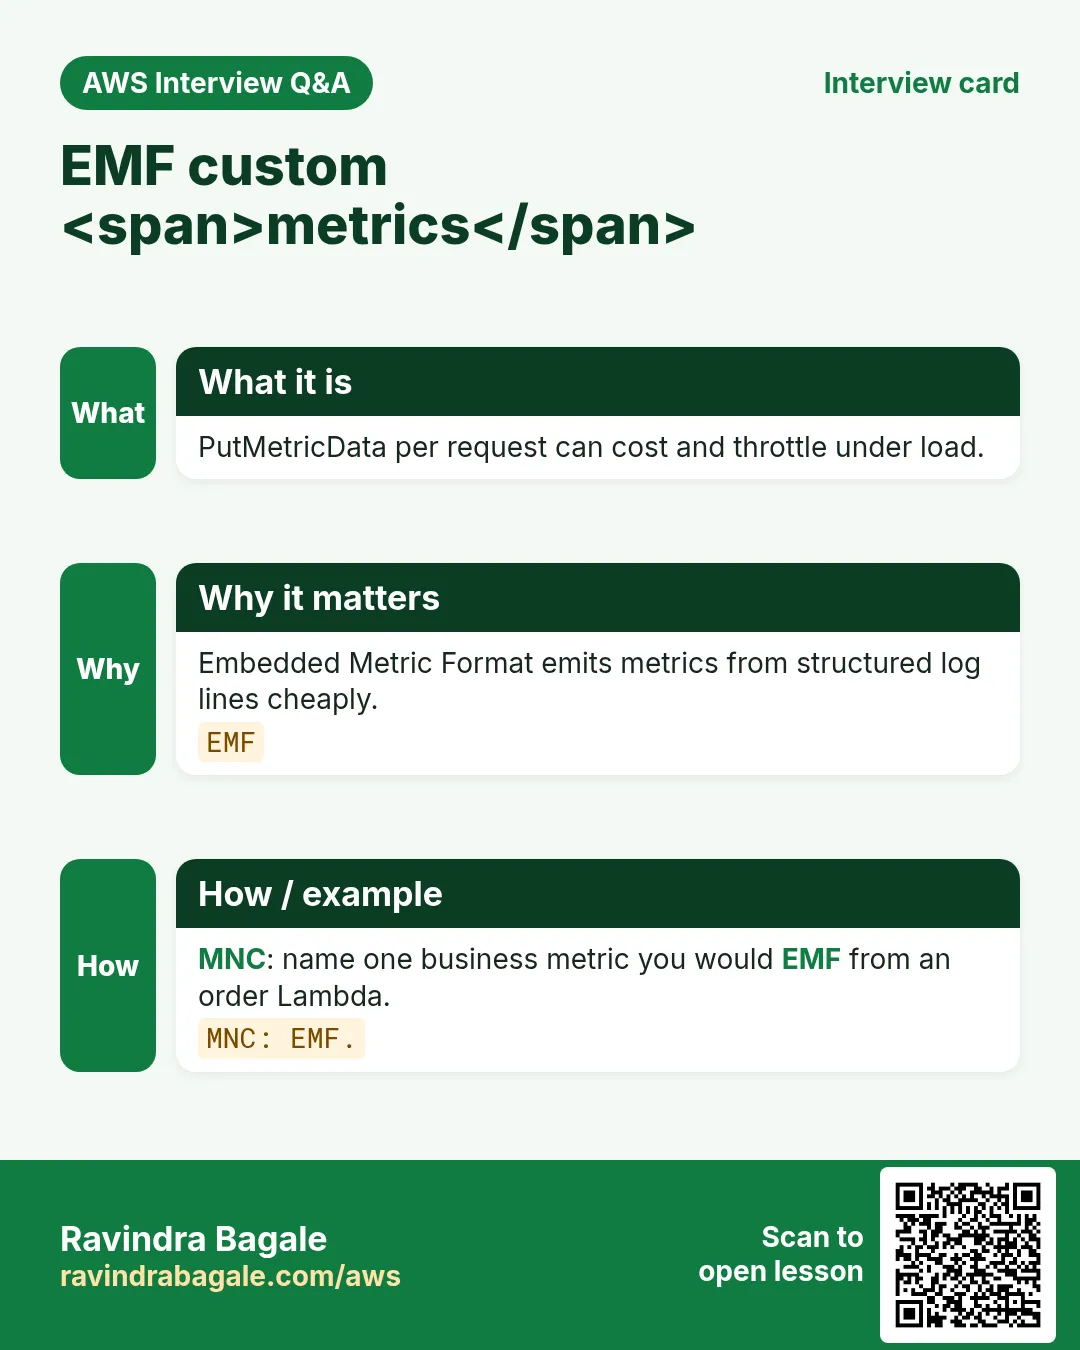
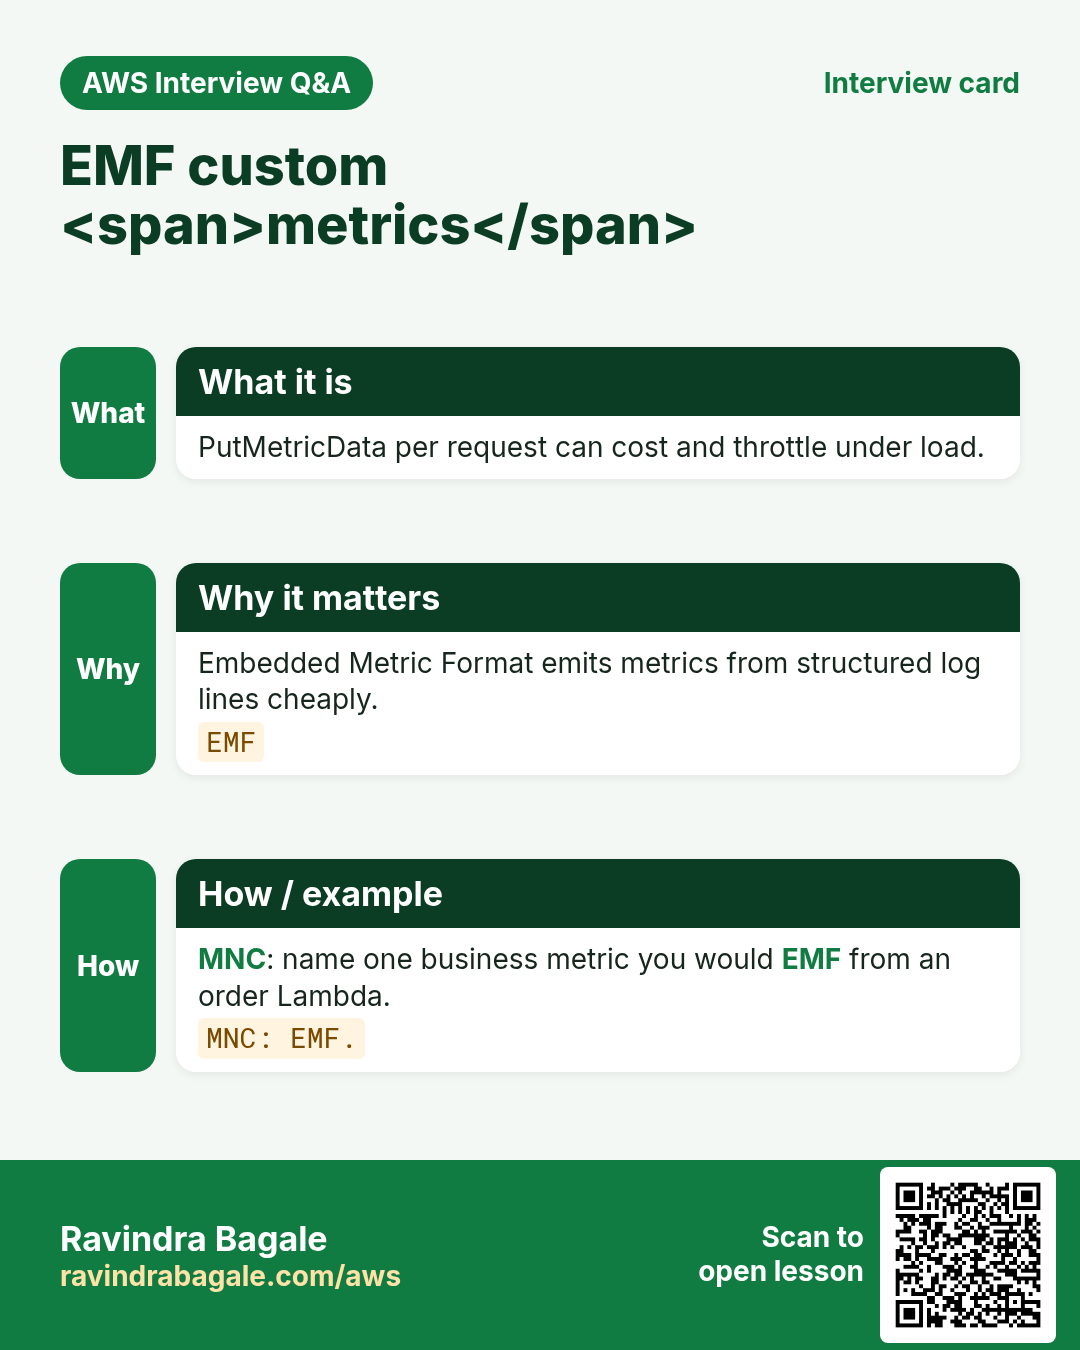
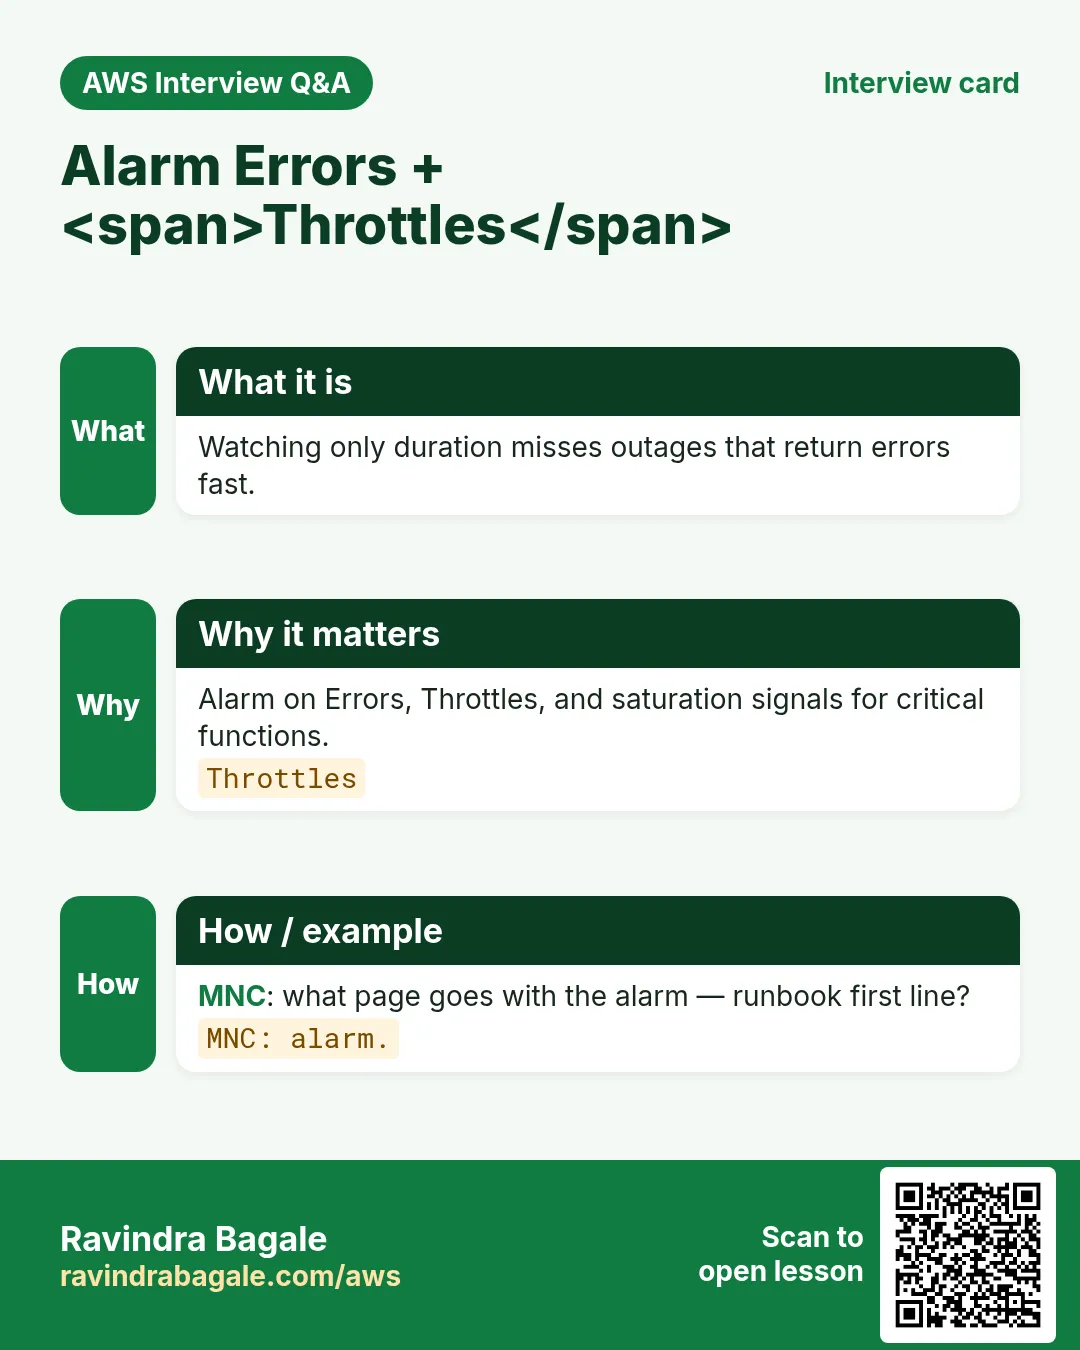
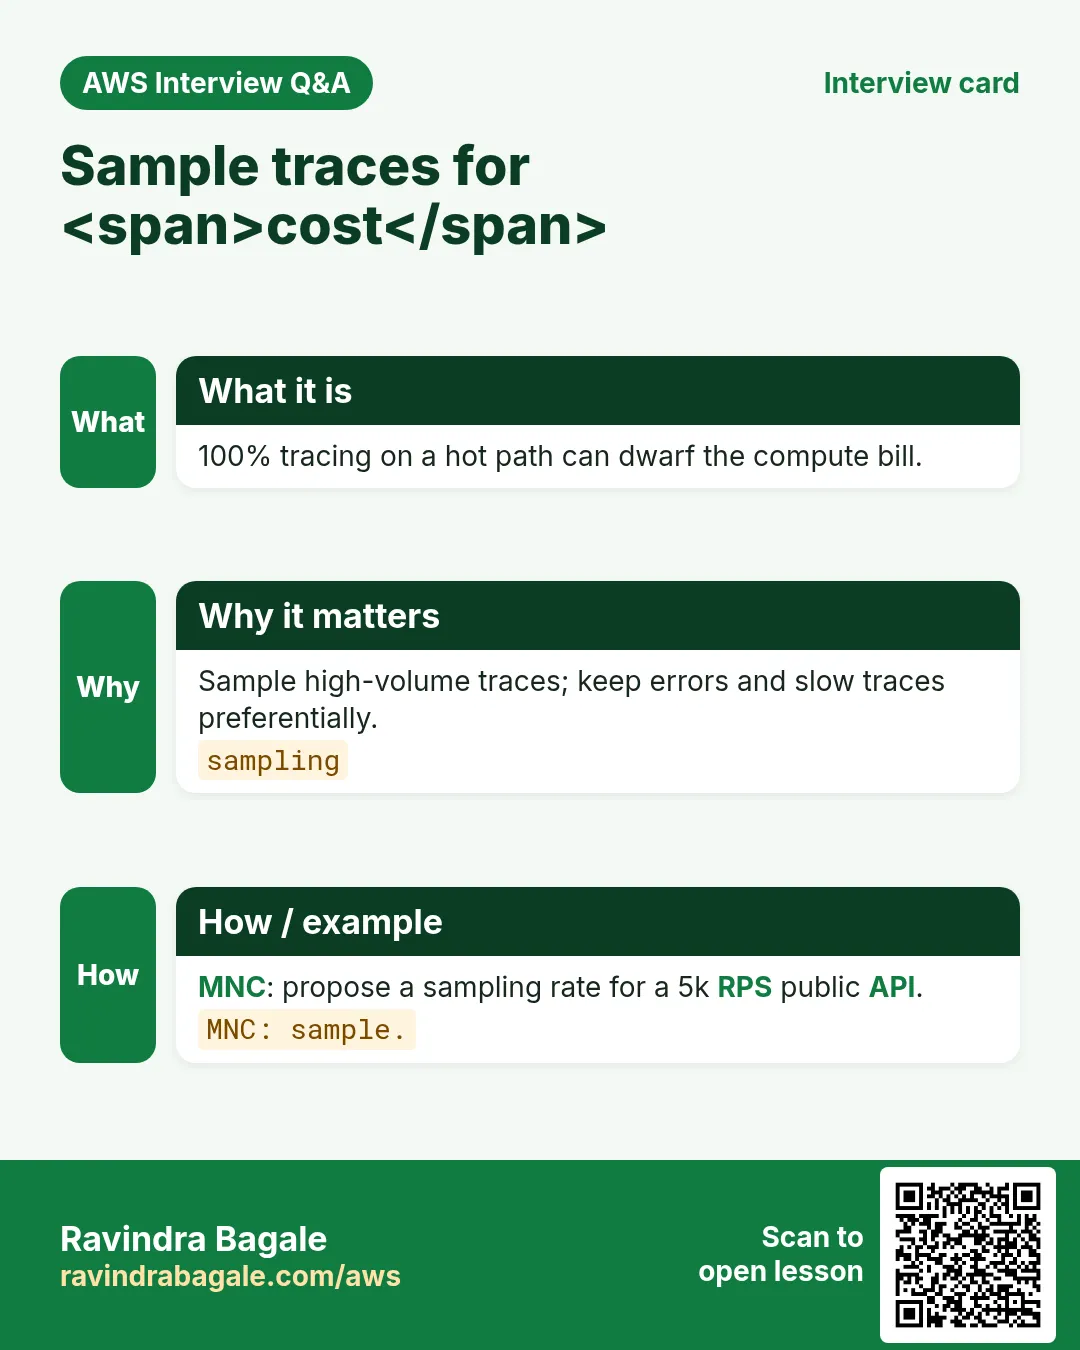
More cards: Ravi Sir's Cards.
Practice Tasks
Milan Furniture is a furniture business in Milan. Giulia Rossi looks after its IT and cloud work. They count money in EUR and run their AWS resources in the eu-south-1 Region. In the tasks below you do real jobs for them using what this lesson teaches. All names, account IDs, IP addresses and numbers are made up for practice.
0 / 16
Easy X-Ray traces requests — 1
Why: Trace.
What to do: Enter 1 if X-Ray helps trace a request across services.
- Write down the numbers the task gives you.
- Work it out step by step on paper.
- Type only the final answer in the box.
- Click Check answer.
Easy JSON logs structured — 1
Why: Logs.
What to do: Enter 1 if structured JSON logs are easier to query than free text.
- Write down the numbers the task gives you.
- Work it out step by step on paper.
- Type only the final answer in the box.
- Click Check answer.
Easy Correlation id — 1
Why: Link.
What to do: Enter 1 if a correlation id links logs across one user request.
- Write down the numbers the task gives you.
- Work it out step by step on paper.
- Type only the final answer in the box.
- Click Check answer.
Easy Powertools helpers — 1
Why: Lib.
What to do: Enter 1 if AWS Lambda Powertools adds logging tracing metrics helpers.
- Write down the numbers the task gives you.
- Work it out step by step on paper.
- Type only the final answer in the box.
- Click Check answer.
Easy List log groups
Why: CLI.
What to do: List CloudWatch log groups
- Read the task and decide which AWS service it is about.
- Write aws, then the service name, then the operation (the action word).
- Add each needed flag (--name) followed by its value from the task.
- Flags can be in any order. Click Check answer.
Easy Obs stack YAML
Why: Map.
What to do: YAML: traces: xray, logs: json, lib: powertools.
- Start from the top-level keys the task names.
- Indent child keys with 2 spaces (no tabs).
- Fill in each property with the value from the task.
- Click Check answer. Key order does not matter.
Easy Enable active tracing — 1
Why: XRay.
What to do: Enter 1 if Lambda active tracing sends segments to X-Ray.
- Write down the numbers the task gives you.
- Work it out step by step on paper.
- Type only the final answer in the box.
- Click Check answer.
Medium EMF custom metrics — 1
Why: Metrics.
What to do: Enter 1 if Embedded Metric Format emits custom metrics from logs.
- Write down the numbers the task gives you.
- Work it out step by step on paper.
- Type only the final answer in the box.
- Click Check answer.
Medium Alarm on errors — 1
Why: Ops.
What to do: Enter 1 if you alarm on Errors and Throttles for critical functions.
- Write down the numbers the task gives you.
- Work it out step by step on paper.
- Type only the final answer in the box.
- Click Check answer.
Medium Sample expensive traces — 1
Why: Cost.
What to do: Enter 1 if high-volume services often sample traces to control cost.
- Write down the numbers the task gives you.
- Work it out step by step on paper.
- Type only the final answer in the box.
- Click Check answer.
Medium Redact PII in logs — 1
Why: Safe.
What to do: Enter 1 if you must redact PII from application logs.
- Write down the numbers the task gives you.
- Work it out step by step on paper.
- Type only the final answer in the box.
- Click Check answer.
Medium Ops YAML
Why: Alarm.
What to do: YAML: alarm_on: errors, link: correlation_id.
- Start from the top-level keys the task names.
- Indent child keys with 2 spaces (no tabs).
- Fill in each property with the value from the task.
- Click Check answer. Key order does not matter.
Hard Metric InitDuration — 1
Why: Cold.
What to do: Enter 1 if InitDuration in reports reflects cold-start init time.
- Write down the numbers the task gives you.
- Work it out step by step on paper.
- Type only the final answer in the box.
- Click Check answer.
Hard One dashboard per svc — 1
Why: Ops.
What to do: Enter 1 if a service dashboard with latency errors saturation helps on-call.
- Write down the numbers the task gives you.
- Work it out step by step on paper.
- Type only the final answer in the box.
- Click Check answer.
Hard Avoid log noise — 1
Why: Hygiene.
What to do: Enter 1 if DEBUG spam in prod makes real incidents harder to find.
- Write down the numbers the task gives you.
- Work it out step by step on paper.
- Type only the final answer in the box.
- Click Check answer.
Hard Delete lab same day — 1
Why: Hygiene.
What to do: Enter 1 if lab-spj-obs should be deleted same day.
- Write down the numbers the task gives you.
- Work it out step by step on paper.
- Type only the final answer in the box.
- Click Check answer.