DynamoDB Monitoring: Troubleshooting Throttling and CloudWatch Metrics
Throttling is a symptom, not the disease. Lagos fintech on-call Tunde Okonkwo and Bengaluru SRE Nisha Rao said: We raised WCU twice — still throttled one PK. CloudWatch ConsumedWriteCapacity + ThrottledRequests + SuccessfulRequestLatency pointed to a hot partition, not a small table. Pair with hot partitions and capacity modes.
What you'll learn in this chapter
- Name the CloudWatch metrics that matter for DynamoDB
- Tell capacity throttle from hot-partition throttle
- Build alarms that wake humans for the right reason
- Run a diagnose → fix → verify loop
- Complete a monitoring lab and cleanup
1. Everyday example: highway toll gates
The highway has many lanes (partitions). One lane jammed with trucks (one hot PK) while others are empty looks like "not enough road" if you only count total cars (table WCU). CloudWatch is the traffic camera. ThrottledRequests is the red light count. Ravi Deshpande (Pune logistics) fixed a bursty TrackShipment PK with write sharding after the cameras showed the truth.
2. Vertical steps
3. Why do we need this?
Why do we need this?
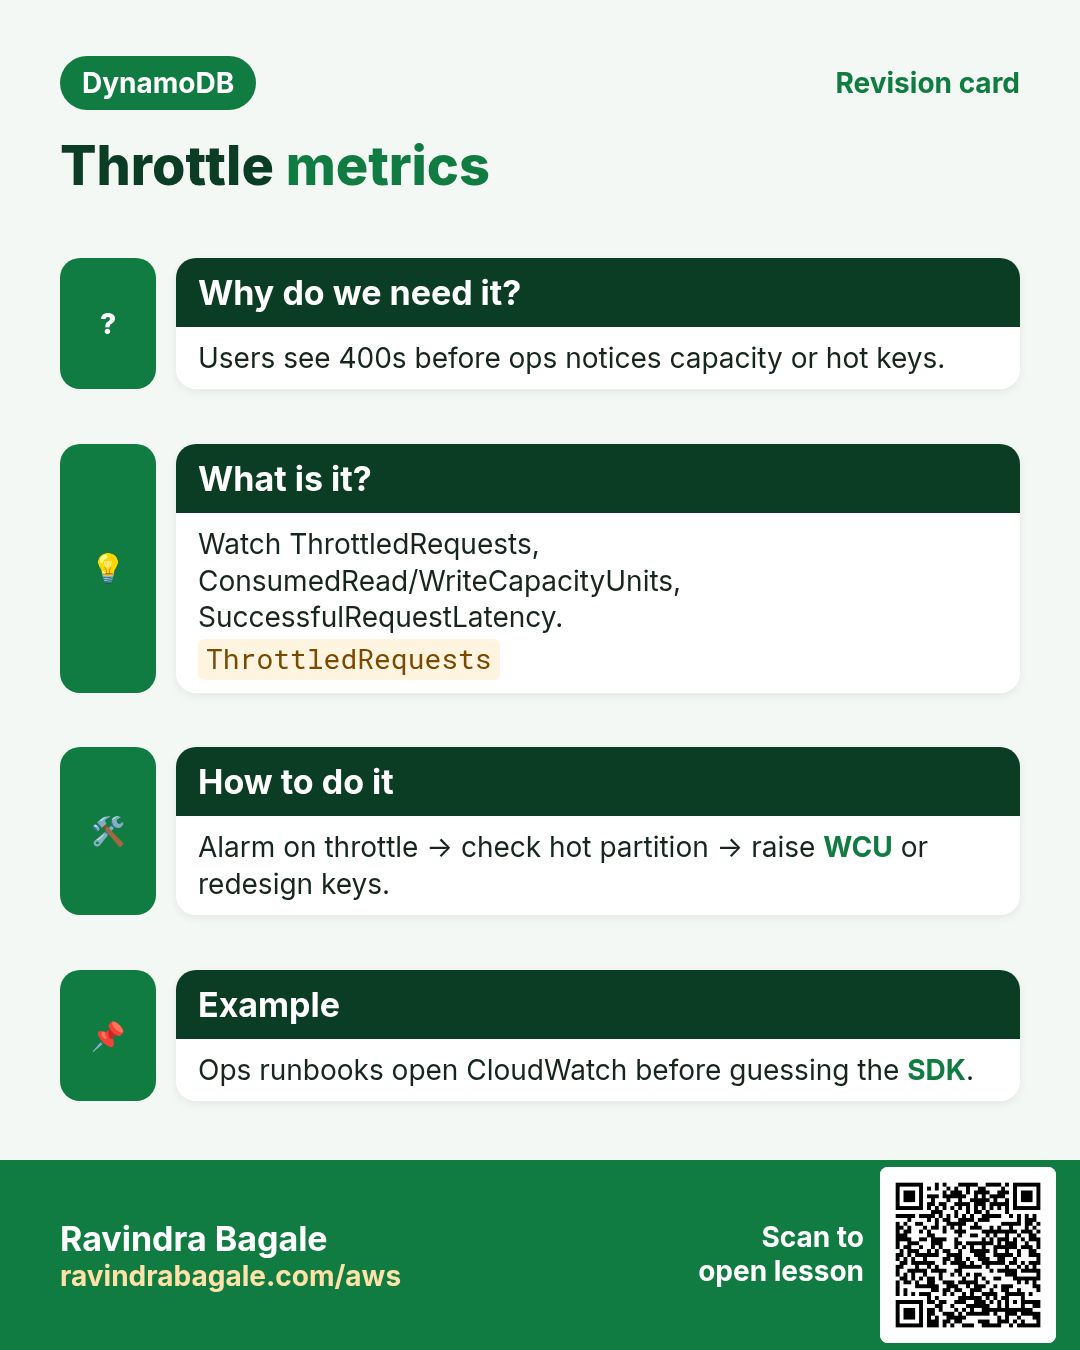
Users feel 400 throttling errors as "app down". Blindly buying more capacity wastes money when one key is hot. Without metrics and alarms you learn from angry tickets. Monitoring turns DynamoDB from a black box into a tunable system.
4. What is it?
What is it?
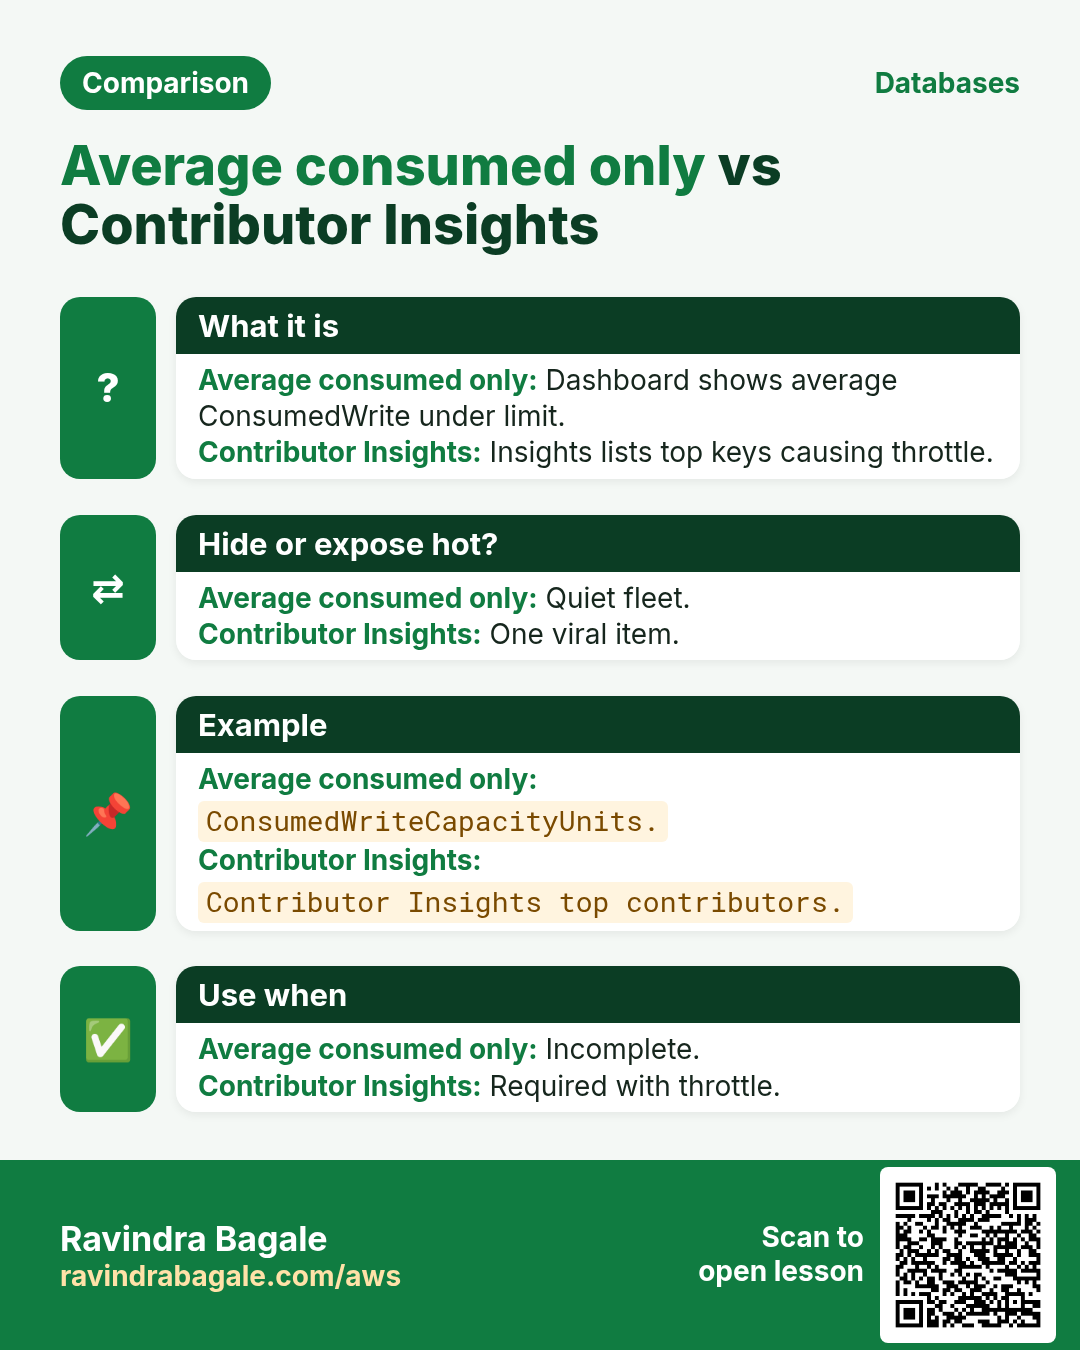
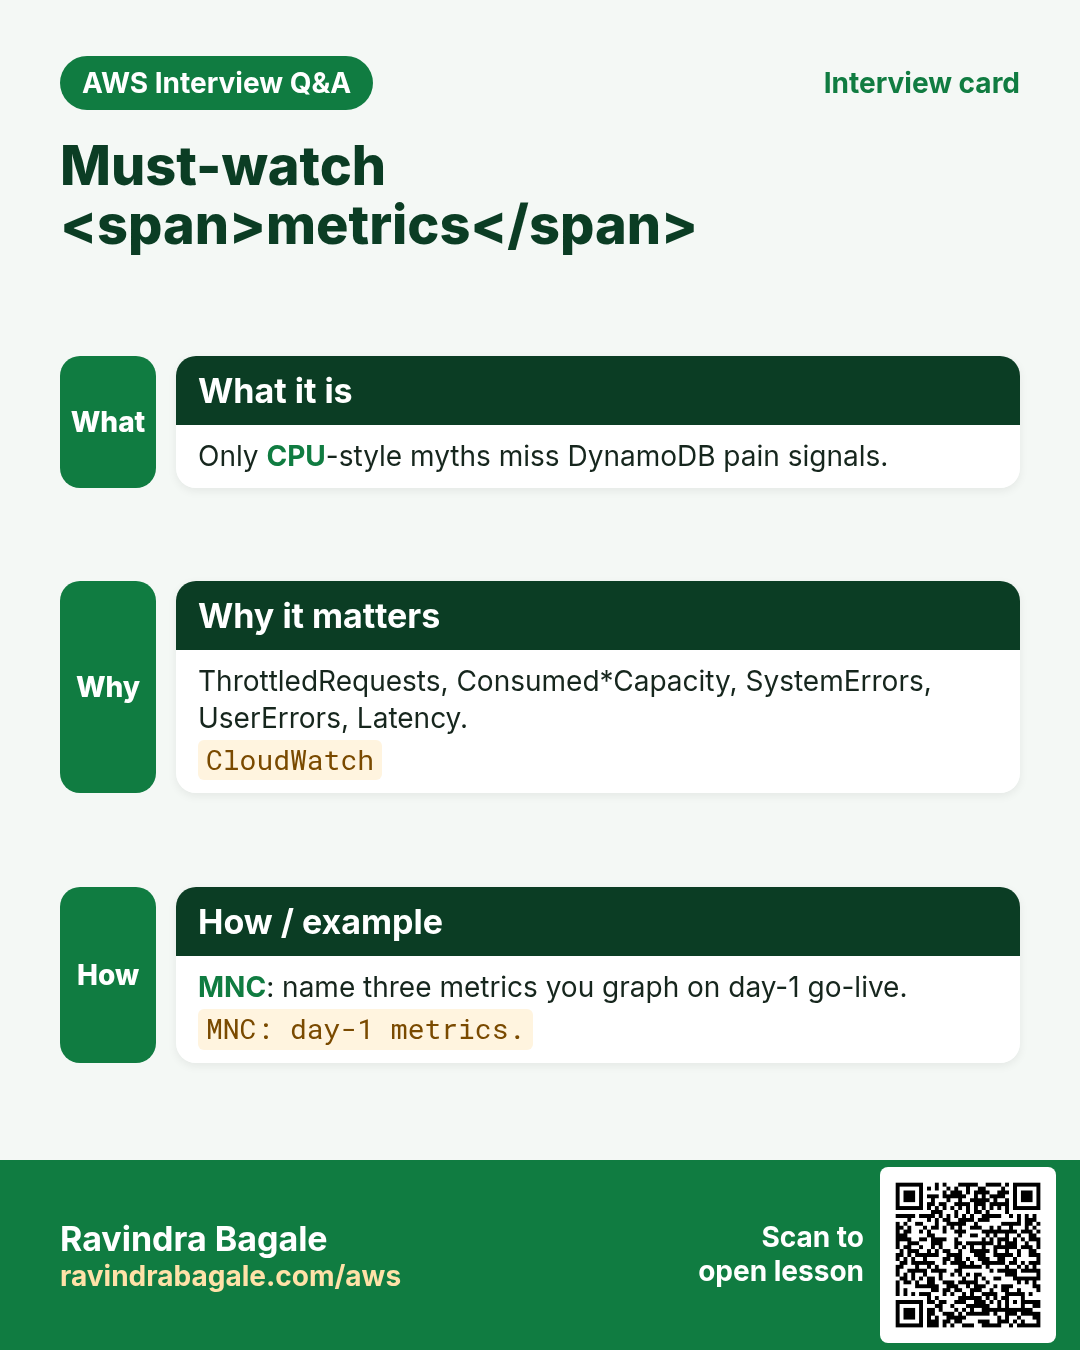
CloudWatch namespace AWS/DynamoDB: ConsumedReadCapacityUnits, ConsumedWriteCapacityUnits, Provisioned*, ThrottledRequests, ReadThrottleEvents, WriteThrottleEvents, SuccessfulRequestLatency, SystemErrors, UserErrors, ReturnedItemCount for Query/Scan. Contributor Insights (optional) highlights hottest keys. Alarms + dashboards + runbooks close the loop.
5. How to do it (step by step)
How to do it (step by step)
- Put a dashboard: consumed vs provisioned (or monitored on-demand peaks), throttles, latency p99.
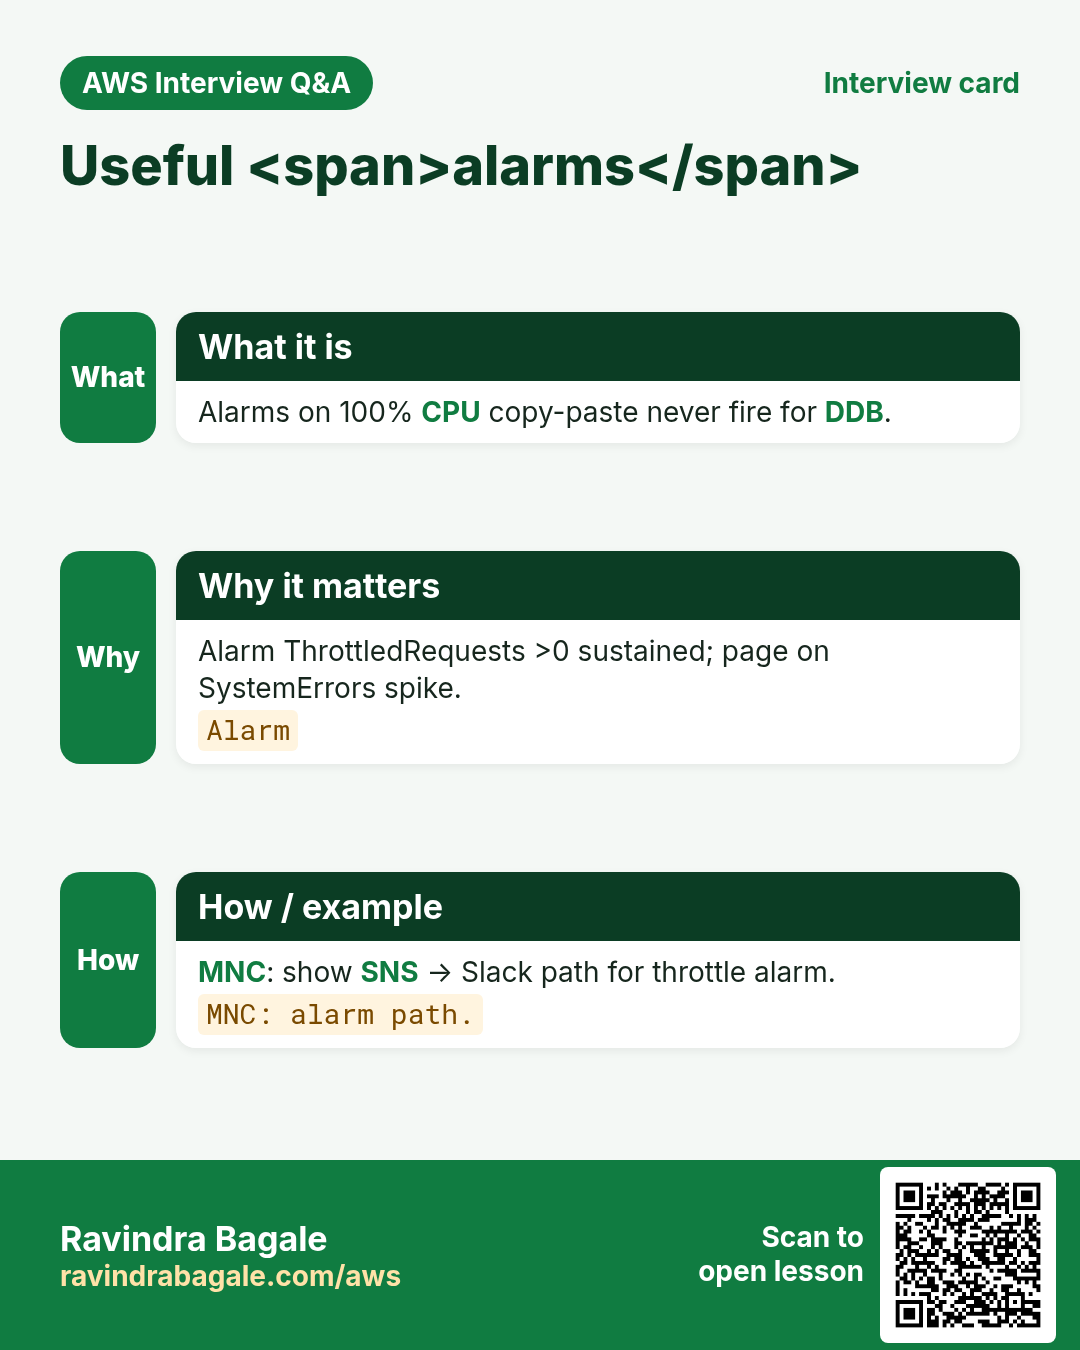
- Alarm ThrottledRequests > 0 for sustained minutes on production tables.
- Alarm SystemErrors and high UserErrors separately.
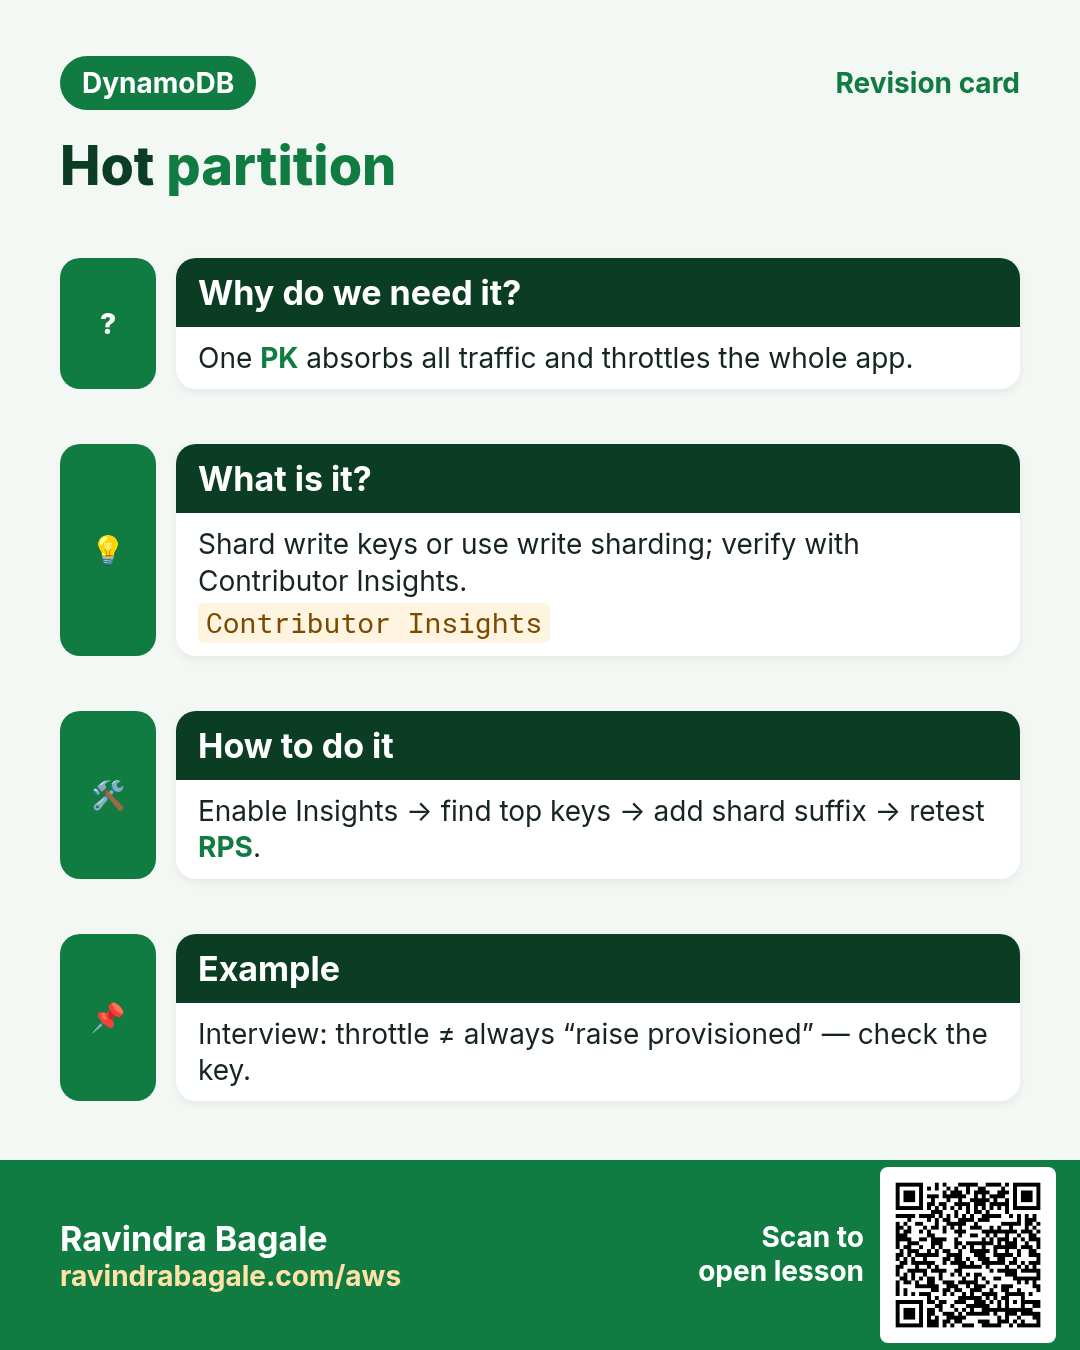
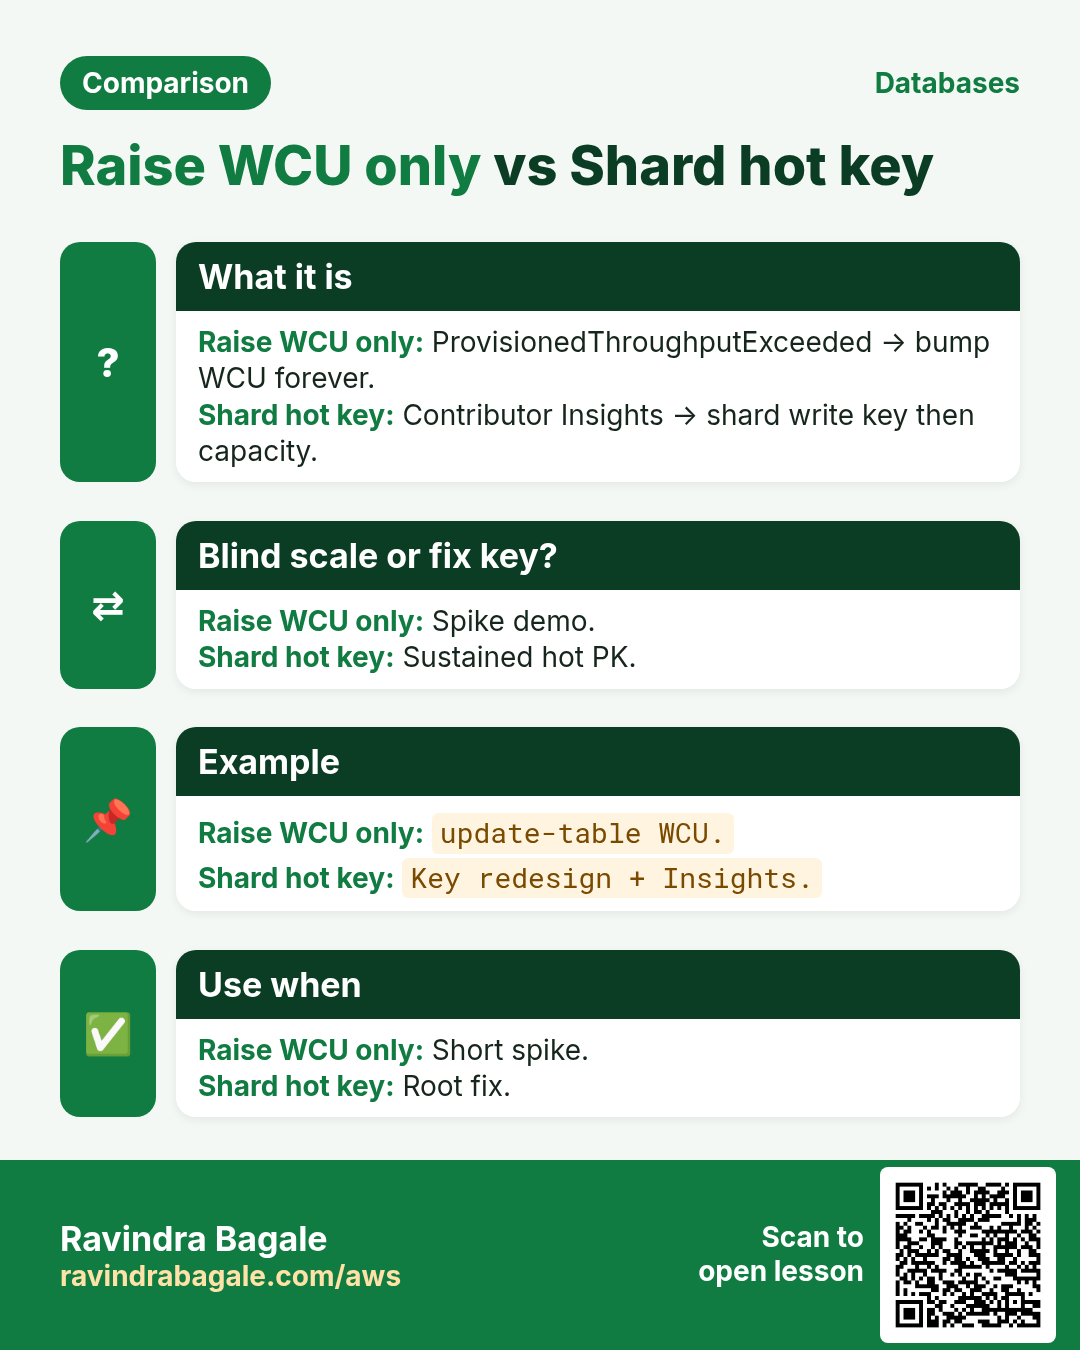
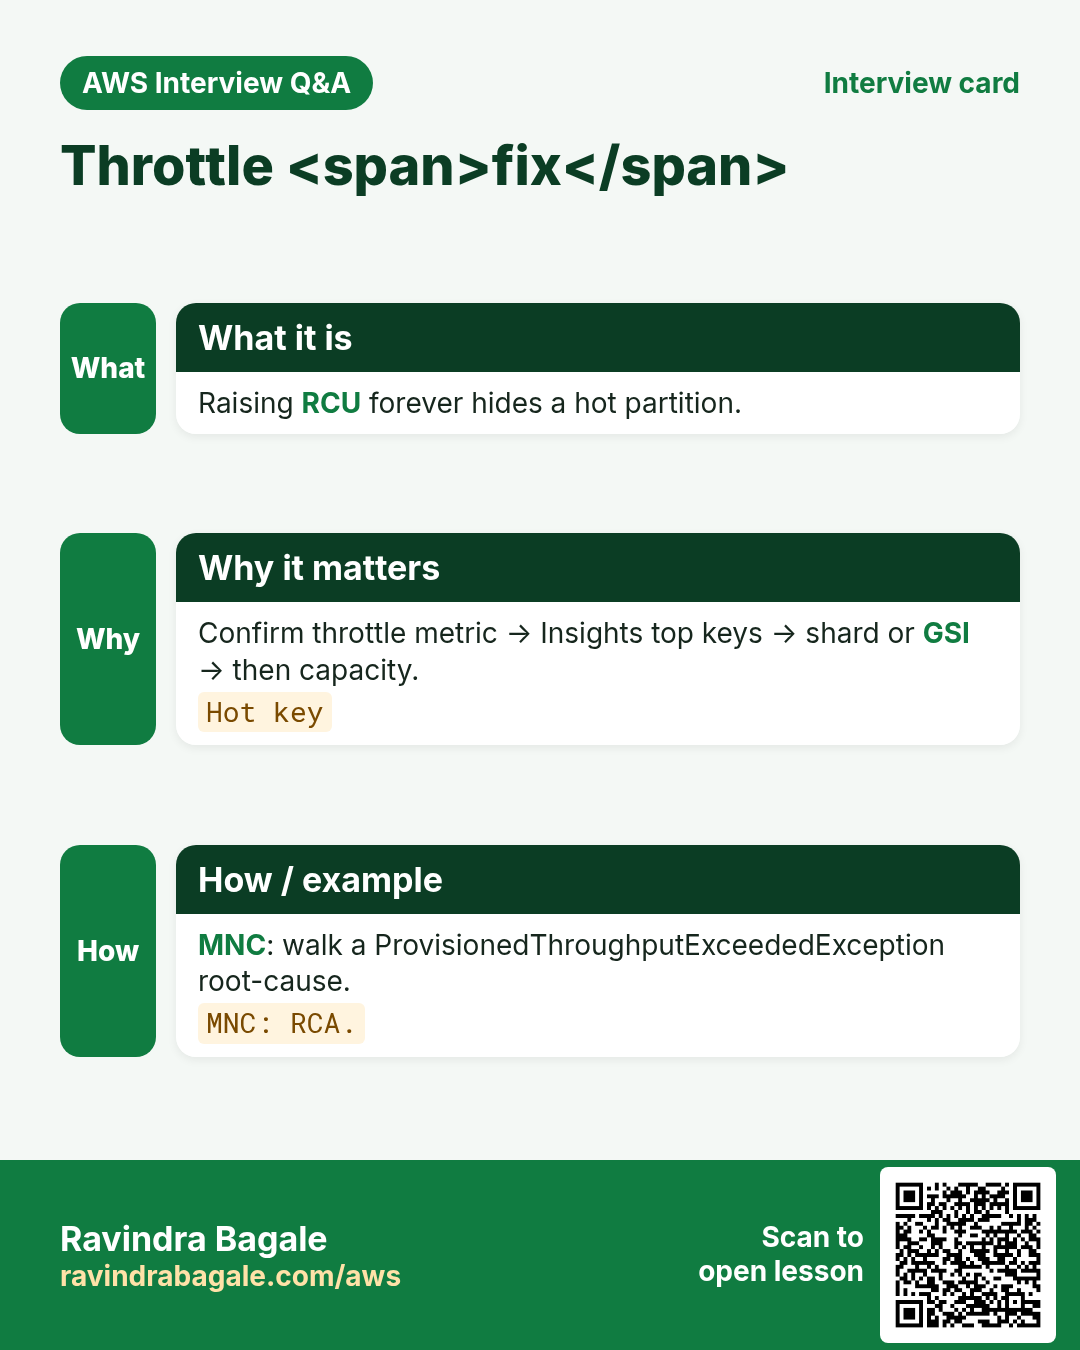
- On throttle: check if consumed ≈ provisioned (scale) OR one partition hot (shard/redesign).
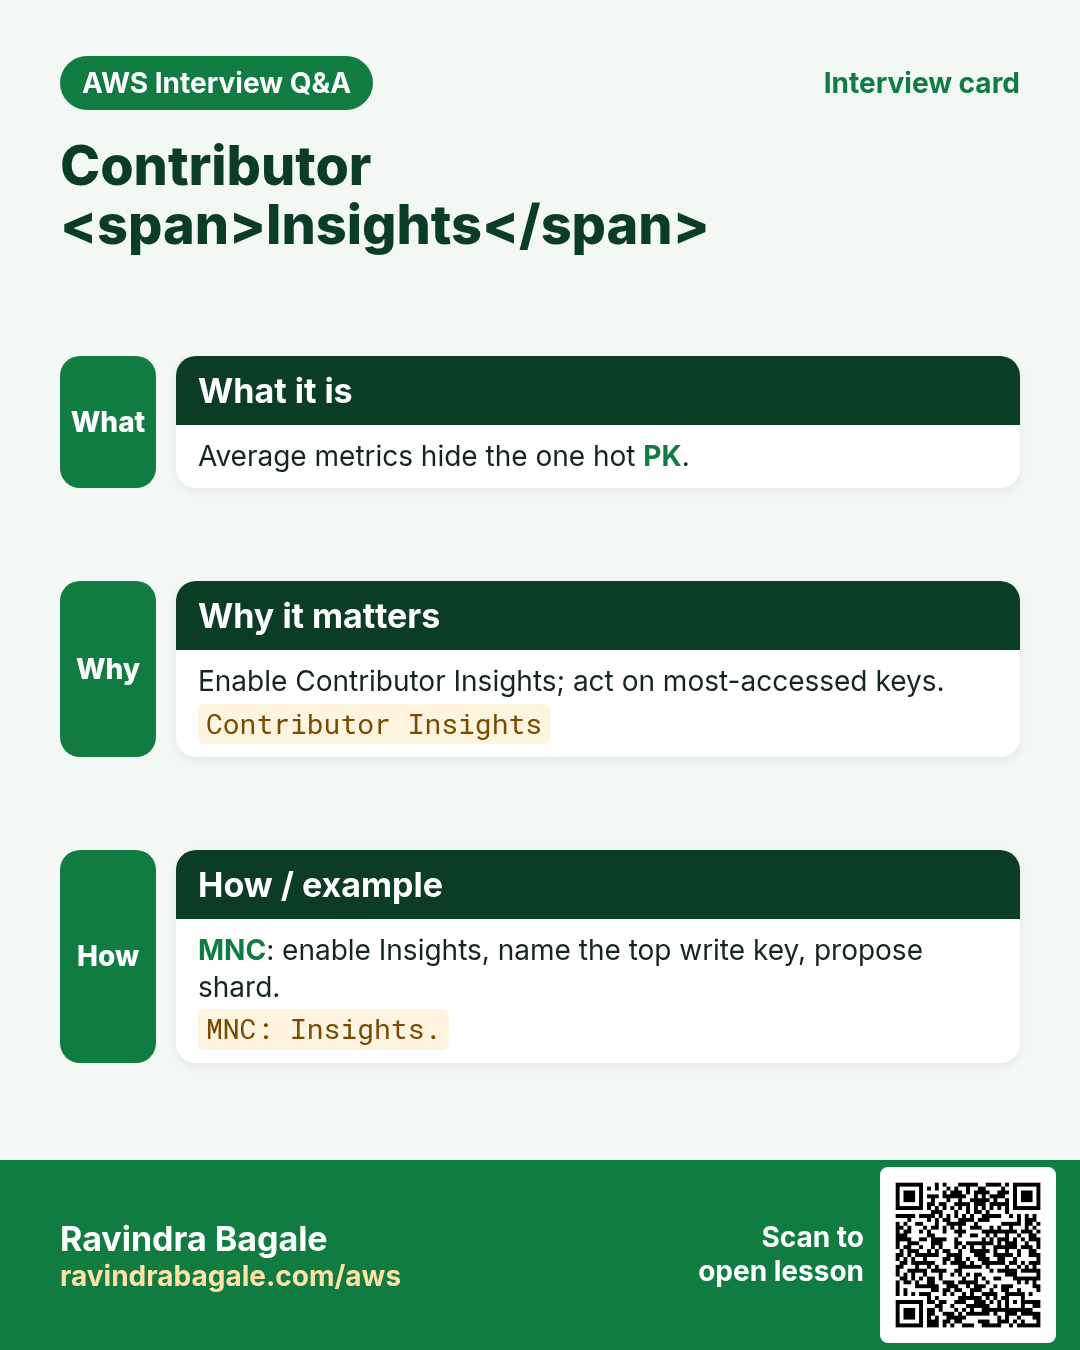
- Use CloudWatch Contributor Insights or emit PK hash logs carefully for hot-key proof.
- After fix: verify throttle = 0 and latency back to baseline.
- Review on-demand vs provisioned monthly using consumed history.
6. Throttle decision tree
| Signal | Likely cause | First fix |
|---|---|---|
| Consumed ≈ Provisioned, many keys | Table capacity short | Raise WCU/RCU or on-demand; autoscaling |
| Throttle + low overall consumed | Hot partition / hot key | Write shard, cache, or redesign PK |
| High latency, few throttles | Slow Query/Scan or GSI fan-out | Tighten KeyCondition; avoid Scan |
| UserErrors spike | Validation, ConditionalCheckFailed | Fix app conditions / payloads |
7. Commands with output and meaning
aws cloudwatch get-metric-statistics --namespace AWS/DynamoDB   --metric-name ThrottledRequests   --dimensions Name=TableName,Value=lab-dds-mon   --start-time 2026-11-01T00:00:00Z --end-time 2026-11-02T00:00:00Z   --period 300 --statistics Sum --region ap-south-1
# Output: Datapoints Sum>0 → throttling windows exist
aws cloudwatch get-metric-statistics --namespace AWS/DynamoDB   --metric-name ConsumedWriteCapacityUnits   --dimensions Name=TableName,Value=lab-dds-mon   --start-time 2026-11-01T00:00:00Z --end-time 2026-11-02T00:00:00Z   --period 60 --statistics Sum
# Meaning: compare shape to throttles — flat low consume + throttles ⇒ hot key
aws cloudwatch put-metric-alarm --alarm-name lab-dds-throttle   --namespace AWS/DynamoDB --metric-name ThrottledRequests   --dimensions Name=TableName,Value=lab-dds-mon   --statistic Sum --period 60 --evaluation-periods 3 --threshold 1   --comparison-operator GreaterThanOrEqualToThreshold   --treat-missing-data notBreaching
# Output: Alarm ARN — wakes you when throttles sustain
get-metric-statistics shows history. Compare consumed vs throttle shape. put-metric-alarm makes the pager honest. Delete lab alarms after practice.
8. Industry stories
- Fintech (Tunde Okonkwo): ledger table throttled one accountId; sharded writes fixed it.
- SRE (Nisha Rao): on-demand still throttled during extreme burst — smoothed client retries + jitter.
- Retail (Aisha Khan): flash sale GSI throttled; projected fewer attrs + higher GSI capacity.
- IoT (Mei Lin): device#day hot at midnight rollover; staggered TTL and shard.
- Media (Priya Nair): Scan job caused UserErrors and latency — moved to export.
- Gaming (Carlos Rivera): leaderboard sparse GSI + throttle alarms before launch.
9. Lab
How to do it (step by step)
- Create lab-dds-mon on-demand; put a burst of writes to one PK.
- Pull ThrottledRequests and ConsumedWriteCapacityUnits for the last hour.
- Create a throttle alarm (then delete it).
- Delete the table.
Cleanup (stop billing)
- Delete lab-dds-mon.
- Delete lab-dds-throttle alarm.
- Confirm resources gone.
10. Ops checklist before you ship
- Confirm TTL attribute name and units (epoch seconds).
- Decide soft-delete vs hard-delete vs archive-to-S3.
- Enable PITR on any table you cannot rebuild from source.
- Document RPO/RTO and who runs restore drills.
- If multi-region: pick write stickiness and conflict rules.
- If DAX: prove cache-miss path and warm-up plan.
- Tag Owner + Expiry on every lab resource.
- Budget alert in the account before load tests.
11. Copy-paste DynamoDB CLI starters (batch 2)
export AWS_DEFAULT_REGION=ap-south-1

# TTL status
aws dynamodb describe-time-to-live --table-name ShopApp

# PITR / continuous backups
aws dynamodb describe-continuous-backups --table-name ShopApp

# On-demand backup
aws dynamodb create-backup --table-name ShopApp --backup-name lab-shop-$(date +%Y%m%d)

# List backups
aws dynamodb list-backups --table-name ShopApp

# Global table description (v2)
aws dynamodb describe-table --table-name ShopApp --query 'Table.Replicas'
12. More industry stories
- Retail (Aisha Khan, Dubai): TTL clears abandoned carts; soft-delete keeps 30-day undo.
- Bank (Lucas Meyer, Berlin): PITR on ledger table; restore drill every quarter.
- Travel (Omar Haddad, Amman): Global Tables for catalog reads; inventory writes sticky.
- Gaming (Carlos Rivera, Mexico City): DAX for hot profile Gets; never cache money ledgers.
- Social (Priya Nair, Kochi): adjacency edges for follows; sparse GSI for unread inbox.
- IoT (Mei Lin, Shenzhen): device#day PK + TTL 14 days; rollups to S3.
13. Glossary (batch 2)
| Term | Meaning |
|---|---|
| TTL | Time to Live — attribute with epoch seconds; DynamoDB deletes later |
| Soft delete | Flag deleted=true; item remains until TTL/archive |
| PITR | Point-in-time recovery — continuous backups window |
| Global Table | Multi-region replicated DynamoDB table |
| LWW | Last-writer-wins conflict resolution on replicas |
| DAX | DynamoDB Accelerator — in-memory cache cluster |
| Adjacency list | Edge items modeling relationships in one table |
| Fan-out | Write once; push copies to many feeds/inboxes |
14. Practice: explain out loud
- 60s: TTL vs soft-delete vs S3 archive.
- 60s: PITR vs on-demand backup.
- 60s: when Global Tables help and hurt.
- 60s: DAX consistency trade-off.
- 60s: CartLite checkout keys in one breath.
- 60s: follow edge vs feed item.
- Record once; cut filler; record again.
15. Safe lab hygiene
- Use ap-south-1 labs with a budget alert.
- Prefix lab tables with lab- and your initials.
- Delete replicas, DAX clusters, and backups you created for labs.
- Never enable Global Tables on production without a write plan.
- Tag every resource Owner + Expiry.
- Export/import labs can create large S3 bills — delete prefixes.
16. How this set links other chapters
- Data modeling — keys we reuse in projects.
- Transactions — checkout and seat patterns.
- Streams + Lambda — fan-out and CDC.
- CRUD survey — short TTL note we deepen.
- What Is DynamoDB? — intro.
17. Delete / archive decision pad
| Need | Prefer | Why |
|---|---|---|
| Undo 7-30 days | Soft-delete flag | User restore |
| Hard expiry, no read | TTL attribute | Auto delete later |
| Compliance keep cold | Export/archive to S3 | Cheap long store |
| Mistake recovery | PITR / backup | Table-level restore |
18. Ten oral drill questions
- What units does DynamoDB TTL use?
- Does TTL delete instantly?
- PITR window typical length?
- Global Tables conflict default?
- When sticky writes matter?
- DAX vs API Gateway cache?
- Cart PK for a shopper?
- Order lines under which PK?
- Follow edge SK example?
- Unread inbox sparse GSI idea?
19. RPO / RTO mini workshop
- Write the worst data loss you can accept (RPO) in minutes.
- Write how long restore may take (RTO) before business pain.
- Map: on-demand backup vs PITR vs multi-region replica.
- Schedule a restore drill on a lab table this month.
- Name the person who runs the drill.
20. Cost watch list (batch 2)
- PITR storage and on-demand backup storage.
- Global Tables: replicated WCUs in every region.
- DAX node hours even at idle.
- Export to S3 + S3 storage + Athena later.
- Streams + Lambda still bill during TTL deletes.
21. Project Definition of Done
- Access patterns written and peer-reviewed.
- Sample items drawn for happy path + one failure.
- Lab table created, exercised, deleted (or tagged Expiry).
- At least one conditional write or transaction exercised.
- Cleanup commands pasted in your notes.
- One interview answer recorded out loud.
22. Cross-links inside this batch
- TTL hygiene → Backup/PITR for “oops” recovery.
- Global Tables → sticky writes from capacity/hot lessons.
- DAX → only after Query shapes are correct.
- P1 CartLite reuses modeling + transactions.
- P2 Social reuses adjacency + Streams ideas.
23. Quick self-check (yes/no)
- I can explain TTL delay vs instant DeleteItem.
- I know when soft-delete beats hard delete.
- I can start PITR and say what restore costs in time.
- I can name one reason NOT to use Global Tables.
- I know DAX does not fix a bad partition key.
- I can sketch CartLite USER# and ORD# keys.
- I can sketch a follow edge item.
- I delete lab replicas/DAX/backups the same day.
24. Common errors and fixes
Each row is a real mistake students and juniors hit. Read the fix before you panic.
| Error / symptom | Fix |
|---|---|
| Only watch table WCU | Watch throttles + latency too. |
| Scale on every spike | Check hot key first. |
| Alarm on 1 datapoint noise | Use evaluation periods. |
| Ignore GSI metrics | GSIs throttle separately. |
| No runbook on alarm | Link diagnose tree. |
| Scan to "debug" prod | Query + metrics instead. |
| Missing dimension TableName | Always dimension. |
| Treat ConditionalCheckFailed as throttle | That is UserErrors. |
| No post-fix verify | Confirm throttle flat. |
25. Troubleshooting checklist
- Throttle + low consume: hot partition — shard or redesign.
- Throttle + high consume: raise capacity or on-demand.
- Empty metrics: wrong region/name/dimension.
- Alarm flapping: lengthen period / datapoints.
- Latency high without throttle: heavy Query or network.
26. FAQ
Q. Should I always use a single table?
Often yes for related access patterns; not a religion. Separate tables are fine for unrelated domains or different capacity/security needs.
Q. Do I still need RDS?
Yes for heavy joins, multi-row SQL reports, and strong relational constraints. See the intro DynamoDB vs RDS chapter.
Q. Is Scan evil?
Scan is a tool for rare admin jobs and small tables. Design so hot paths use Query/GetItem.
Q. Where are Put/Get command details?
In the CRUD survey, CLI and SDK chapters — this deep set links them instead of copying.
Q. Does on-demand never throttle?
It scales automatically but extreme instant spikes and hot partitions can still throttle.
Q. Contributor Insights cost?
Optional paid feature — use when you need hottest keys; start with metrics+logs.
Q. Which latency metric?
SuccessfulRequestLatency with GetItem/Query operations; watch p99.
Q. Alarm to Slack/Pager?
SNS topic on alarm → chat/pager integration.
Q. Name three must-watch DynamoDB metrics.
Consumed R/W, ThrottledRequests, SuccessfulRequestLatency (plus errors).
Q. How do you spot a hot partition from metrics?
Throttles while table-wide consumed is well under provisioned/peak.
Q. First fix for capacity shortfall vs hot key?
Scale/on-demand vs shard/redesign.
Q. MNC interview: debug production throttling.
Dashboard → throttle vs consumed → GSI → hot key proof → fix → verify alarm clear.
Try at home
- Draw a 4-panel dashboard for your table.
- Write a 5-line throttle runbook.
- List which GSIs need their own alarms.
In short
- Watch consumed, throttles, latency, errors.
- Throttle + low consume ⇒ hot key.
- Throttle + high consume ⇒ capacity.
- Alarms need runbooks and verify step.
- Link back to keys and capacity chapters.
Revision, interview and comparison cards
Revise this lesson in a few minutes. Save the cards on your phone or download them as PNG files. The QR code on each card opens this lesson.
More cards: Ravi Sir's Cards.
Practice Tasks
Vidarbha Cotton Mills is a textiles business in Nagpur. Ganesh Wankhede looks after its IT and cloud work. They count money in INR and run their AWS resources in the ap-south-1 Region. In the tasks below you do real jobs for them using what this lesson teaches. All names, account IDs, IP addresses and numbers are made up for practice.
0 / 16
Easy Watch ThrottledRequests — 1
Why: Metric.
What to do: Enter 1 if dashboards must include ThrottledRequests.
- Write down the numbers the task gives you.
- Work it out step by step on paper.
- Type only the final answer in the box.
- Click Check answer.
Easy Low consume + throttle = hot — 1
Why: Signal.
What to do: Enter 1 if throttle with low consumed often means hot key.
- Write down the numbers the task gives you.
- Work it out step by step on paper.
- Type only the final answer in the box.
- Click Check answer.
Easy High consume + throttle = scale — 1
Why: Signal.
What to do: Enter 1 if throttle near provisioned means raise capacity/on-demand.
- Write down the numbers the task gives you.
- Work it out step by step on paper.
- Type only the final answer in the box.
- Click Check answer.
Easy Watch latency p99 — 1
Why: Metric.
What to do: Enter 1 if SuccessfulRequestLatency p99 matters.
- Write down the numbers the task gives you.
- Work it out step by step on paper.
- Type only the final answer in the box.
- Click Check answer.
Easy Describe mon table
Why: CLI.
What to do: Describe table ShopApp
- Read the task and decide which AWS service it is about.
- Write aws, then the service name, then the operation (the action word).
- Add each needed flag (--name) followed by its value from the task.
- Flags can be in any order. Click Check answer.
Easy Metrics YAML
Why: Names.
What to do: YAML: throttle: ThrottledRequests, consumed: ConsumedWriteCapacityUnits.
- Start from the top-level keys the task names.
- Indent child keys with 2 spaces (no tabs).
- Fill in each property with the value from the task.
- Click Check answer. Key order does not matter.
Easy No prod Scan debug — 1
Why: Anti.
What to do: Enter 1 if you should not Scan prod to debug throttles.
- Write down the numbers the task gives you.
- Work it out step by step on paper.
- Type only the final answer in the box.
- Click Check answer.
Medium GSI throttles separately — 1
Why: Scope.
What to do: Enter 1 if GSIs can throttle on their own.
- Write down the numbers the task gives you.
- Work it out step by step on paper.
- Type only the final answer in the box.
- Click Check answer.
Medium On-demand can still throttle — 1
Why: Truth.
What to do: Enter 1 if on-demand can still throttle on extreme bursts/hot keys.
- Write down the numbers the task gives you.
- Work it out step by step on paper.
- Type only the final answer in the box.
- Click Check answer.
Medium Eval periods on alarms — 1
Why: Hygiene.
What to do: Enter 1 if throttle alarms need evaluation periods.
- Write down the numbers the task gives you.
- Work it out step by step on paper.
- Type only the final answer in the box.
- Click Check answer.
Medium CCF is UserErrors — 1
Why: Classify.
What to do: Enter 1 if ConditionalCheckFailed is UserErrors not throttle.
- Write down the numbers the task gives you.
- Work it out step by step on paper.
- Type only the final answer in the box.
- Click Check answer.
Medium Fix YAML
Why: Tree.
What to do: YAML: hot: shard, short: scale.
- Start from the top-level keys the task names.
- Indent child keys with 2 spaces (no tabs).
- Fill in each property with the value from the task.
- Click Check answer. Key order does not matter.
Hard Alarm needs runbook — 1
Why: Ops.
What to do: Enter 1 if every prod throttle alarm links a runbook.
- Write down the numbers the task gives you.
- Work it out step by step on paper.
- Type only the final answer in the box.
- Click Check answer.
Hard Verify after fix — 1
Why: Close.
What to do: Enter 1 if you re-check metrics until throttles clear.
- Write down the numbers the task gives you.
- Work it out step by step on paper.
- Type only the final answer in the box.
- Click Check answer.
Hard Dimension TableName — 1
Why: CW.
What to do: Enter 1 if metrics need TableName dimension.
- Write down the numbers the task gives you.
- Work it out step by step on paper.
- Type only the final answer in the box.
- Click Check answer.
Hard Delete lab same day — 1
Why: Hygiene.
What to do: Enter 1 if lab-dds-mon should be deleted same day.
- Write down the numbers the task gives you.
- Work it out step by step on paper.
- Type only the final answer in the box.
- Click Check answer.