Excel Dashboards: 52 Free Dashboard Templates (Brand, Industry and Business)
All Excel dashboards on this site are on this one page. There are 4 groups: brand dashboards, industry dashboards, business systems with a dashboard, and lessons that teach you to build one. Every workbook is free to download.
About this page
Pick a group. Open a guide. Download the workbook. Change the drop-downs and see the KPIs change. All data is made up for practice.
या page बद्दल
एक group निवडा. Guide उघडा. Workbook download करा. Drop-down बदला आणि KPI बदलताना पहा. सगळा data सरावासाठी काल्पनिक आहे.
इस page के बारे में
एक group चुनें. Guide खोलें. Workbook download करें. Drop-down बदलें और KPI बदलते देखें. सारा data अभ्यास के लिए काल्पनिक है.
Why, what and how
Why
Managers and interviewers ask: "Which KPIs would you track for this business?" A ready dashboard helps you answer and practise.
What
| Group | Count | What you get |
|---|---|---|
| 1. Brand dashboards | 15 | Themed dashboards inspired by famous businesses, 15 KPIs, 6 charts, 3 filters |
| 2. Industry dashboards | 11 | One dashboard per industry, plus a Top 10 Companies dashboard |
| 3. Business systems with a dashboard | 26 | Complete small-business systems (billing, stock, fees) with a dashboard sheet |
| 4. Learn to build dashboards | 9 | Chapters, lessons, practice and interview questions |
How
- Pick a group below.
- Open the guide page.
- Download the .xlsx file.
- Change the drop-down filters.
- Then build your own with group 4.
1. Brand dashboards (15)
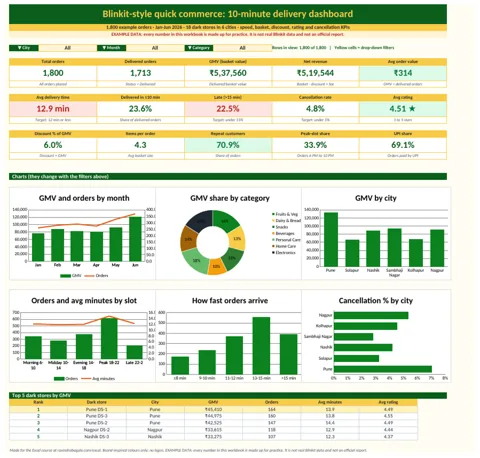
A quick commerce app promises groceries in about 10 minutes. The owner must see speed, basket size and cancellations every day.
Open the guide · Download .xlsx
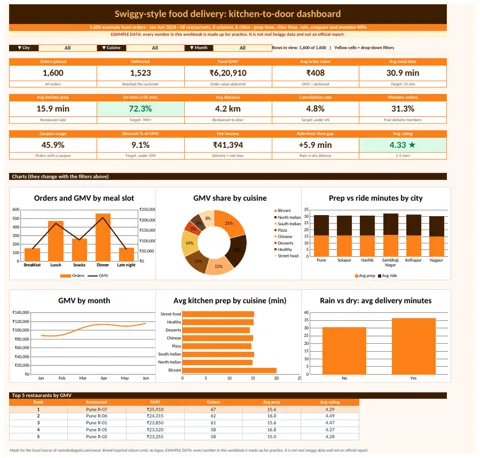
A food delivery app must bring hot food fast. Kitchen time, rider time and rain all change how happy the customer is.
Open the guide · Download .xlsx
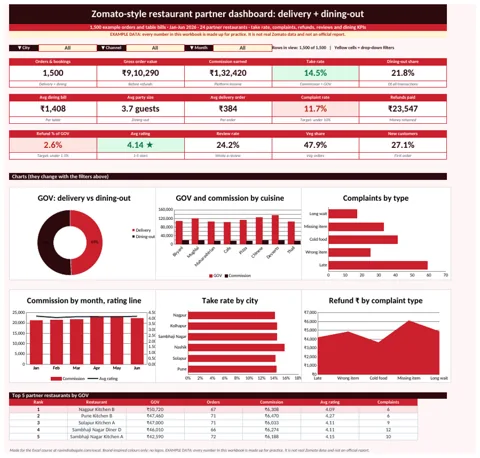
A food platform earns commission from restaurants. It must watch take rate, dining-out bookings, complaints and refunds.
Open the guide · Download .xlsx
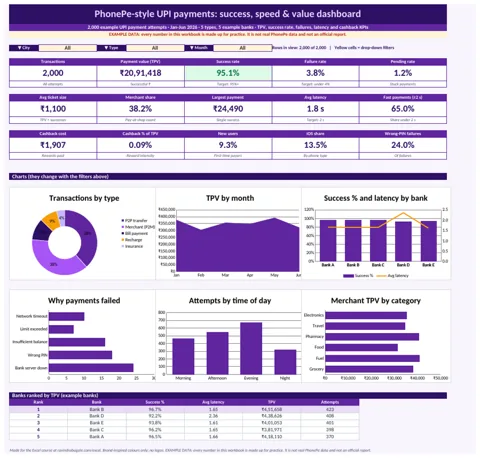
A UPI app handles lakhs of payments. Every failed or slow payment is an unhappy user, so success rate and speed matter most.
Open the guide · Download .xlsx
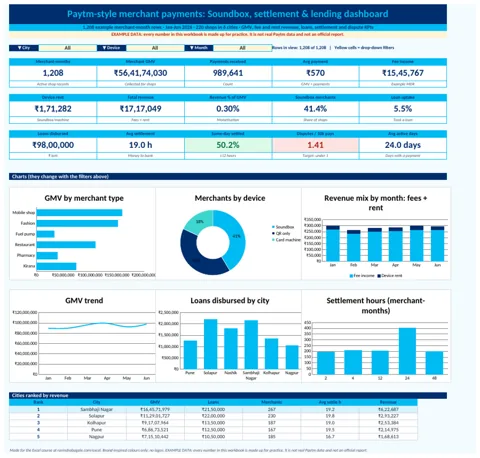
A payments company serves shops. It earns fees and device rent, gives loans and must send money to shops quickly.
Open the guide · Download .xlsx
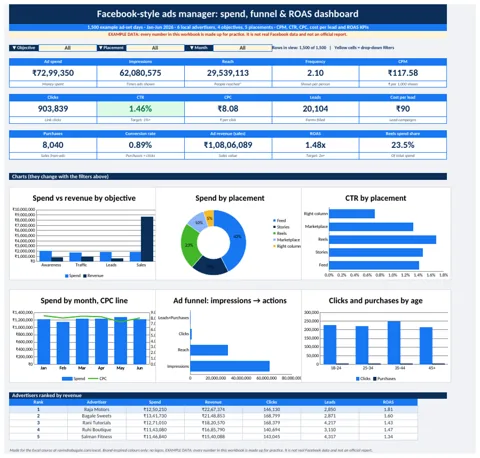
Small businesses spend money on Facebook ads. They must know which ads bring clicks, leads and sales for each rupee.
Open the guide · Download .xlsx
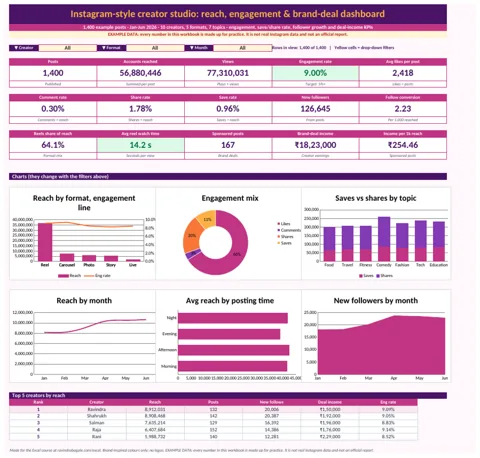
A creator posts reels, photos and stories. They must know which posts reach people, get engagement and earn brand deals.
Open the guide · Download .xlsx
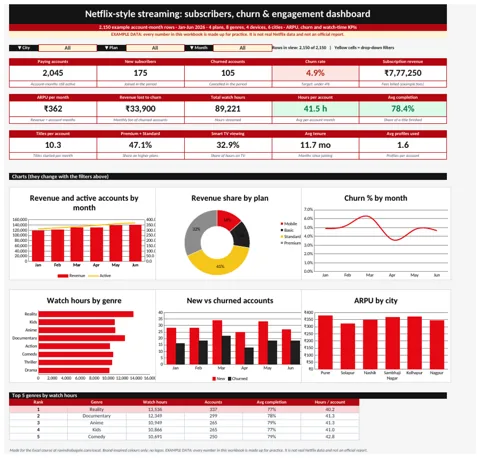
A streaming app earns a monthly fee. It must keep people watching, or they cancel (churn).
Open the guide · Download .xlsx
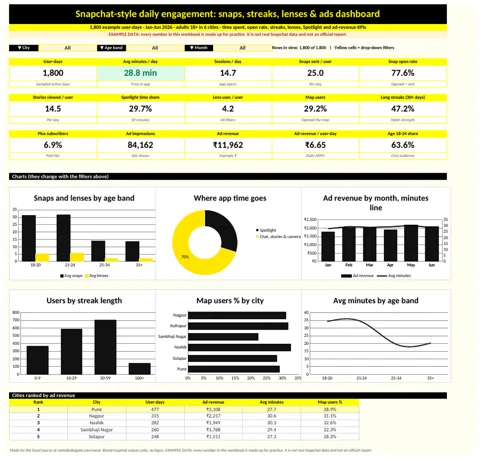
A camera and chat app lives on daily habits. Time spent, streaks and lenses show if users love it; ads bring the money.
Open the guide · Download .xlsx
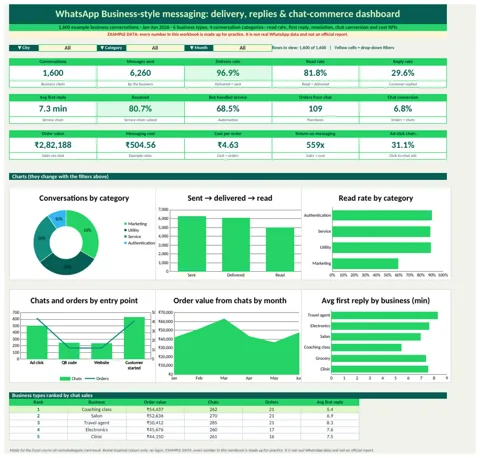
Shops and clinics talk to customers on WhatsApp. They must reply fast, solve problems and turn chats into orders.
Open the guide · Download .xlsx
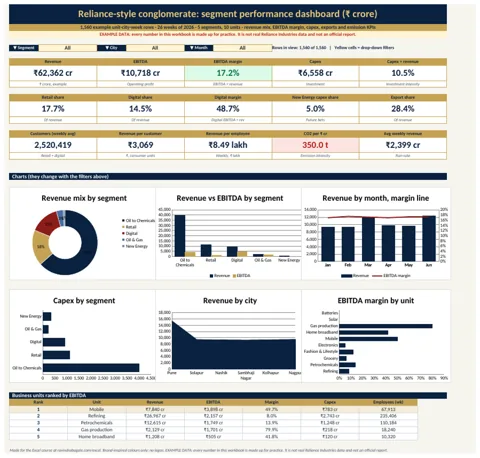
A big group runs many businesses: oil, retail, digital, gas and new energy. The board compares revenue, profit and investment by segment.
Open the guide · Download .xlsx
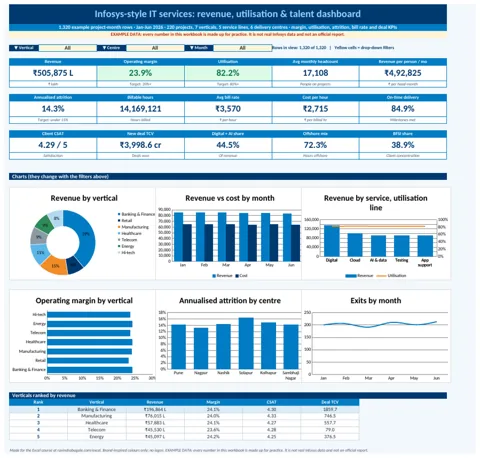
An IT services company sells people's hours to clients. Utilisation, bill rate and attrition decide its profit.
Open the guide · Download .xlsx
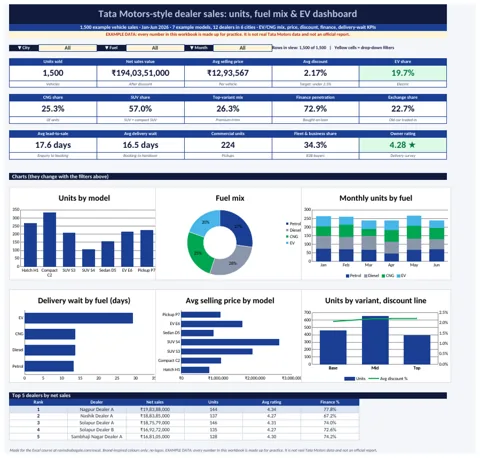
A car maker sells through dealers. It watches units, EV and CNG share, discounts and how long buyers wait.
Open the guide · Download .xlsx
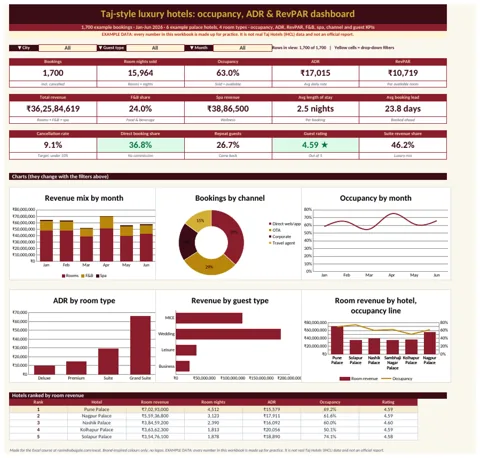
A luxury hotel sells rooms, food and spa. Occupancy, ADR and RevPAR tell the manager if rooms earn enough.
Open the guide · Download .xlsx
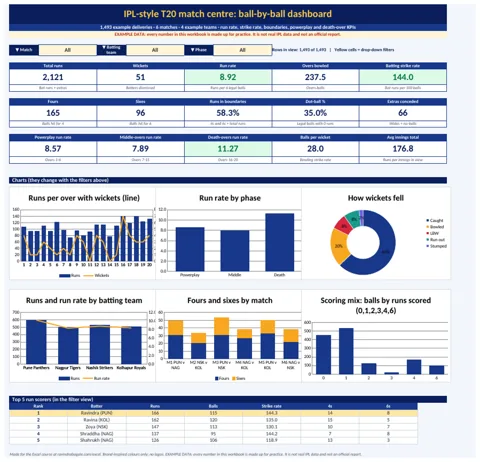
A T20 analyst studies every ball. Run rate, strike rate, boundaries and phase of the innings show who is winning.
Open the guide · Download .xlsx
2. Industry dashboards (11)
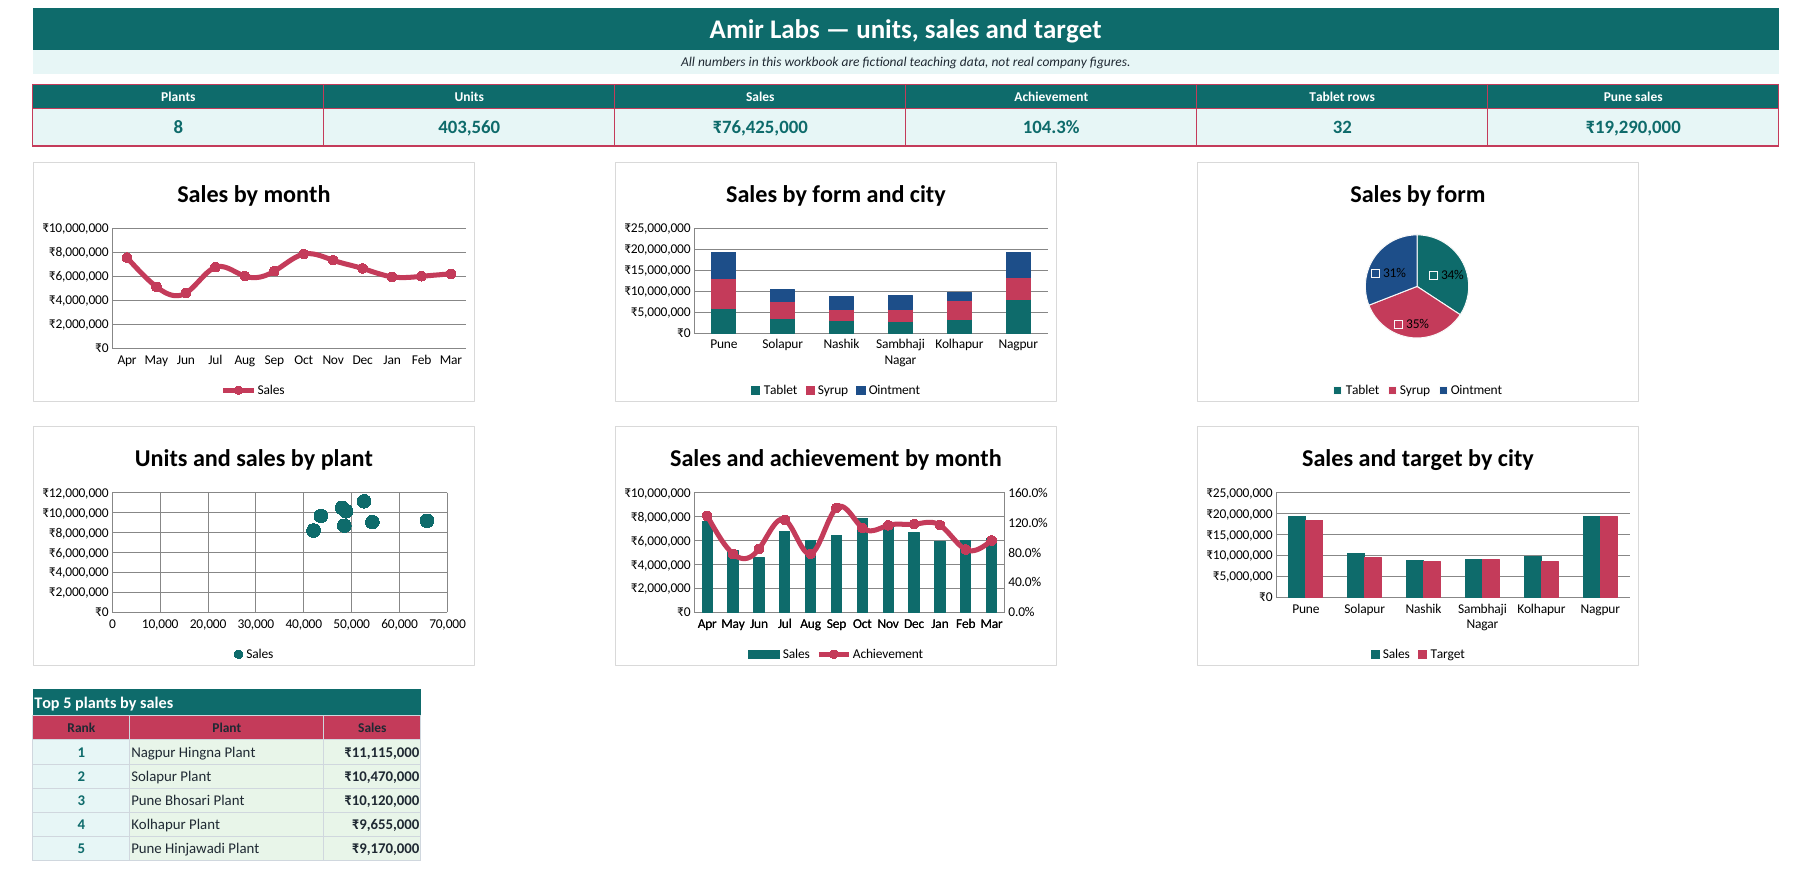
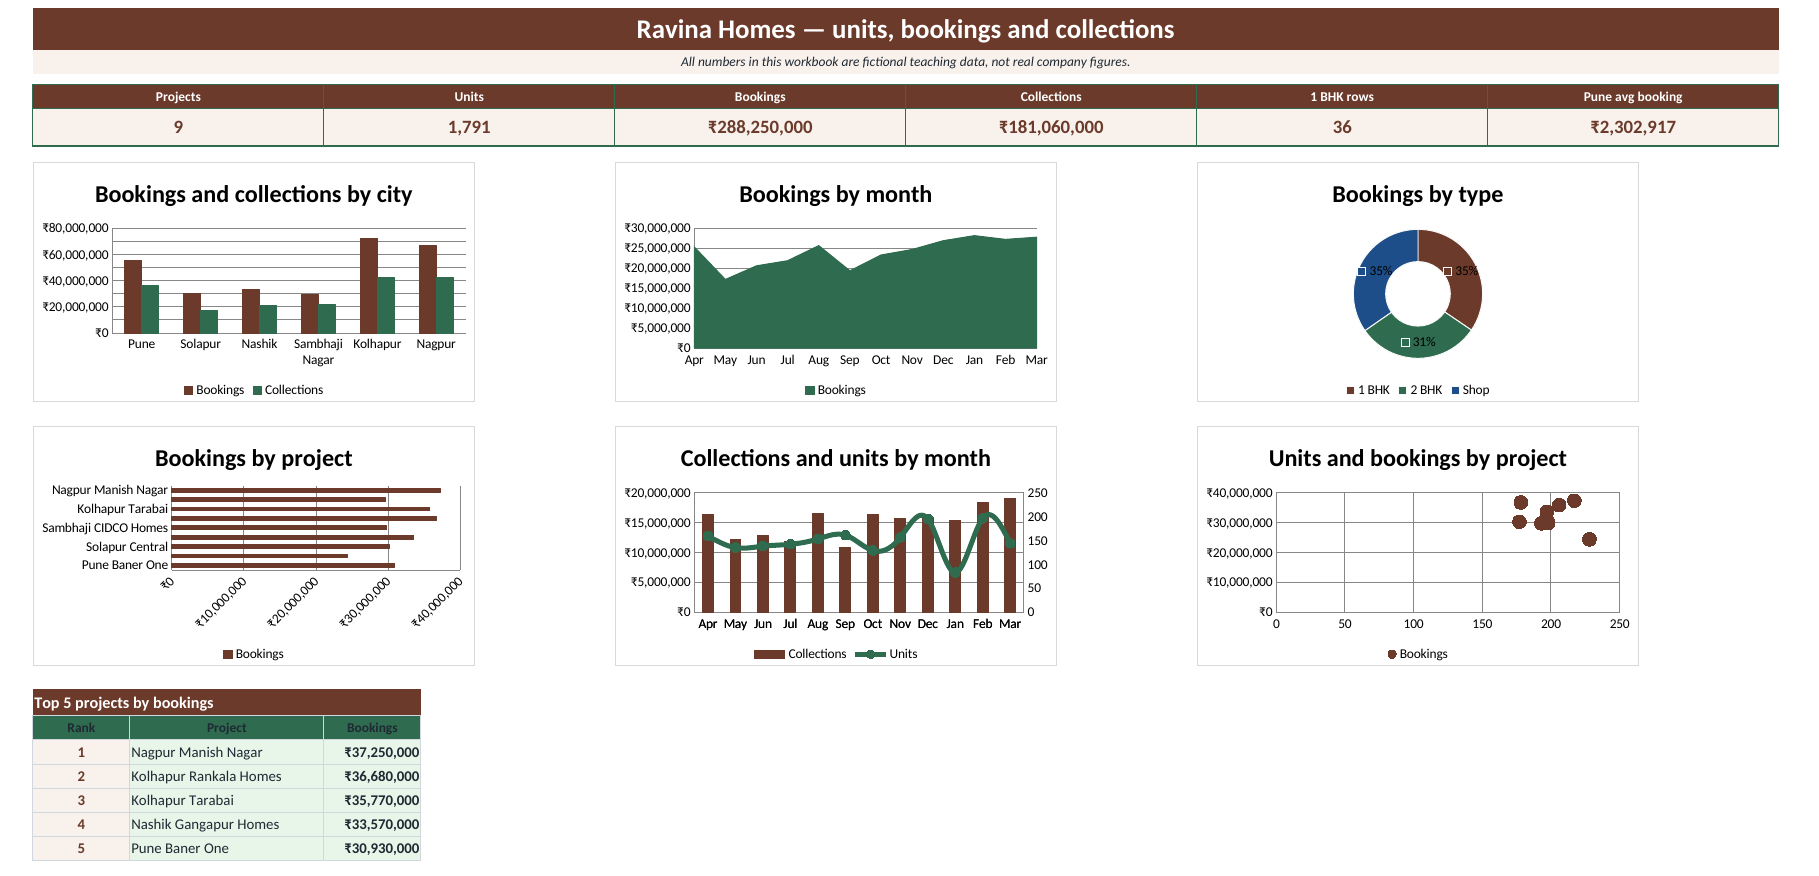
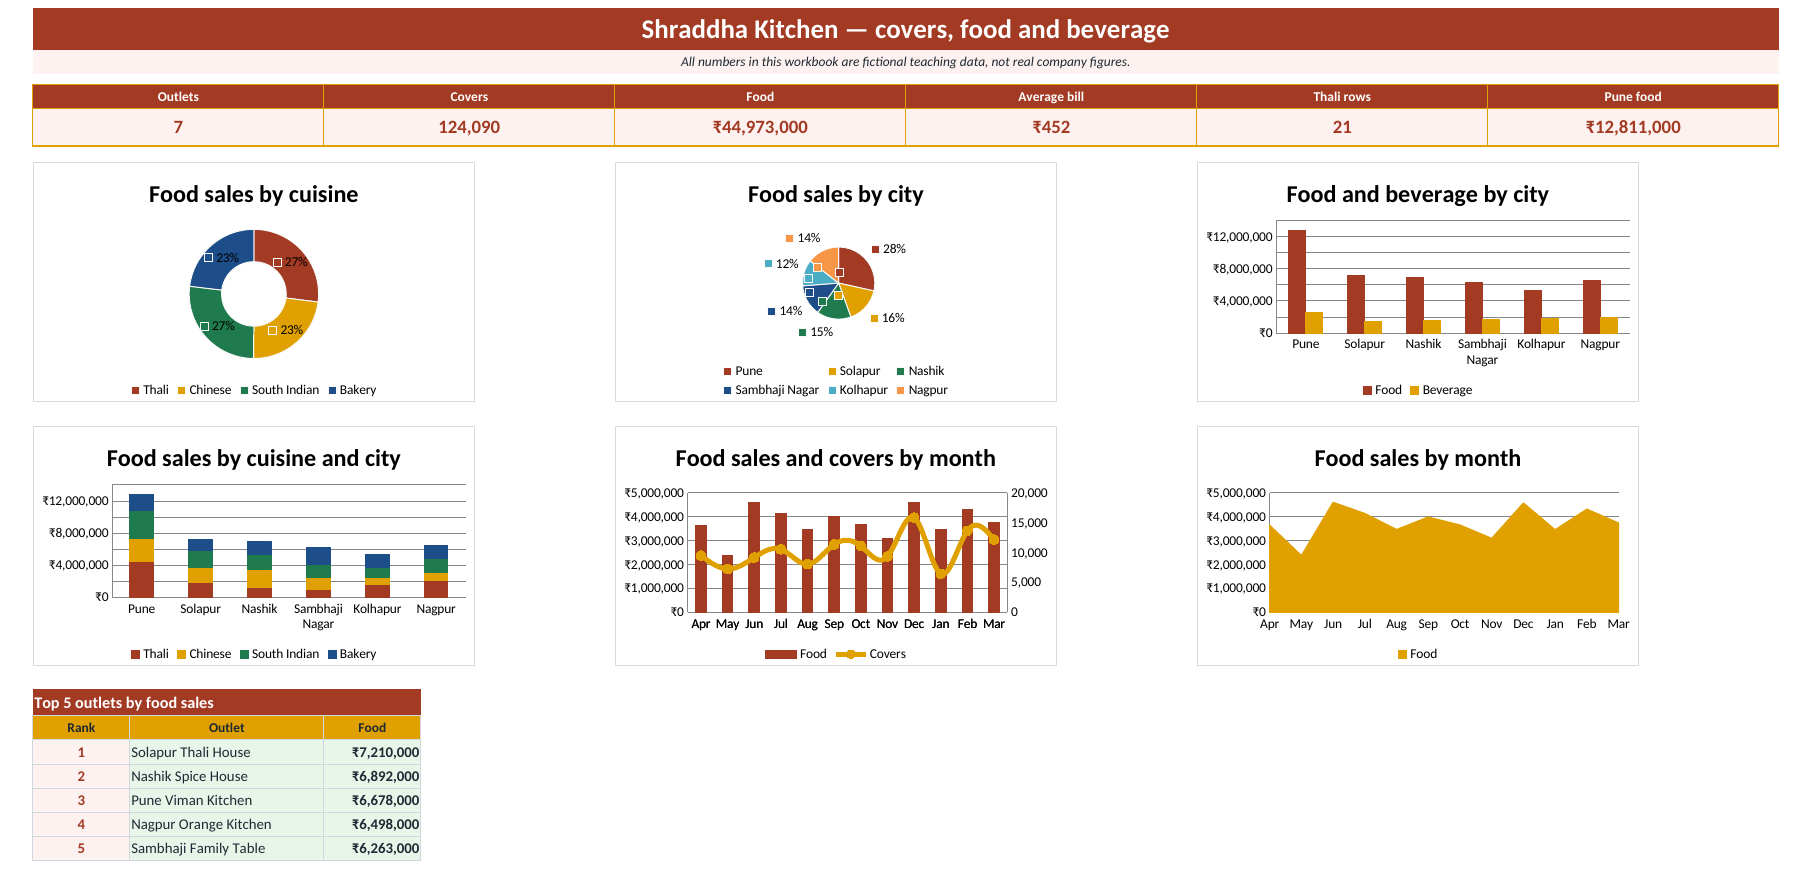
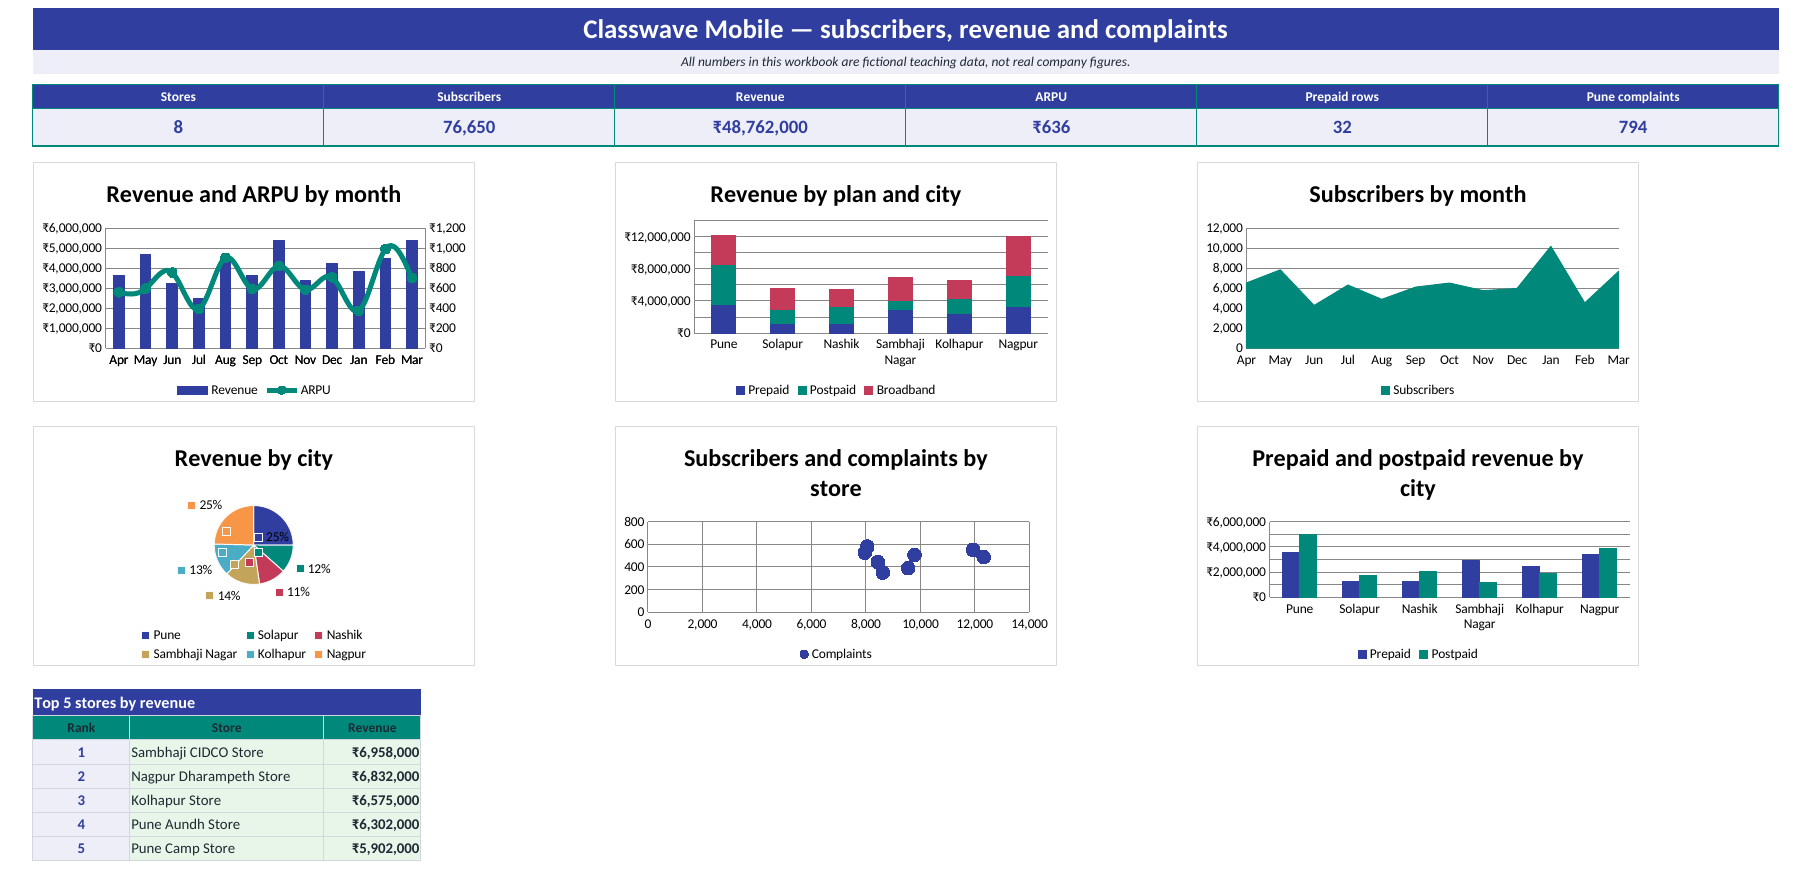
One practice dashboard for each industry. See also the industry dashboards guide.
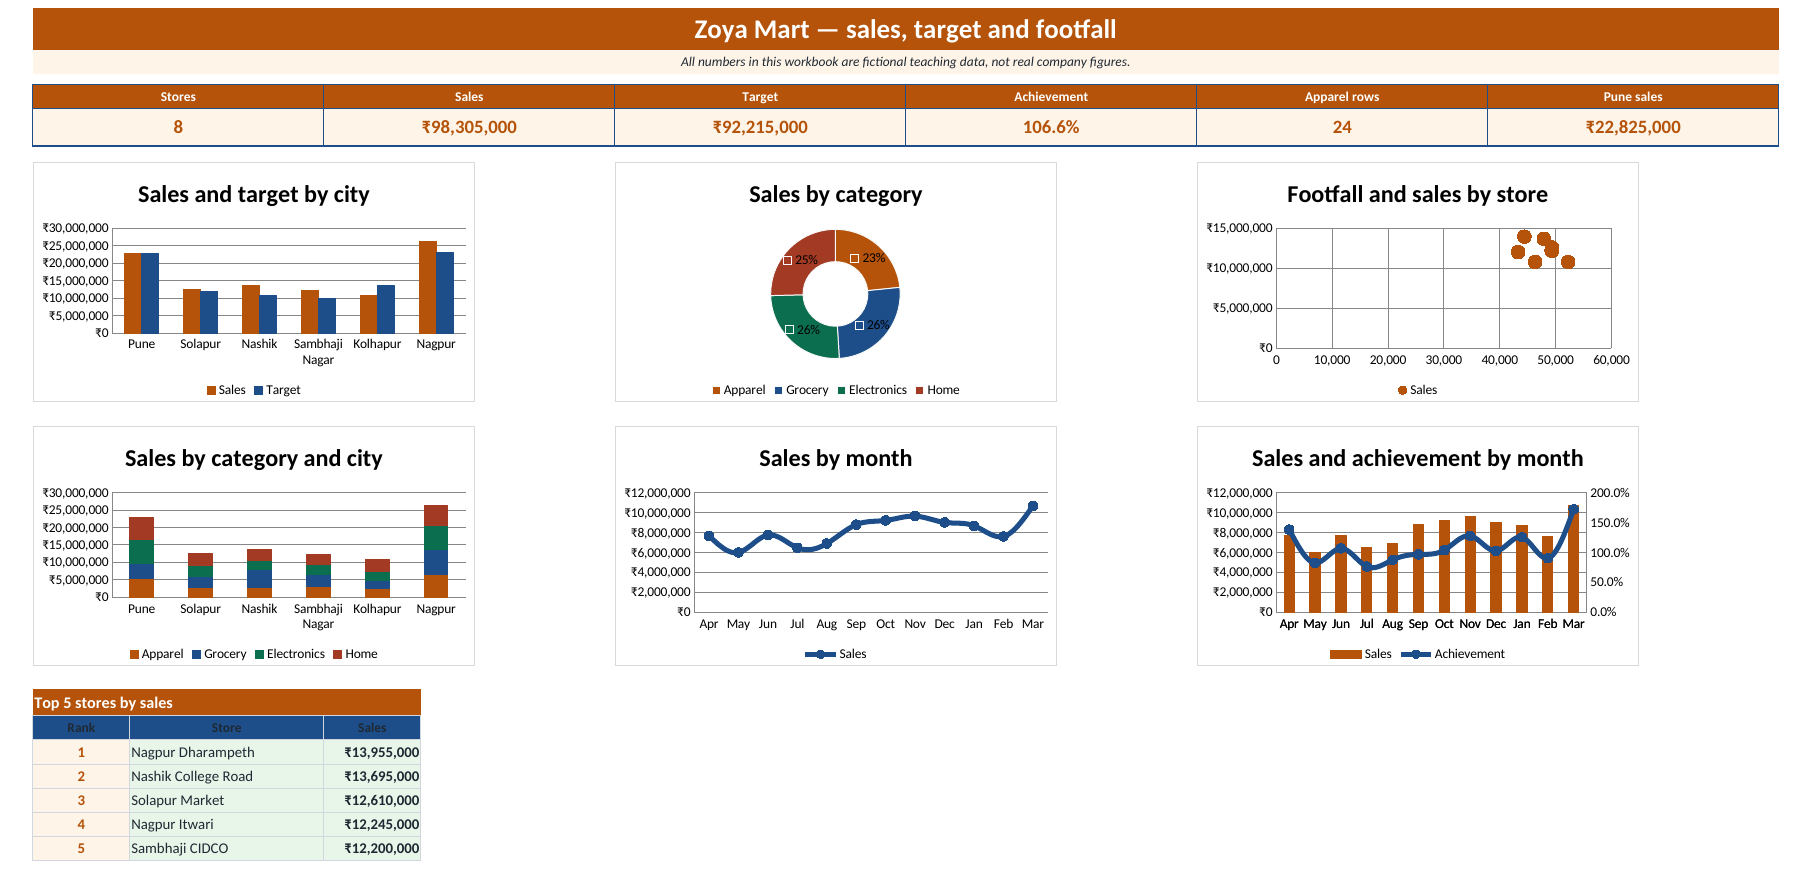
Open the guide · Download .xlsx
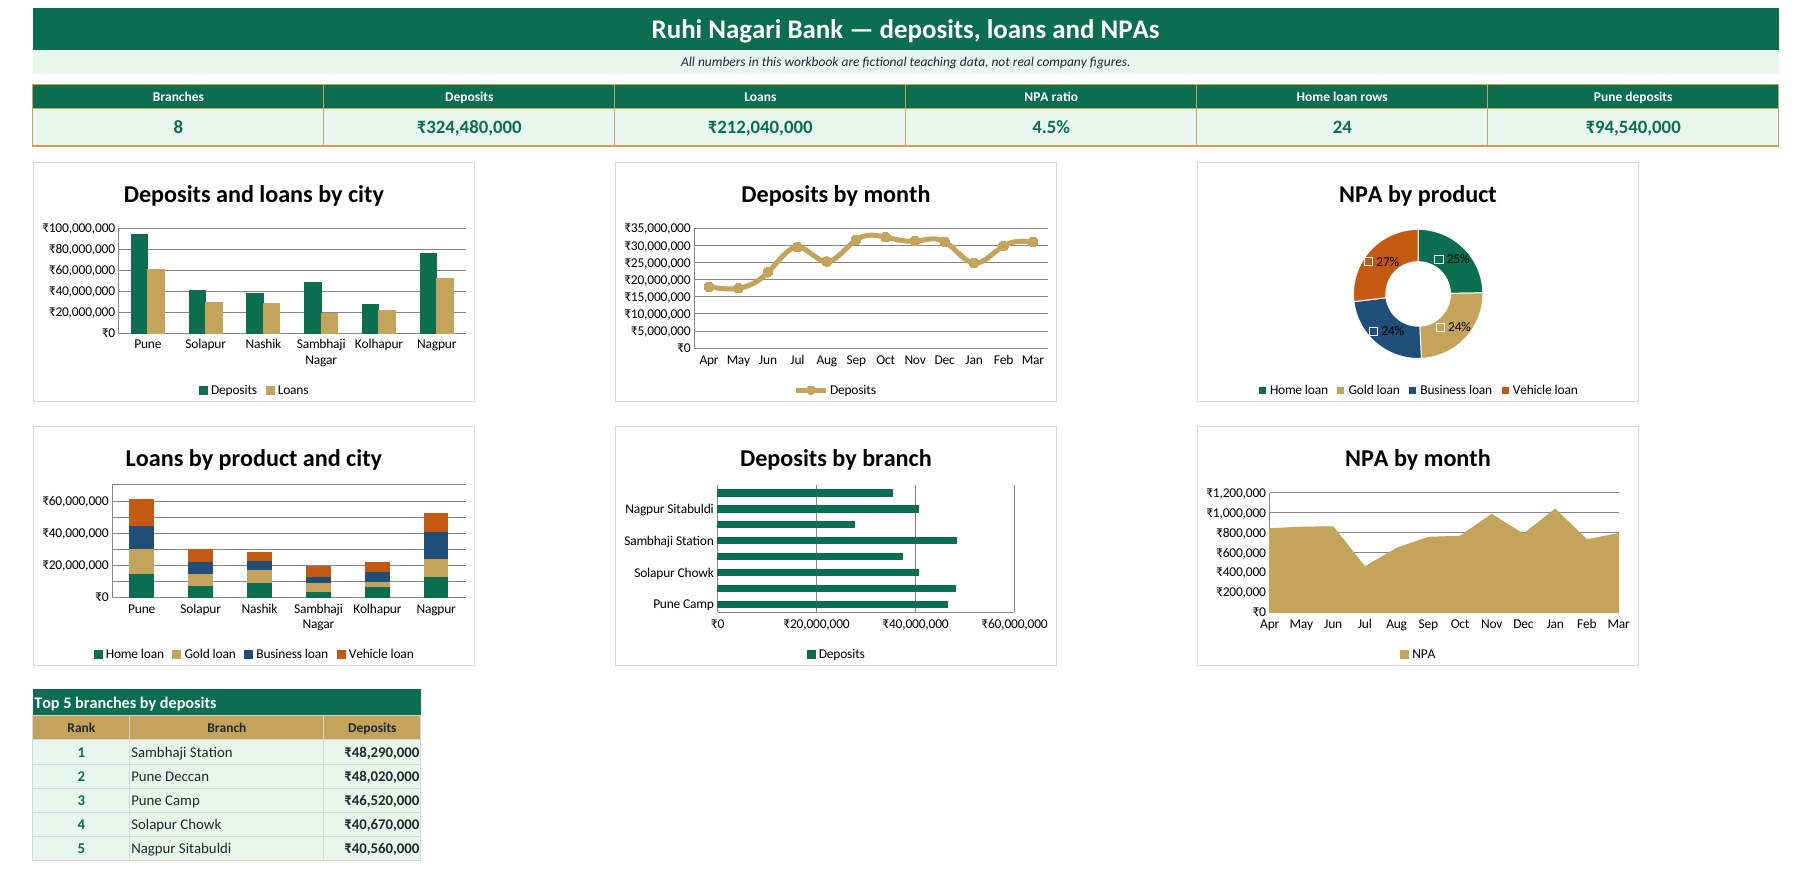
Open the guide · Download .xlsx
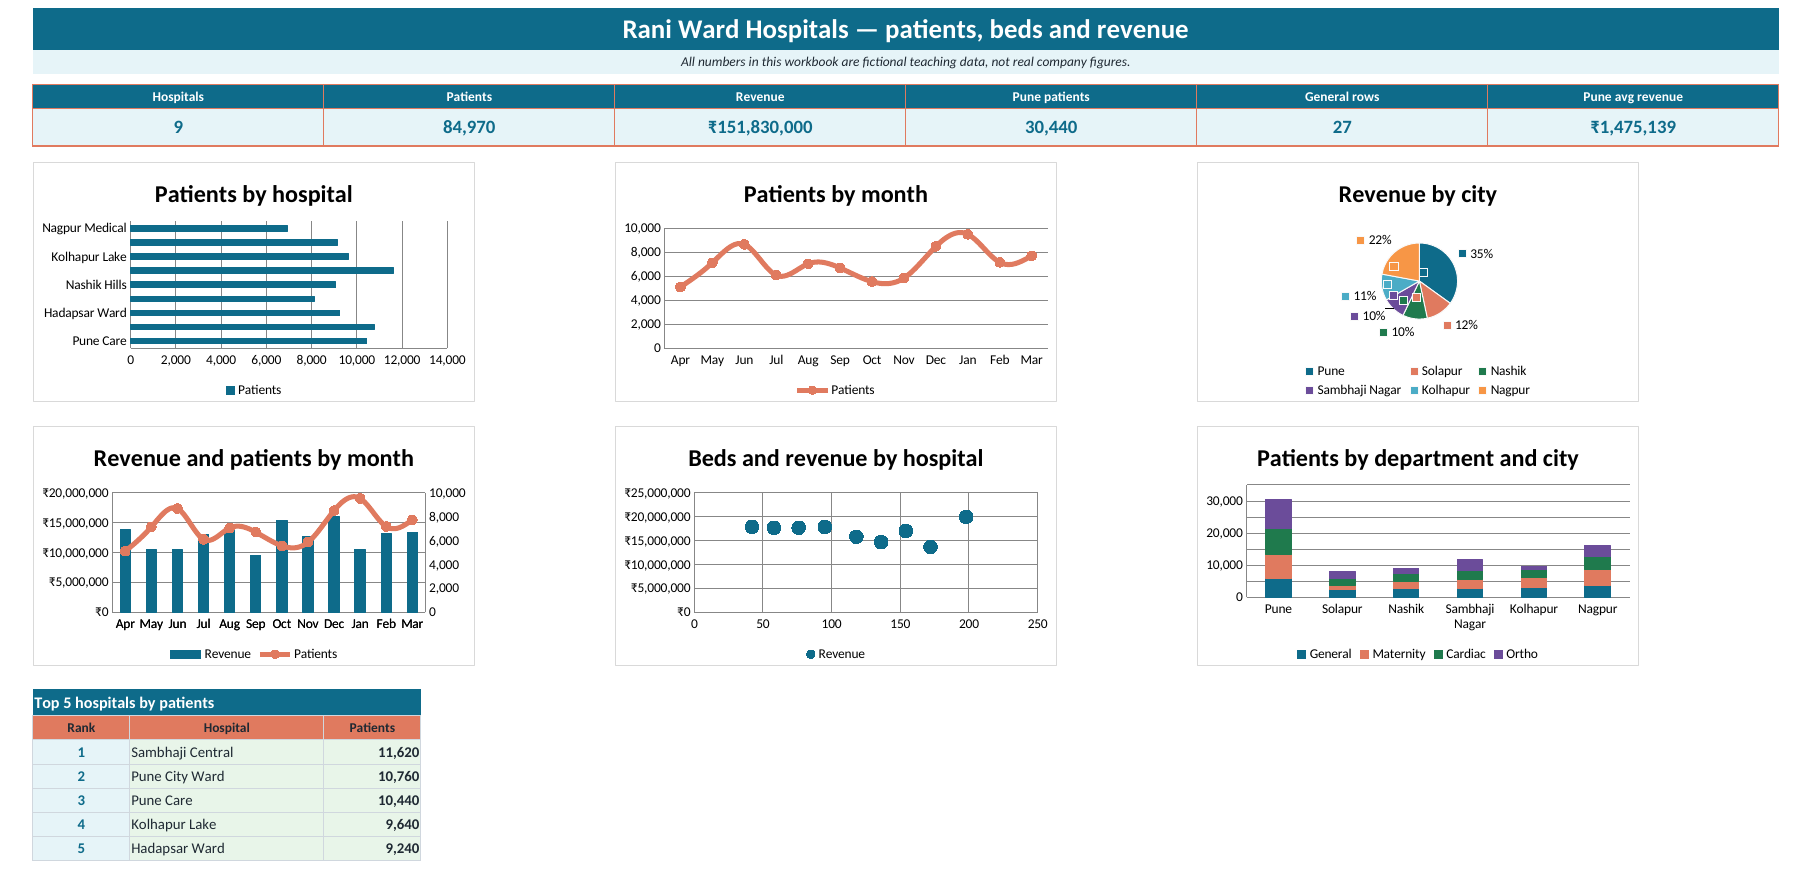
Open the guide · Download .xlsx
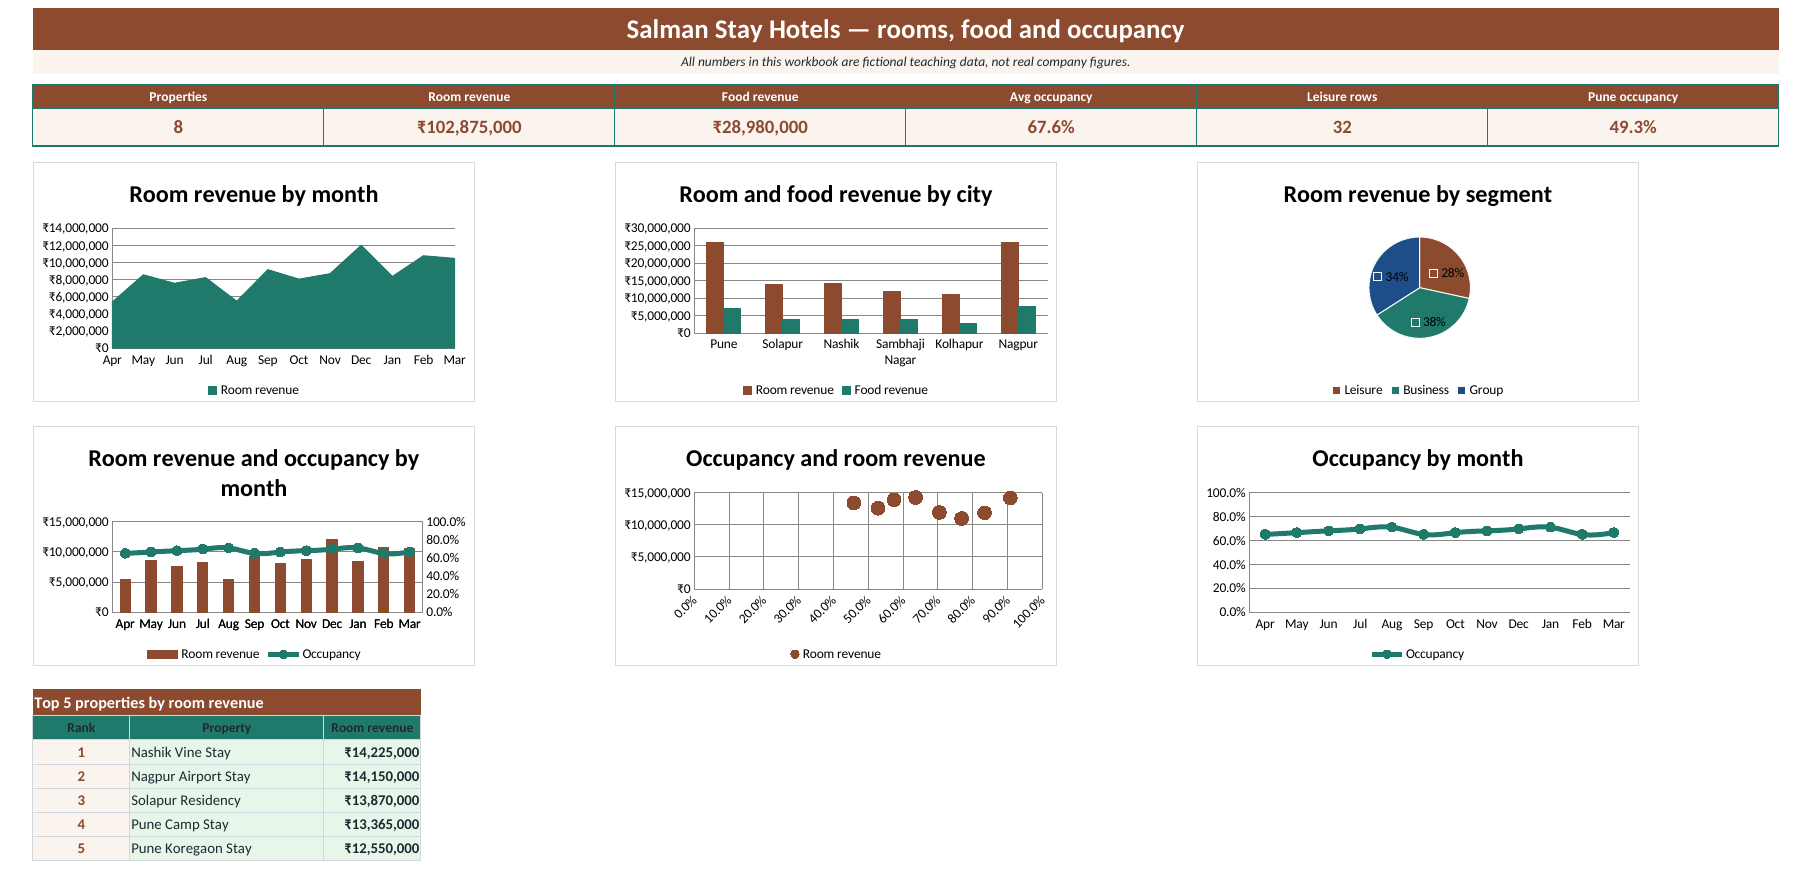
Open the guide · Download .xlsx
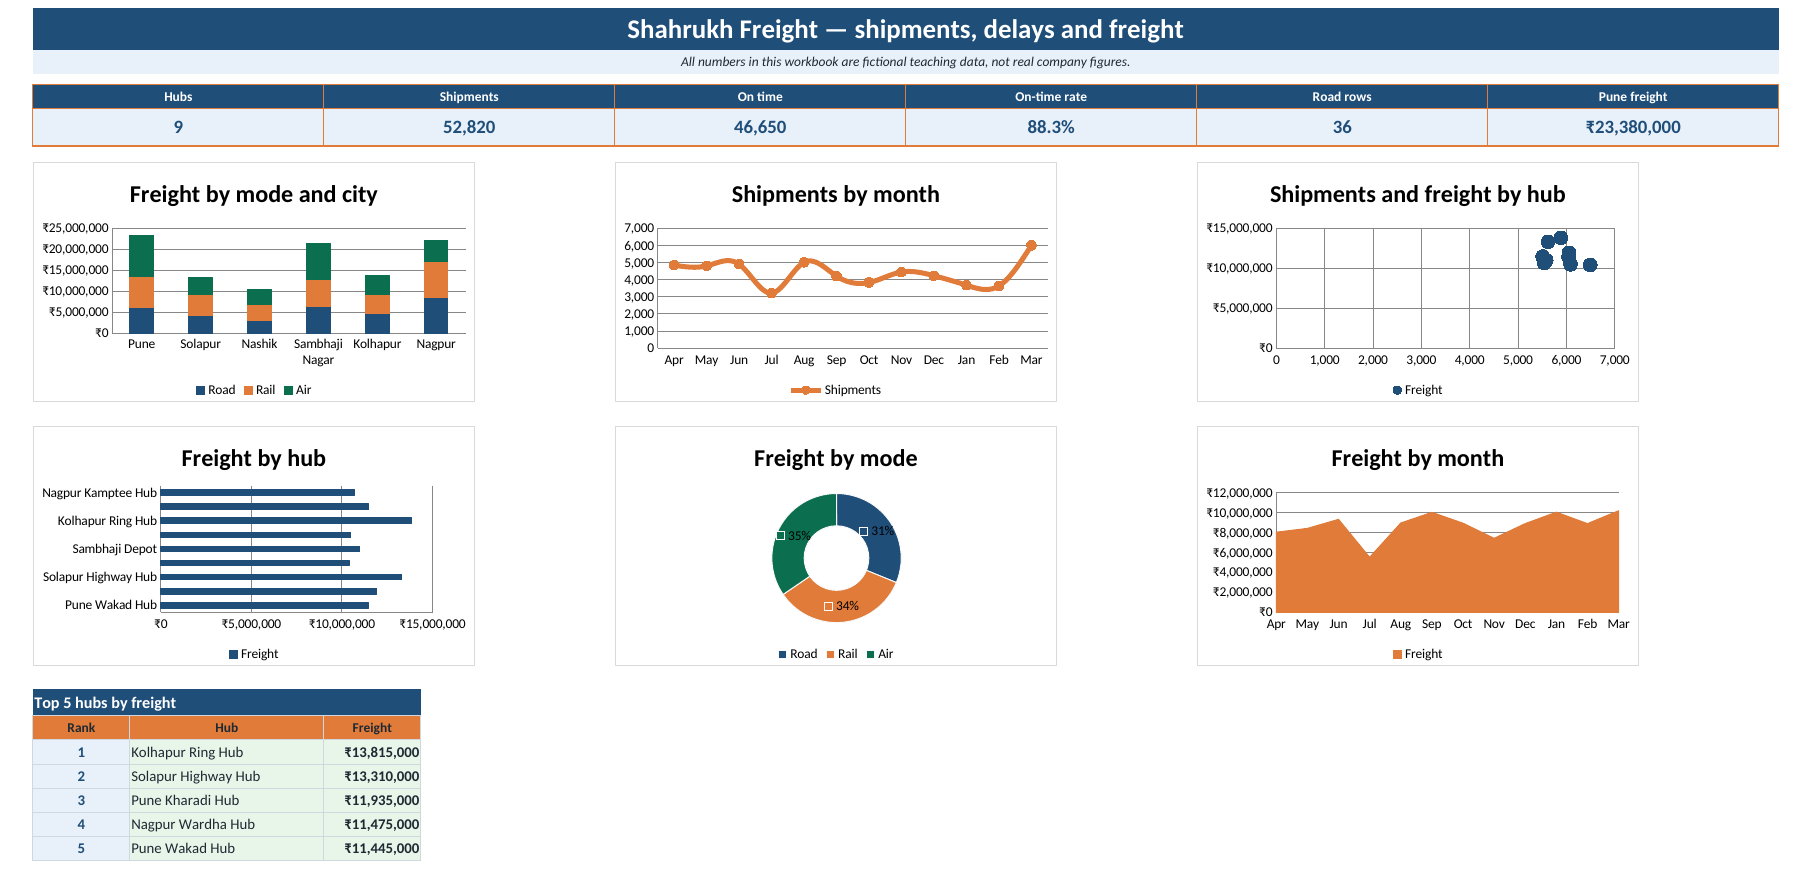
Open the guide · Download .xlsx
Open the guide · Download .xlsx
Open the guide · Download .xlsx
Open the guide · Download .xlsx
Open the guide · Download .xlsx
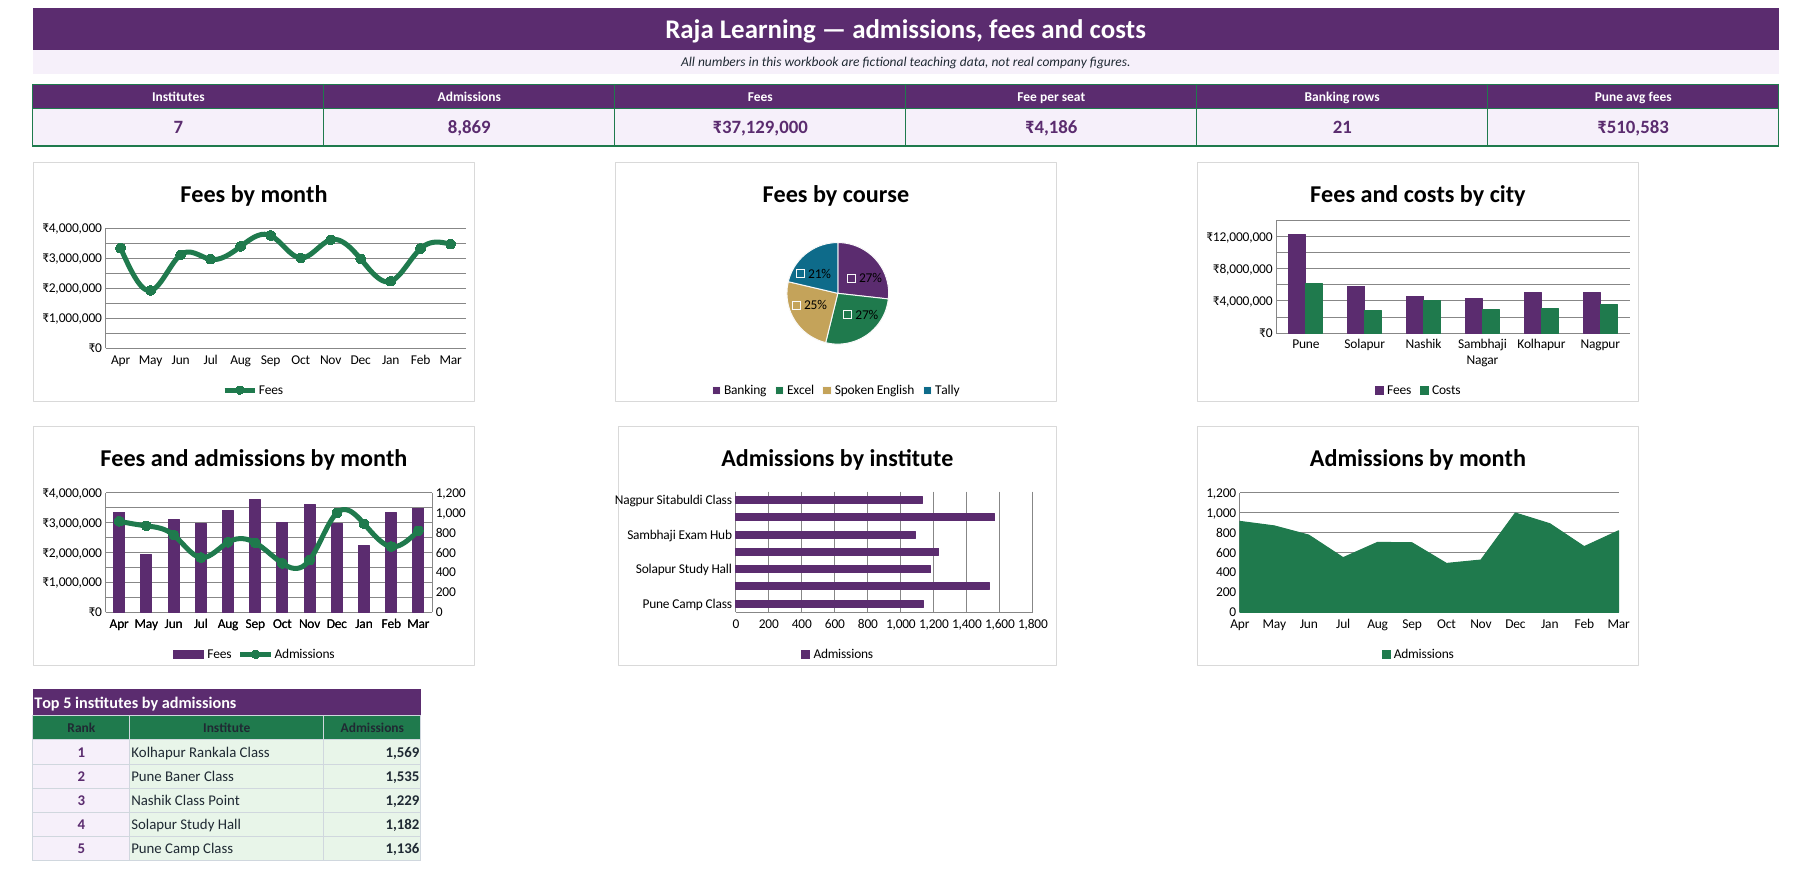
Open the guide · Download .xlsx
Compare 10 big companies on one sheet.
Open the guide · Download .xlsx
50 world-famous companies, one dashboard each, thousands of rows of example data. 10 live now, 40 coming soon.
Open the Top 50 hub · Power BI versions
3. Business systems with a dashboard (26)
Each one is a full Excel system for a small business. Each has a Dashboard sheet.
4. Learn to build dashboards (9)
- 13. Excel Dashboards (full chapter: plan, KPIs, PivotTables, charts, slicers, layout)
- How to create a KPI card: link a shape to a cell
- PivotTable average and a pivot chart for a dashboard
- Final project, stage 4: build the dashboard
- Practice: KPI cards for a city dashboard
- Practice exercises: dashboards
- Interview questions: dashboards
- 27. 20 Industry Projects (report and dashboard practice)
- 22. KPI in All Industries (which KPI to show)
Example data only
All numbers are made up for practice. They are not real company data or official reports. Brand names are used only to describe the type of business.