31. Forecasting in Excel
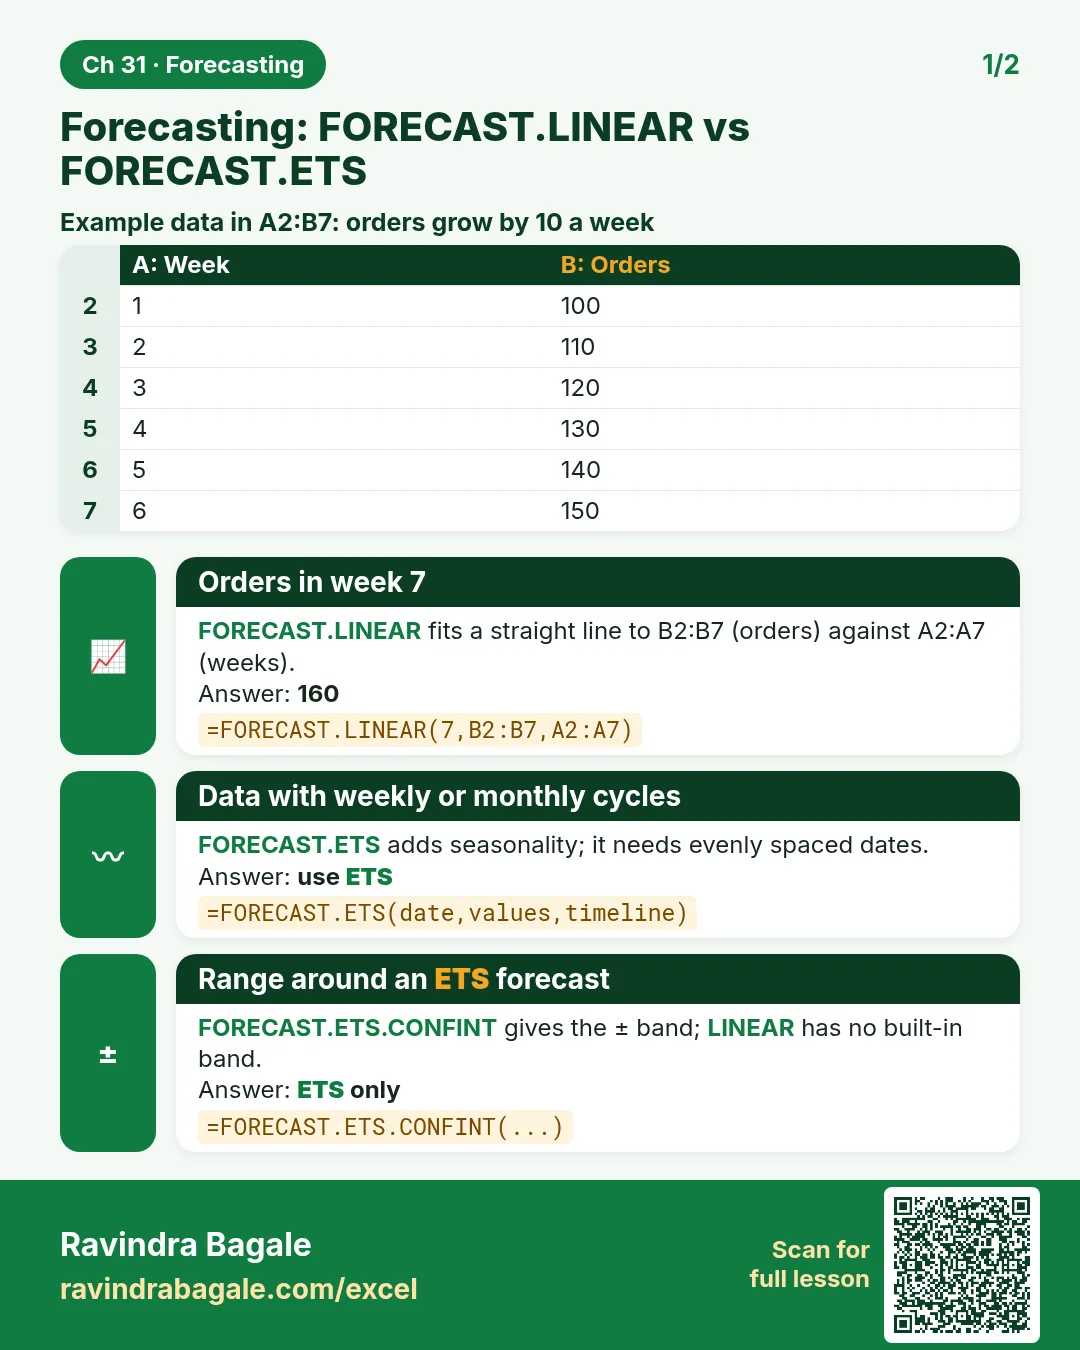
Friends, a forecast is a careful guess about the future made from the past, with an honest range around it. In this module we prepare a clean time series, forecast straight-line growth with FORECAST.LINEAR and TREND, forecast seasonal data with FORECAST.ETS and its confidence interval, use the Forecast Sheet, build a seasonal forecast by hand that anyone can follow, and test every method on held-back data with MAE and MAPE.
मित्रांनो, forecast म्हणजे भूतकाळावरून भविष्याचा काळजीपूर्वक केलेला अंदाज, भोवती प्रामाणिक range सह. या module मध्ये आपण स्वच्छ time series तयार करतो, FORECAST.LINEAR आणि TREND ने सरळ वाढीचा forecast करतो, FORECAST.ETS आणि त्याच्या confidence interval ने seasonal data चा forecast करतो, Forecast Sheet वापरतो, कोणालाही समजेल असा seasonal forecast हाताने बनवतो, आणि प्रत्येक पद्धत held-back data वर MAE आणि MAPE ने तपासतो.
दोस्तों, forecast यानी अतीत से भविष्य का सावधानी से लगाया गया अंदाज़ा, आसपास ईमानदार range के साथ. इस module में हम साफ़ time series तैयार करते हैं, FORECAST.LINEAR और TREND से सीधी बढ़त का forecast करते हैं, FORECAST.ETS और उसके confidence interval से seasonal data का forecast करते हैं, Forecast Sheet इस्तेमाल करते हैं, हर किसी को समझ आने वाला seasonal forecast हाथ से बनाते हैं, और हर तरीक़े को held-back data पर MAE और MAPE से जाँचते हैं.
What you will learn in this module
- Prepare a clean time series and recognise trend and seasonality
- Forecast straight-line growth with FORECAST.LINEAR and TREND
- Forecast seasonal data with FORECAST.ETS, add a range with FORECAST.ETS.CONFINT, and check seasonality and statistics
- Create and audit a Forecast Sheet
- Build a trend plus weekday-offset forecast with TREND, WEEKDAY and AVERAGEIFS
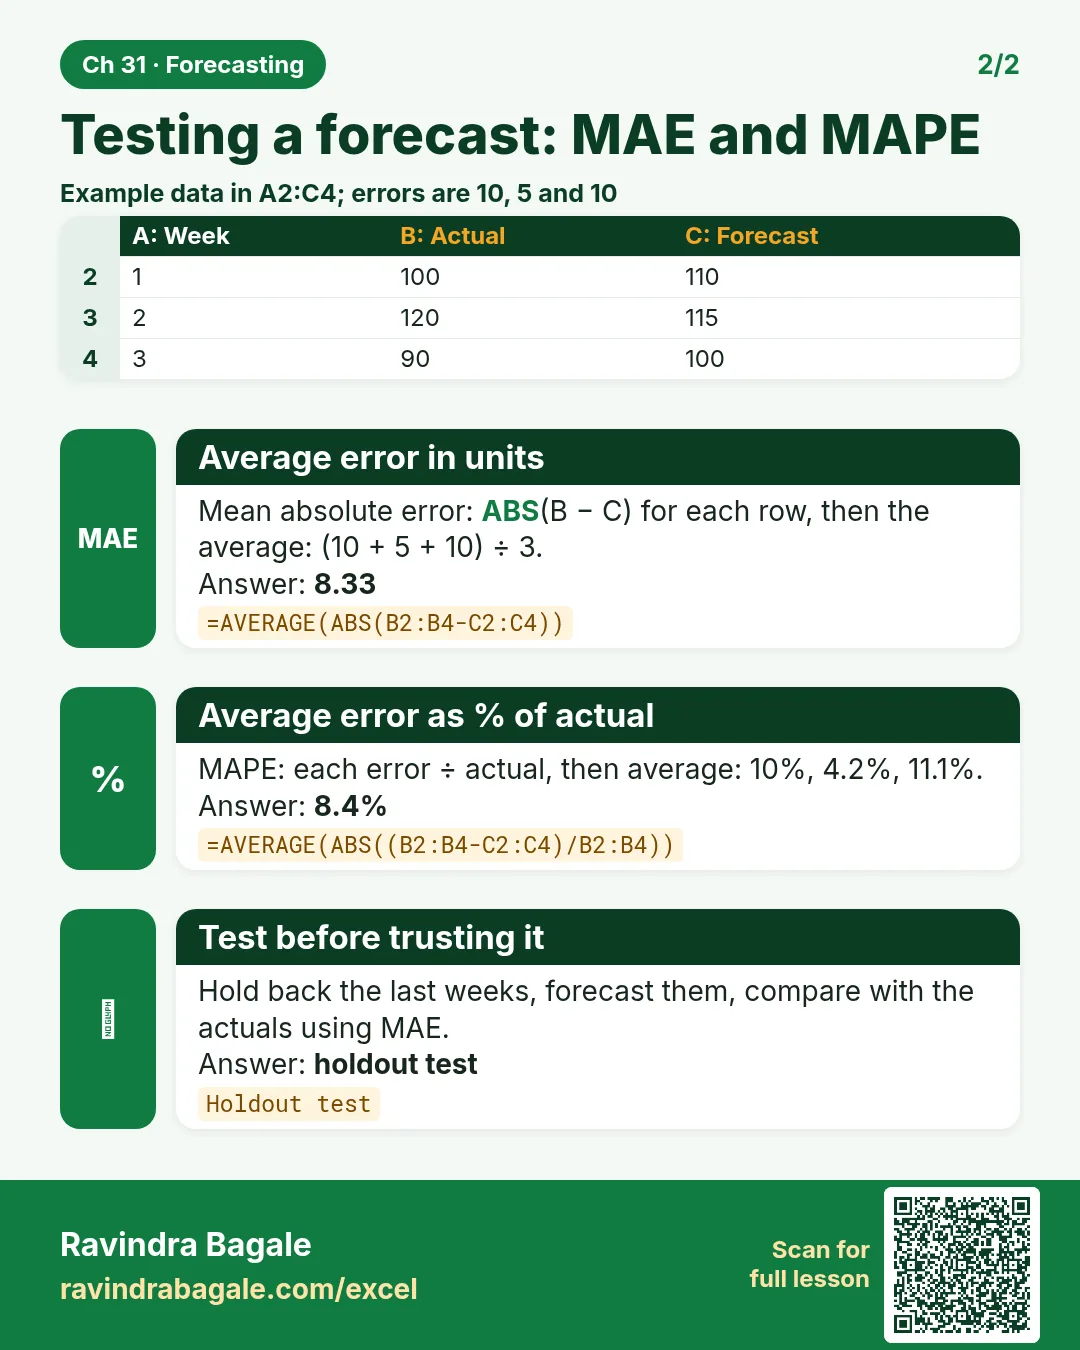
- Compare methods on a holdout week with MAE, MAPE, RMSE and bias
Live story: Saturday riders
Suppose Salman planned riders for his Pune dark store with last month's average: the same number every day. On Saturdays customers waited 25 minutes, on Tuesdays riders sat idle. He built a daily forecast with FORECAST.ETS, added a 95% range, explained the weekly pattern with a seven-row offset table, and tested the method on a held-back week (average miss: about 4 orders a day). Now Saturday gets more riders, Tuesday fewer, and late deliveries dropped.
All numbers in this story are fictional practice data.
Live story: Saturday चे riders
समजा Salman ने आपल्या Pune dark store चे riders मागच्या महिन्याच्या average ने plan केले: रोज तेवढेच. Saturdays ला customers 25 मिनिटे थांबायचे, Tuesdays ला riders बसून राहायचे. त्याने FORECAST.ETS ने daily forecast बनवला, 95% range जोडली, सात rows च्या offset table ने weekly pattern समजावला, आणि held-back आठवड्यावर पद्धत तपासली (सरासरी चूक: दिवसाला साधारण 4 orders). आता Saturday ला जास्त riders, Tuesday ला कमी, आणि उशिरा deliveries कमी झाल्या.
या story मधले सगळे आकडे काल्पनिक practice data आहेत.
Live story: Saturday के riders
मान लीजिए Salman ने अपने Pune dark store के riders पिछले महीने के average से plan किए: रोज़ उतने ही. Saturdays को customers 25 मिनट रुकते थे, Tuesdays को riders ख़ाली बैठे रहते थे. उसने FORECAST.ETS से daily forecast बनाया, 95% range जोड़ी, सात rows की offset table से weekly pattern समझाया, और held-back हफ़्ते पर तरीक़ा जाँचा (औसत चूक: रोज़ लगभग 4 orders). अब Saturday को ज़्यादा riders, Tuesday को कम, और देर वाली deliveries घट गईं.
इस story के सारे आँकड़े काल्पनिक practice data हैं.
Fictional practice data
Every name, number and company detail in this module is made up for class. It is not the data of Blinkit, Amazon or any real firm.
Concepts in this chapter
- 31.1Forecasting Basics: Trend, Seasonality and a Clean Time Series
- 31.2FORECAST.LINEAR and TREND: Straight-Line Forecasts
- 31.3FORECAST.ETS: Seasonal Forecasts with Exponential Smoothing
- 31.4FORECAST.ETS.CONFINT, FORECAST.ETS.SEASONALITY and FORECAST.ETS.STAT
- 31.5Forecast Sheet: Data › Forecast › Forecast Sheet
- 31.6Seasonality by Hand: Trend plus Weekday Offsets with TREND and AVERAGEIFS
- 31.7Forecast Accuracy: MAE, MAPE, RMSE and a Holdout Test
Review and practice
The chapter recap is at the end of the last concept page.
Quick revision cards
Quick revision
Revise this chapter in two minutes. Save the cards on your phone or download them as PNG files. All names and numbers are made up for practice.
झटपट उजळणी
हा chapter दोन मिनिटांत revise करा. Cards phone वर save करा किंवा PNG म्हणून download करा. सगळी नावं आणि आकडे सरावासाठी काल्पनिक आहेत.
झटपट दोहराई
यह chapter दो मिनट में revise करें. Cards phone पर save करें या PNG के रूप में download करें. सभी नाम और आंकड़े अभ्यास के लिए काल्पनिक हैं.


More cards for every chapter: Ravi Sir's Cards.