30. Statistics for Analysts
Friends, statistics is how an analyst says "this is real" or "this could be luck" with confidence. In this module we describe data with functions and the Analysis ToolPak, look at distributions and outliers, measure correlation, fit regressions with LINEST and read the ToolPak regression report line by line, run an A/B test with T.TEST, compare conversion rates with CHISQ.TEST, and finish with the mistakes that most often reach managers.
मित्रांनो, statistics म्हणजे analyst ने आत्मविश्वासाने "हे खरं आहे" किंवा "हे नशीब असू शकतं" सांगण्याची पद्धत. या module मध्ये आपण functions आणि Analysis ToolPak ने data describe करतो, distributions आणि outliers बघतो, correlation मोजतो, LINEST ने regression बसवतो आणि ToolPak regression report line by line वाचतो, T.TEST ने A/B test करतो, CHISQ.TEST ने conversion rates तुलना करतो, आणि शेवटी managers पर्यंत सर्वात जास्त पोहोचणाऱ्या चुका बघतो.
दोस्तों, statistics वह तरीक़ा है जिससे analyst भरोसे से कहता है "यह असली है" या "यह किस्मत हो सकती है". इस module में हम functions और Analysis ToolPak से data describe करते हैं, distributions और outliers देखते हैं, correlation मापते हैं, LINEST से regression बैठाते हैं और ToolPak regression report line by line पढ़ते हैं, T.TEST से A/B test करते हैं, CHISQ.TEST से conversion rates की तुलना करते हैं, और आख़िर में managers तक सबसे ज़्यादा पहुँचने वाली ग़लतियाँ देखते हैं.
What you will learn in this module
- Describe a column with AVERAGE, MEDIAN, STDEV.S, quartiles, SKEW and KURT, and with the ToolPak Descriptive Statistics tool
- Draw histograms, compare data with a normal curve and flag outliers
- Build a correlation matrix and avoid the correlation-causation trap
- Fit regressions with SLOPE, INTERCEPT and LINEST and read the ToolPak Regression output line by line
- Run and report an A/B test with T.TEST, and compare counts with CHISQ.TEST
- Spot the 13 most common statistics mistakes and recompute key numbers in a second tool
Live story: The rain that fooled the report
Suppose Raja's monthly report said slow deliveries were reducing orders in Nashik, and the operations team was about to hire extra riders. Before the meeting Amir built a correlation matrix and a regression with rain in it. Rain explained both the slow days and the low-order days; with rain in the model, delivery minutes added nothing. The team kept its budget, bought rain gear for the riders instead, and Raja now runs the statistics checklist before every report.
All numbers in this story are fictional practice data.
Live story: Report ला फसवणारा पाऊस
समजा Raja च्या monthly report मध्ये लिहिलं होतं की Nashik मध्ये slow deliveries मुळे orders कमी होत आहेत, आणि operations team जास्त riders घेणार होती. Meeting आधी Amir ने correlation matrix आणि rain सह regression बनवलं. Slow दिवस आणि कमी orders चे दिवस दोन्ही पावसामुळे होते; model मध्ये rain आल्यावर delivery minutes ने काहीच भर घातली नाही. Team ने budget वाचवलं, त्याऐवजी riders साठी rain gear घेतलं, आणि Raja आता प्रत्येक report आधी statistics checklist चालवतो.
या story मधले सगळे आकडे काल्पनिक practice data आहेत.
Live story: Report को धोखा देने वाली बारिश
मान लीजिए Raja की monthly report में लिखा था कि Nashik में slow deliveries की वजह से orders कम हो रहे हैं, और operations team ज़्यादा riders रखने वाली थी. Meeting से पहले Amir ने correlation matrix और rain वाला regression बनाया. Slow दिन और कम orders वाले दिन दोनों बारिश की वजह से थे; model में rain आने पर delivery minutes ने कुछ नहीं जोड़ा. Team ने budget बचाया, उसकी जगह riders के लिए rain gear लिया, और Raja अब हर report से पहले statistics checklist चलाता है.
इस story के सारे आँकड़े काल्पनिक practice data हैं.
Fictional practice data
Every name, number and company detail in this module is made up for class. It is not the data of Blinkit, Amazon or any real firm.
Concepts in this chapter
- 30.1Descriptive Statistics with Functions: Centre, Spread and Shape
- 30.2The Analysis ToolPak: Load It and Read the Descriptive Statistics Output Line by Line
- 30.3Distributions and Histograms: FREQUENCY, the Histogram Chart, NORM.DIST and Outliers
- 30.4CORREL and a Correlation Matrix: Which Numbers Move Together
- 30.5Simple Regression with SLOPE, INTERCEPT and LINEST: Predict Orders from Ad Spend
- 30.6The ToolPak Regression Output Read Line by Line
- 30.7T.TEST and an A/B Test Walkthrough: Did the New Checkout Page Raise Basket Value?
- 30.8CHISQ.TEST in Brief: Comparing Conversion Rates and Counts
- 30.9Common Statistics Mistakes Analysts Make (and the Fix for Each)
Review and practice
The chapter recap is at the end of the last concept page.
Quick revision cards
Quick revision
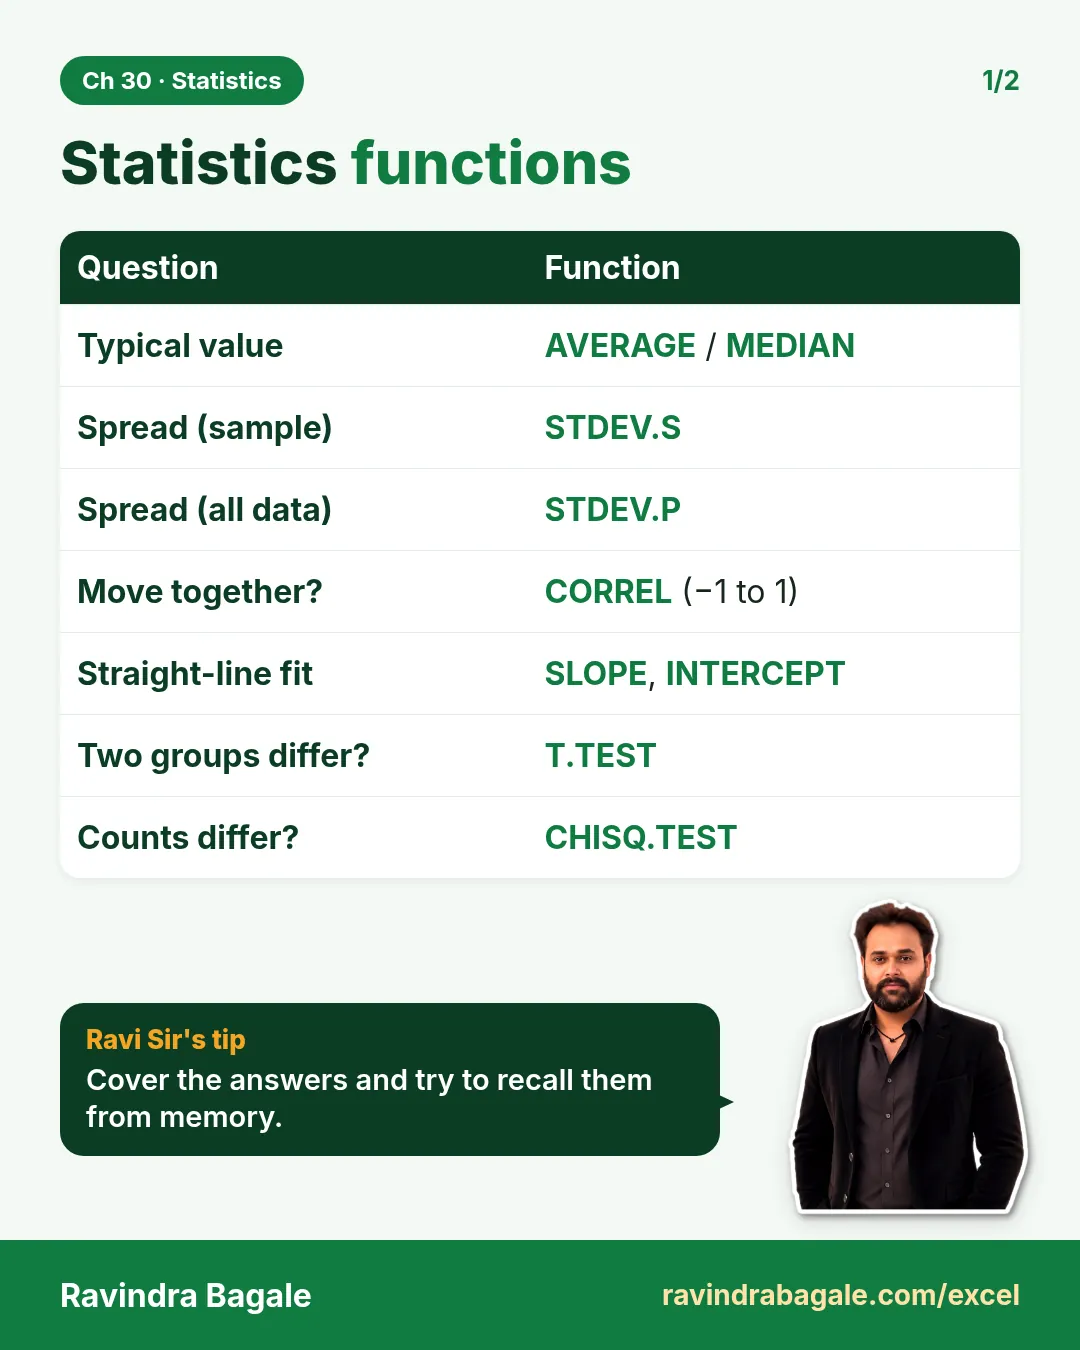
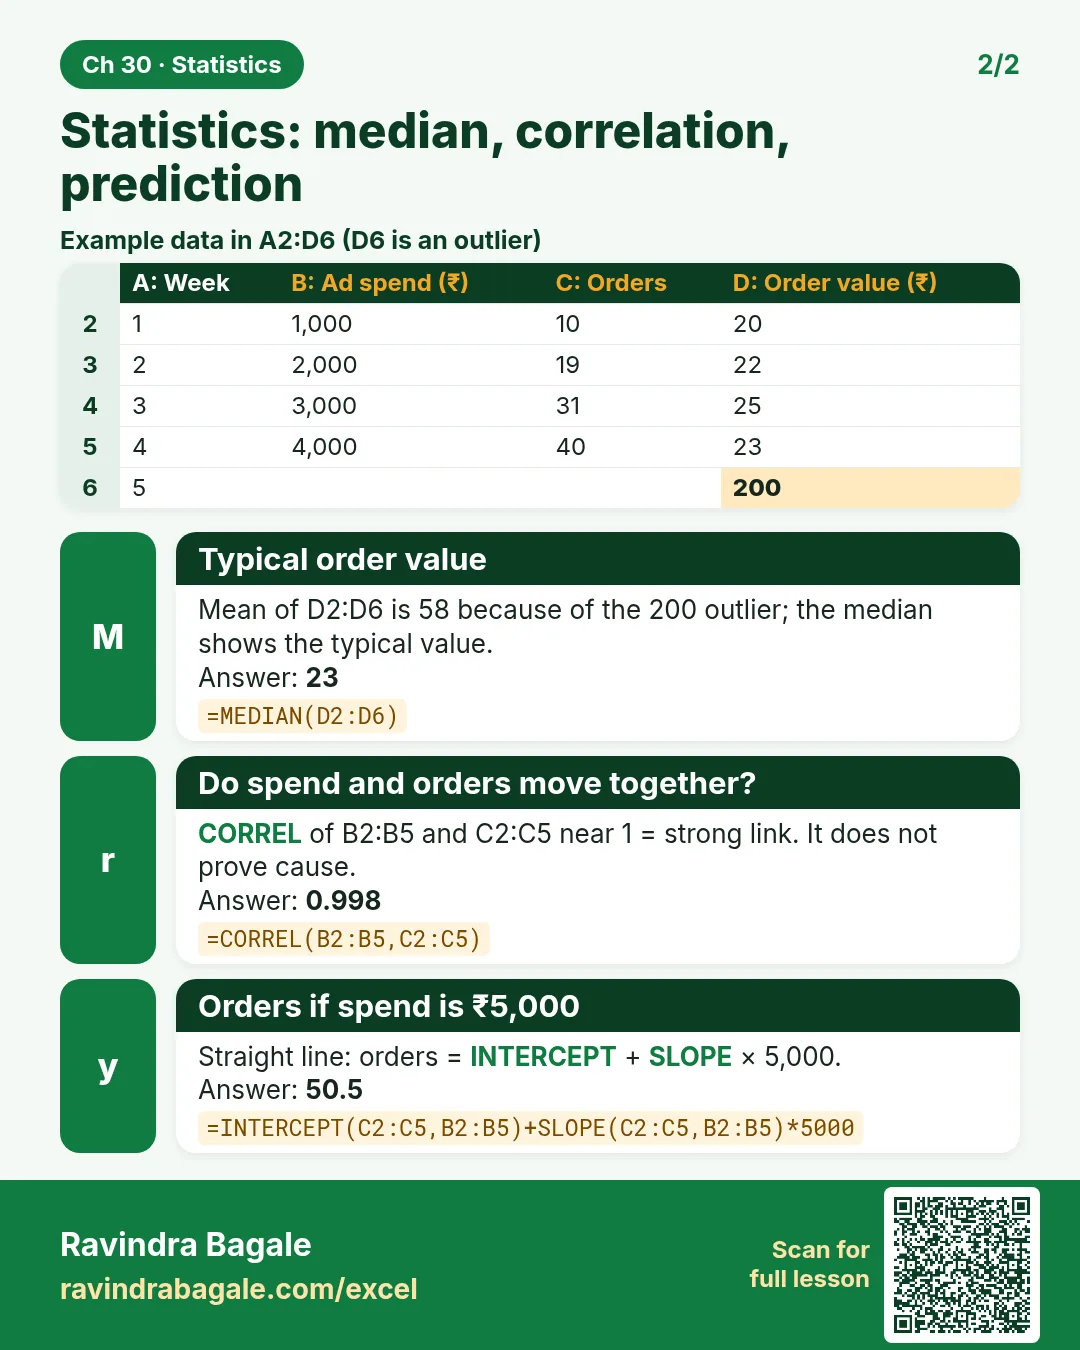
Revise this chapter in two minutes. Save the cards on your phone or download them as PNG files. All names and numbers are made up for practice.
झटपट उजळणी
हा chapter दोन मिनिटांत revise करा. Cards phone वर save करा किंवा PNG म्हणून download करा. सगळी नावं आणि आकडे सरावासाठी काल्पनिक आहेत.
झटपट दोहराई
यह chapter दो मिनट में revise करें. Cards phone पर save करें या PNG के रूप में download करें. सभी नाम और आंकड़े अभ्यास के लिए काल्पनिक हैं.

More cards for every chapter: Ravi Sir's Cards.