8. Charts
Come friends, today we make numbers speak – with charts. Which chart for which question, how to format it, and how to build dynamic charts that change with a drop-down or a checkbox – all today. Remember: a chart is not there to look pretty; it is there to make the message clear.
चला मित्रांनो, आज आपण आकडे "बोलके" करूया – charts. कोणत्या प्रश्नासाठी कोणता chart, तो कसा format करायचा, आणि dynamic charts (drop-down, checkbox ने बदलणारे) कसे बनवायचे – हे सगळं आज. लक्षात ठेवा: chart सुंदर दिसण्यासाठी नाही, message स्पष्ट करण्यासाठी असतो.
चलो दोस्तों, आज हम आँकड़ों को "बोलना" सिखाते हैं – charts. किस सवाल के लिए कौन-सा chart, उसे कैसे format करें, और dynamic charts (drop-down, checkbox से बदलने वाले) कैसे बनाएँ – यह सब आज. याद रखिए: chart सुंदर दिखने के लिए नहीं, message साफ़ करने के लिए होता है.
What you will learn in this module
- Creating charts and using Chart Elements, Styles, Filters and the Format pane
- Column, bar, line, area, pie/doughnut, combo with secondary axis, scatter
- Histogram, box & whisker, waterfall, funnel, treemap, sunburst, map chart and sparklines
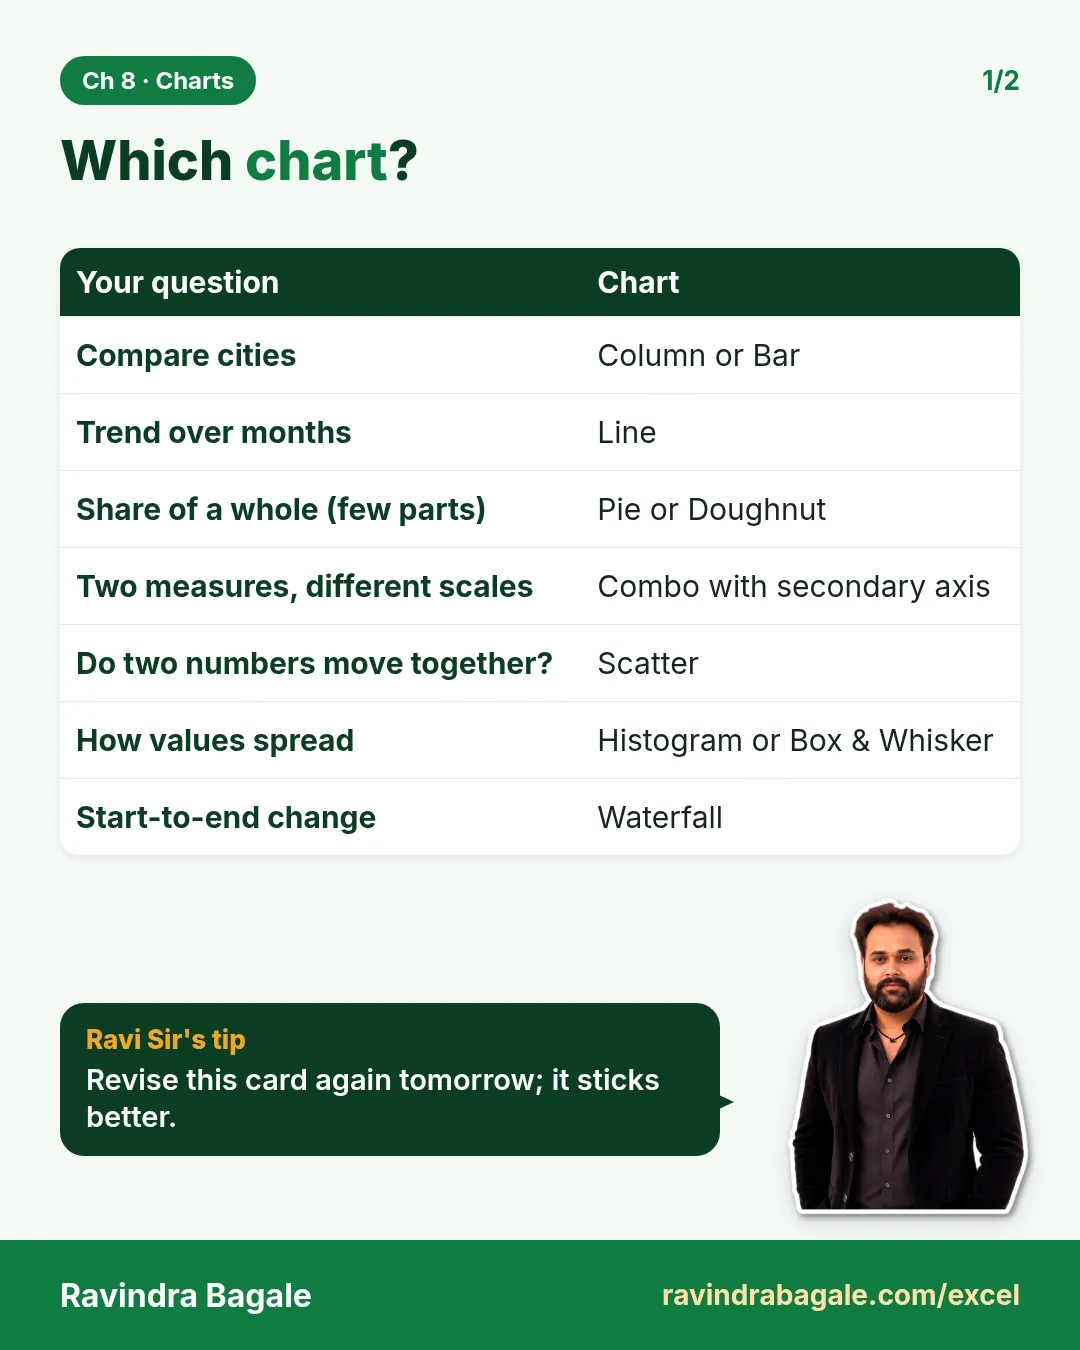
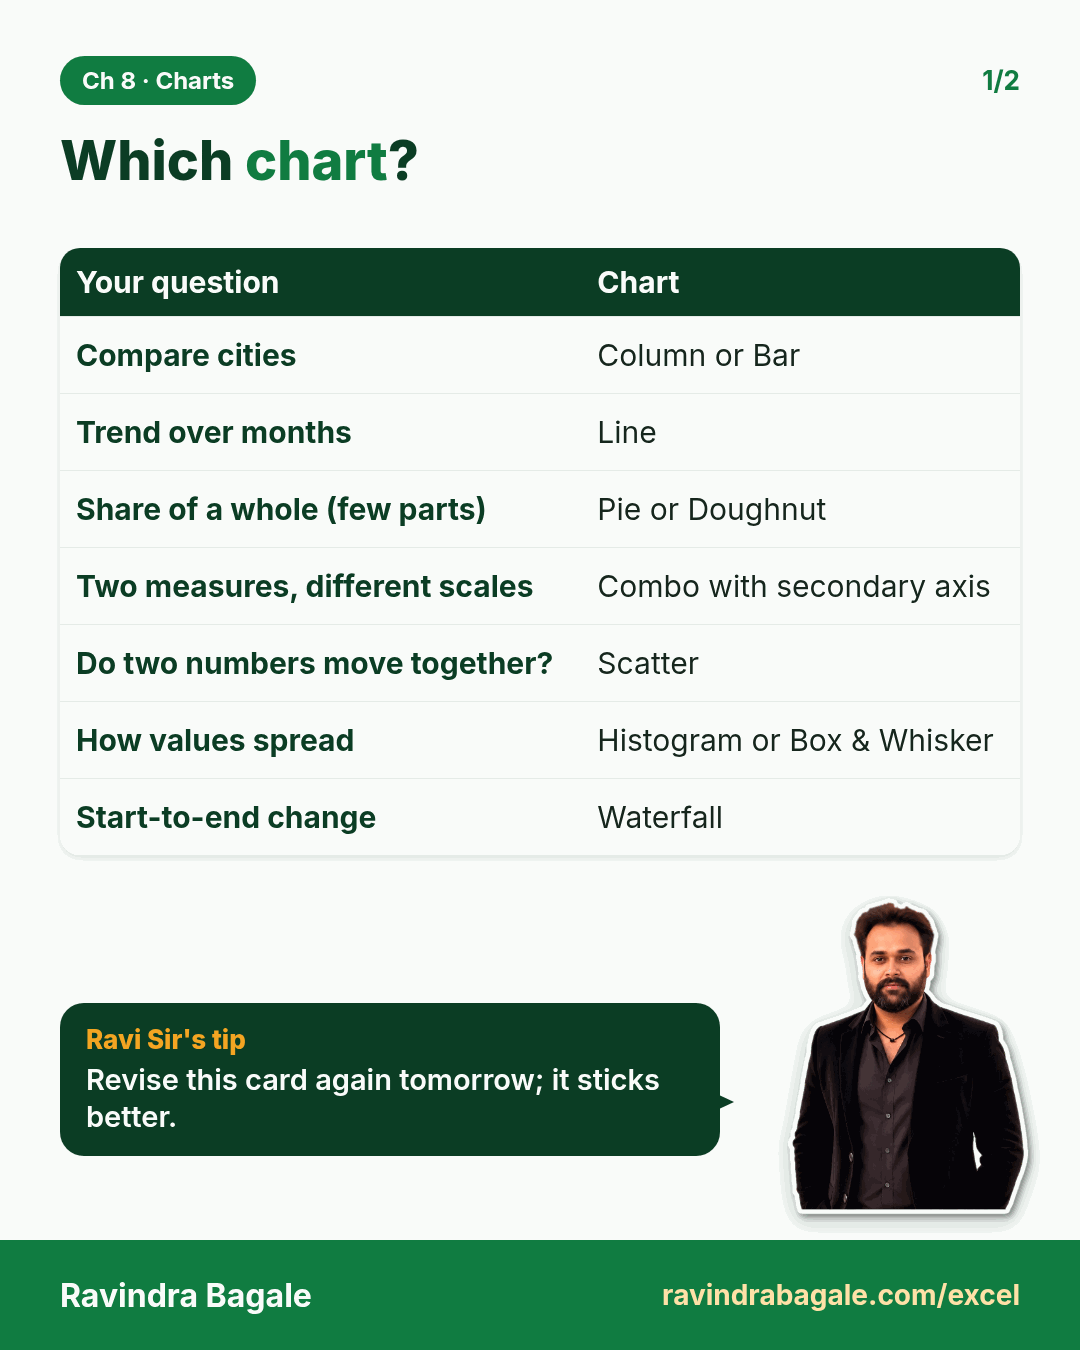
- A choose-the-right-chart table
- Dynamic charts: Table-based, drop-down + INDEX/XLOOKUP driven, OFFSET named ranges, checkbox show/hide
Live story: One slide, one message
Suppose Shraddha Bagale has one slide for Maharashtra in the national review. The message is: "Solapur grew fastest, but Pune is still the biggest." A pie chart with six thin slices hides that message, and a 3-D column chart makes it worse. This chapter picks the right chart for each question, formats it cleanly and makes it change with a drop-down.
All numbers in this story are fictional practice data.
Live story: एक slide, एक message
समजा national review मध्ये Shraddha Bagale ना Maharashtra साठी एकच slide मिळालीय. Message असा आहे: "Solapur सगळ्यात वेगाने वाढलं, पण Pune अजूनही सगळ्यात मोठं आहे." सहा बारीक तुकड्यांचा pie chart हा message लपवतो, आणि 3-D column chart तर अजून बिघडवतो. हा chapter प्रत्येक प्रश्नासाठी योग्य chart निवडतो, तो स्वच्छ format करतो आणि drop-down ने बदलणारा बनवतो.
या story मधले सगळे आकडे काल्पनिक practice data आहेत.
Live story: एक slide, एक message
मान लीजिए national review में Shraddha Bagale को Maharashtra के लिए एक ही slide मिली है. Message है: "Solapur सबसे तेज़ी से बढ़ा, पर Pune अब भी सबसे बड़ा है." छह पतले टुकड़ों वाला pie chart यह message छुपा देता है, और 3-D column chart तो और बिगाड़ देता है. यह chapter हर सवाल के लिए सही chart चुनता है, उसे साफ़ format करता है और drop-down से बदलने वाला बनाता है.
इस story के सारे आँकड़े काल्पनिक practice data हैं.
Chart data used in this module (fictional monthly sales, ₹ lakh, sheet ChartData):
| Month | Pune | Nashik | Nagpur | Orders (Pune) |
|---|---|---|---|---|
| Jul | 3.9 | 1.4 | 1.6 | 12,150 |
| Aug | 4.1 | 1.5 | 1.7 | 12,900 |
| Sep | 5.9 | 2.0 | 2.1 | 17,600 |
| Oct | 5.0 | 1.6 | 1.8 | 15,200 |
| Nov | 6.1 | 2.2 | 2.5 | 18,400 |
| Dec | 4.6 | 1.7 | 1.9 | 14,100 |
September (Ganeshotsav) and November (Diwali) are the festival peaks.
Concepts in this chapter
- 8.1Creating and Formatting a Chart
- 8.2Column and Bar Charts
- 8.3Line and Area Charts
- 8.4Pie and Doughnut Charts
- 8.5Combo Chart with a Secondary Axis
- 8.6Scatter Chart
- 8.7Histogram and Box & Whisker
- 8.8Waterfall and Funnel
- 8.9Treemap and Sunburst
- 8.10Map Chart
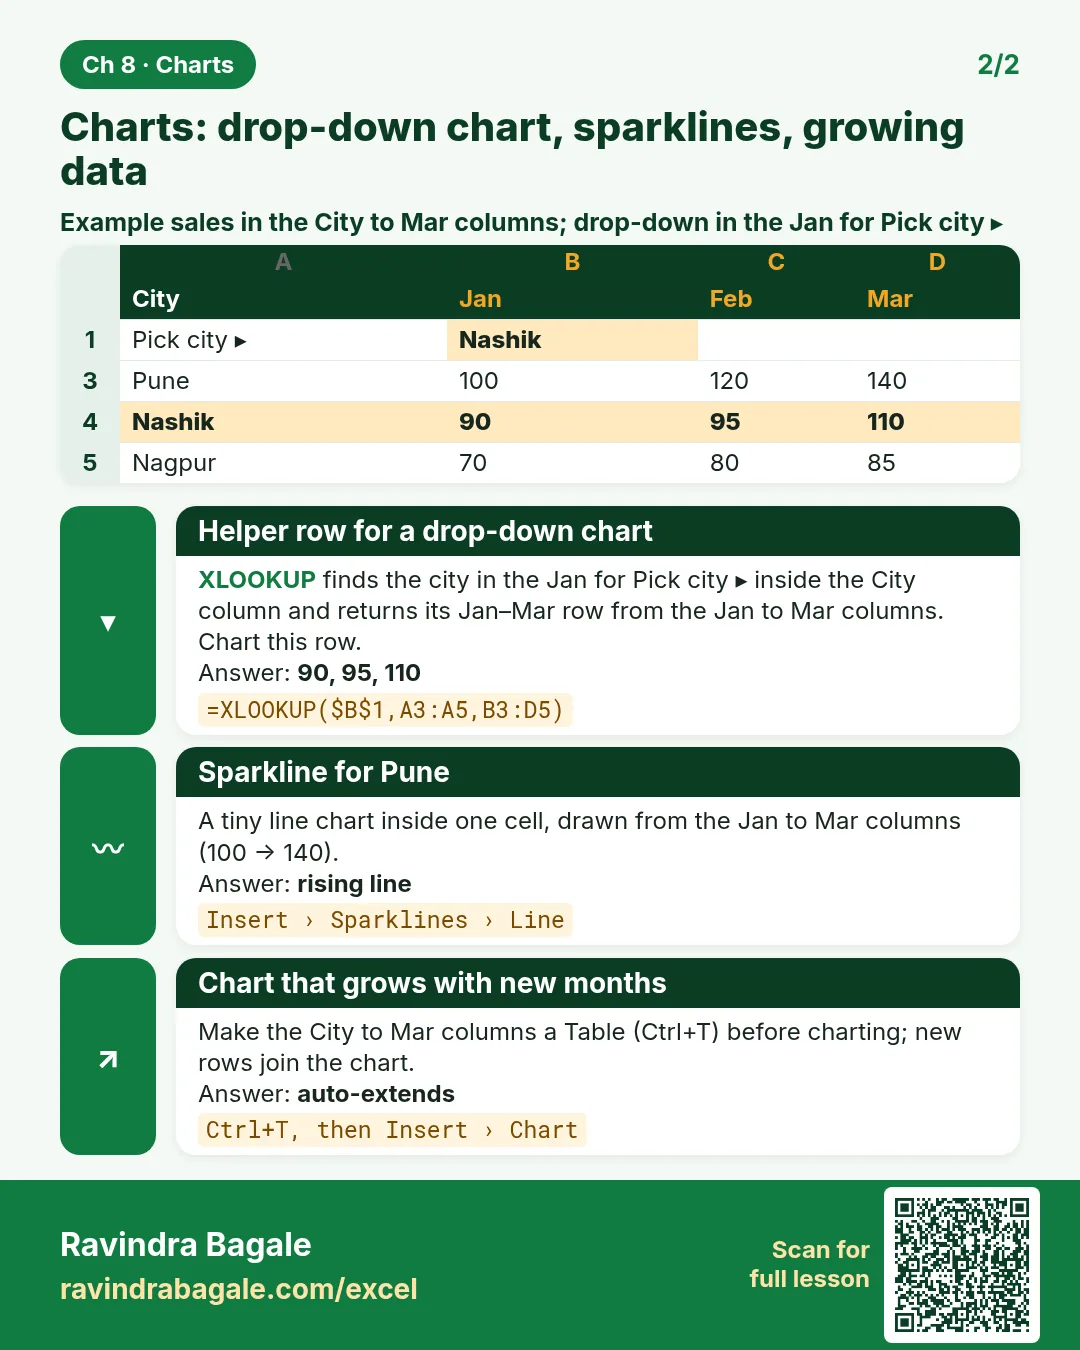
- 8.11Sparklines
- 8.12Choosing the Right Chart
- 8.13Dynamic Chart from a Table
- 8.14Drop-down Driven Dynamic Chart (INDEX / XLOOKUP)
- 8.15Named Ranges with OFFSET (Rolling Charts)
- 8.16Checkbox to Show/Hide a Series
The chapter recap is at the end of the last concept page.
Quick revision cards
Quick revision
Revise this chapter in two minutes. Save the cards on your phone or download them as PNG files. All names and numbers are made up for practice.
झटपट उजळणी
हा chapter दोन मिनिटांत revise करा. Cards phone वर save करा किंवा PNG म्हणून download करा. सगळी नावं आणि आकडे सरावासाठी काल्पनिक आहेत.
झटपट दोहराई
यह chapter दो मिनट में revise करें. Cards phone पर save करें या PNG के रूप में download करें. सभी नाम और आंकड़े अभ्यास के लिए काल्पनिक हैं.

More cards for every chapter: Ravi Sir's Cards.