11. What-If Analysis
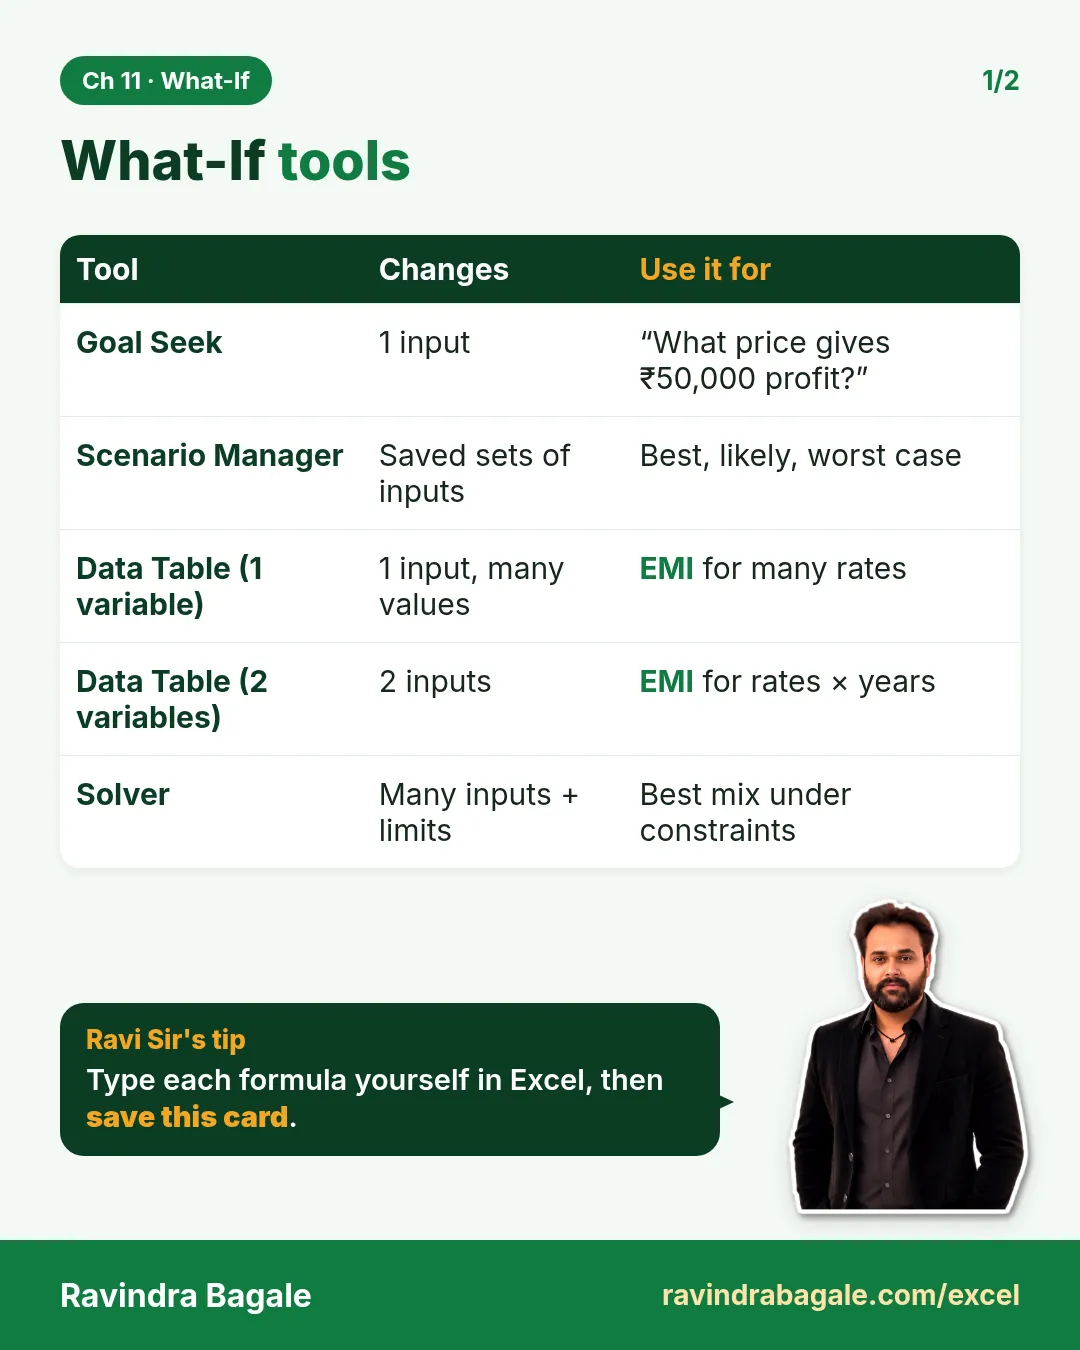
Come friends, today we solve "what if" questions: if orders grow by 10%, what is the profit? How many orders a day do we need to break even? Goal Seek, Scenario Manager, Data Tables and Solver are the what-if tools of Excel. Managers ask these questions all the time, and so do interviewers.
चला मित्रांनो, आज आपण "जर-तर" चे प्रश्न सोडवूया – जर orders 10% वाढले तर profit किती? Break-even साठी रोज किती orders लागतील? Goal Seek, Scenario Manager, Data Tables आणि Solver हे Excel चे what-if tools आहेत. Business manager ला हे प्रश्न नेहमी पडतात, आणि interview मध्ये पण विचारले जातात.
चलो दोस्तों, आज हम "अगर-तो" वाले सवाल हल करते हैं – अगर orders 10% बढ़े तो profit कितना? Break-even के लिए रोज़ कितने orders चाहिए? Goal Seek, Scenario Manager, Data Tables और Solver Excel के what-if tools हैं. Business manager को ये सवाल हमेशा आते हैं, और interview में भी पूछे जाते हैं.
What you will learn in this module
- Building a small, input-driven model
- Goal Seek to find the input needed for a target
- Scenario Manager for named best/normal/worst cases
- One- and two-variable Data Tables for sensitivity analysis
- Solver (brief) for optimisation (इष्टतम उत्तर शोधणे) with constraints
Live story: The break-even question
Suppose a new dark store in Kolhapur has fixed costs of ₹3,00,000 a month and earns ₹60 margin per order. The manager asks, "How many orders a day do we need to break even, and what if the margin drops to ₹50?" Trying numbers by hand is slow and easy to get wrong. This chapter answers it with Goal Seek, Scenario Manager, Data Tables and a short look at Solver.
All numbers in this story are fictional practice data.
Live story: Break-even चा प्रश्न
समजा Kolhapur मधल्या नवीन dark store चा fixed cost महिन्याला ₹3,00,000 आहे आणि प्रत्येक order वर ₹60 margin मिळतो. Manager विचारतात, "Break-even साठी रोज किती orders लागतील, आणि margin ₹50 झाला तर?" हाताने आकडे try करणं slow आहे आणि चूक व्हायला सोपं. हा chapter Goal Seek, Scenario Manager, Data Tables आणि Solver ची छोटी ओळख यांनी उत्तर देतो.
या story मधले सगळे आकडे काल्पनिक practice data आहेत.
Live story: Break-even का सवाल
मान लीजिए Kolhapur के नए dark store का fixed cost हर महीने ₹3,00,000 है और हर order पर ₹60 margin मिलता है. Manager पूछते हैं, "Break-even के लिए रोज़ कितने orders चाहिए, और margin ₹50 हो गया तो?" हाथ से आँकड़े try करना slow है और ग़लती आसानी से होती है. यह chapter Goal Seek, Scenario Manager, Data Tables और Solver की छोटी पहचान से जवाब देता है.
इस story के सारे आँकड़े काल्पनिक practice data हैं.
The model (fictional monthly P&L of the Wakad dark store, sheet Model):
| Cell | Item | Value / Formula |
|---|---|---|
| B2 | Orders per day (input) | 400 |
| B3 | Average order value, AOV (input) | ₹320 |
| B4 | Days in month (input) | 30 |
| B5 | Gross margin % (input) | 18% |
| B6 | Delivery cost per order (input) | ₹28 |
| B7 | Fixed cost per month – rent, staff (input) | ₹4,50,000 |
| B9 | Orders per month | =B2*B4 → 12,000 |
| B10 | Revenue | =B9*B3 → ₹38,40,000 |
| B11 | Gross margin | =B10*B5 → ₹6,91,200 |
| B12 | Delivery cost | =B9*B6 → ₹3,36,000 |
| B13 | Profit | =B11-B12-B7 → -₹94,800 |
Inputs are typed values; everything else is a formula referring to the inputs. That is the golden rule for any what-if model.
Concepts in this chapter
- 11.1Goal Seek
- 11.2Scenario Manager
- 11.3One-variable Data Table
- 11.4Two-variable Data Table
- 11.5Solver (Brief)
The chapter recap is at the end of the last concept page.
Quick revision cards
Quick revision
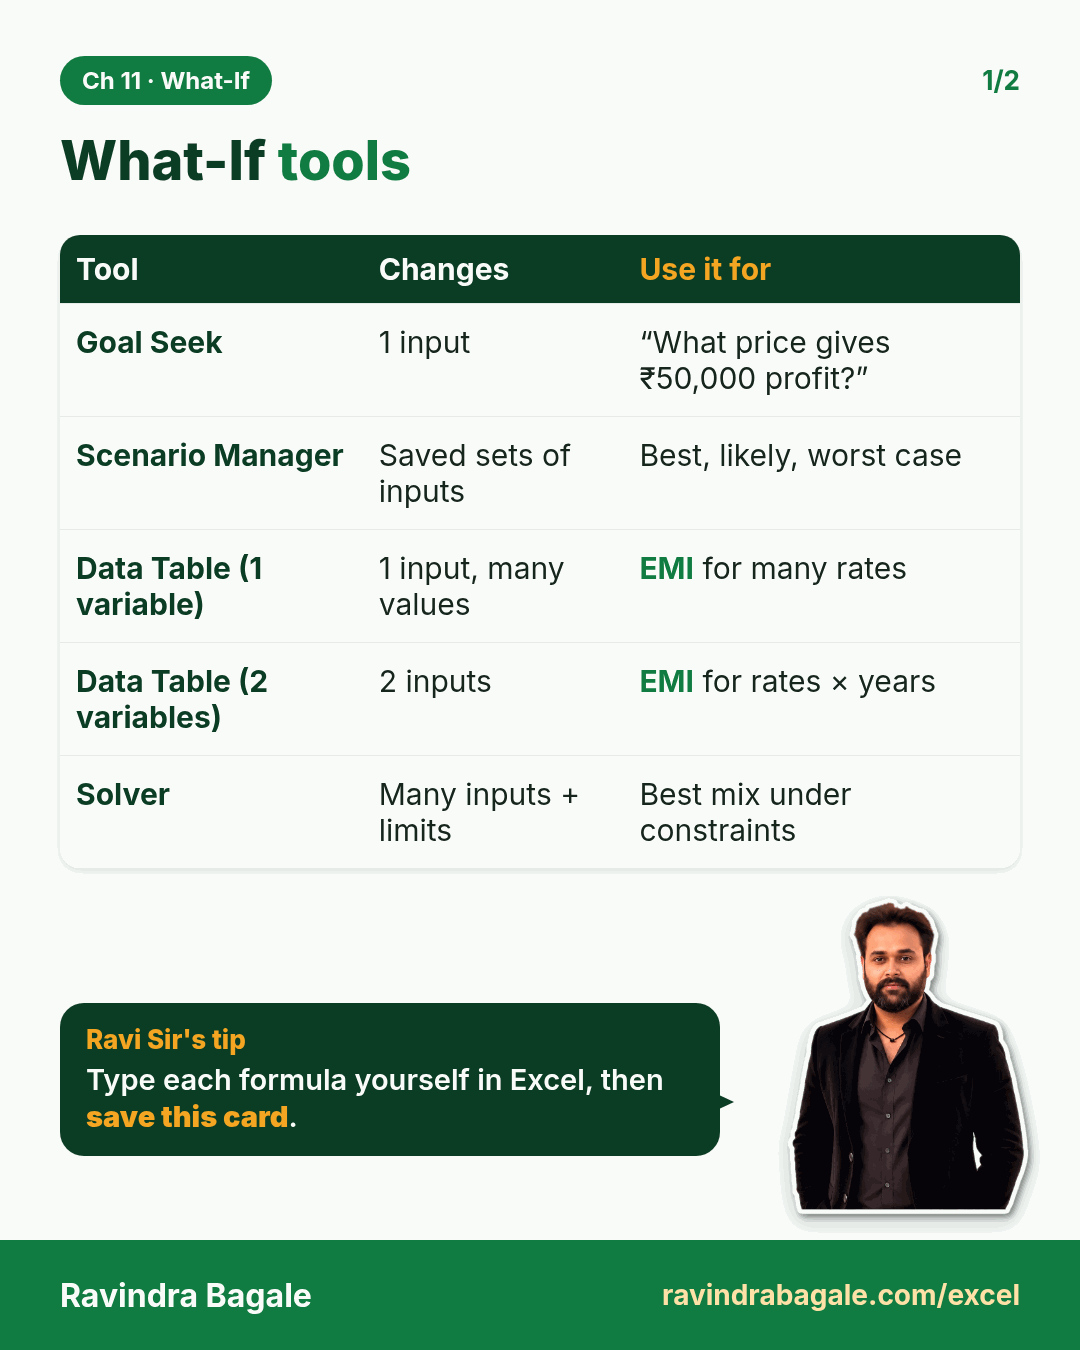
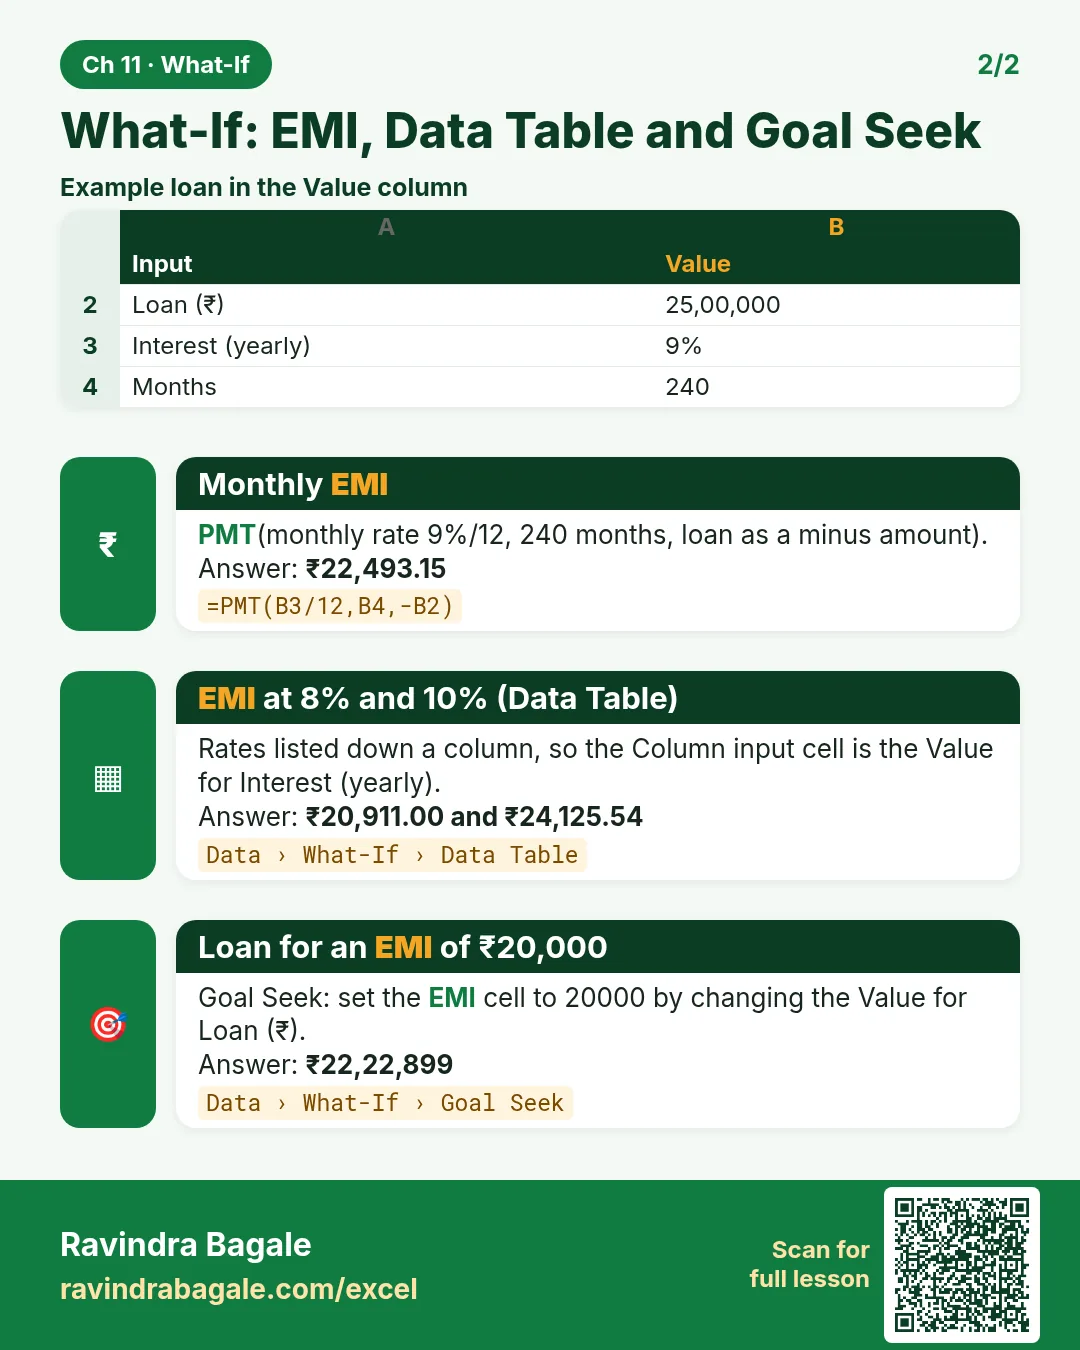
Revise this chapter in two minutes. Save the cards on your phone or download them as PNG files. All names and numbers are made up for practice.
झटपट उजळणी
हा chapter दोन मिनिटांत revise करा. Cards phone वर save करा किंवा PNG म्हणून download करा. सगळी नावं आणि आकडे सरावासाठी काल्पनिक आहेत.
झटपट दोहराई
यह chapter दो मिनट में revise करें. Cards phone पर save करें या PNG के रूप में download करें. सभी नाम और आंकड़े अभ्यास के लिए काल्पनिक हैं.

More cards for every chapter: Ravi Sir's Cards.