13. Excel Dashboards
Come friends, now we use everything we have learned together – Tables, formulas, PivotTables, charts and slicers – and build one complete Blinkit dashboard. A dashboard is one page where a manager understands in 30 seconds how the business is doing. Colours and design come later – first the questions and the KPIs. Do not worry, we go step by step.
चला मित्रांनो, आता आपण शिकलेलं सगळं एकत्र वापरणार आहोत – Tables, formulas, PivotTables, charts आणि slicers – आणि एक पूर्ण Blinkit dashboard बनवणार आहोत. Dashboard म्हणजे एक page जिथे manager ला 30 सेकंदात समजलं पाहिजे की business कसा चाललाय. रंग आणि design नंतर – आधी प्रश्न आणि KPIs. घाबरू नका, step by step करूया.
चलो दोस्तों, अब हम सीखा हुआ सब एक साथ इस्तेमाल करेंगे – Tables, formulas, PivotTables, charts और slicers – और एक पूरा Blinkit dashboard बनाएँगे. Dashboard मतलब एक page जहाँ manager को 30 सेकंड में समझ आ जाए कि business कैसा चल रहा है. रंग और design बाद में – पहले सवाल और KPIs. घबराइए मत, step by step करेंगे.
What you will learn in this module
- Planning a dashboard: audience, business questions and KPIs (key performance indicators)
- Structuring the workbook into Data, Calc and Dashboard sheets
- Building KPI cards linked to formulas and GETPIVOTDATA
- Building the PivotTables and PivotCharts that feed the dashboard
- Connecting slicers and a timeline to every pivot
- Layout and design principles, refresh and a final checklist
Live story: One page for the state head
Suppose Shraddha Bagale wants one page she can read in 30 seconds every morning: total sales, orders, average order value and on-time %, a city chart, a trend line, and slicers for month and platform. Today she gets four separate sheets and reads none of them. This chapter plans the KPIs, builds the PivotTables and cards behind them, and lays out one clean dashboard.
All numbers in this story are fictional practice data.
Live story: State head साठी एक page
समजा Shraddha Bagale ना रोज सकाळी 30 सेकंदात वाचता येईल असं एक page हवंय: total sales, orders, average order value आणि on-time %, एक city chart, एक trend line, आणि month आणि platform साठी slicers. आज त्यांना चार वेगळ्या sheets मिळतात आणि त्या एकही वाचत नाहीत. हा chapter KPIs plan करतो, त्यामागचे PivotTables आणि cards बनवतो, आणि एक स्वच्छ dashboard मांडतो.
या story मधले सगळे आकडे काल्पनिक practice data आहेत.
Live story: State head के लिए एक page
मान लीजिए Shraddha Bagale को हर सुबह 30 सेकंड में पढ़ने लायक एक page चाहिए: total sales, orders, average order value और on-time %, एक city chart, एक trend line, और month और platform के लिए slicers. आज उन्हें चार अलग sheets मिलती हैं और वे एक भी नहीं पढ़तीं. यह chapter KPIs plan करता है, उनके पीछे के PivotTables और cards बनाता है, और एक साफ़ dashboard सजाता है.
इस story के सारे आँकड़े काल्पनिक practice data हैं.
The dashboard we will build (fictional data, March 2026). The Orders Table (tblOrders) holds all Blinkit and Amazon Now order lines for the six cities. The month's headline numbers, which the dashboard must show, are:
| KPI | Value (March 2026) | How it is calculated |
|---|---|---|
| Net Sales | ₹49,50,000 | Sum of Amount for Delivered orders |
| Total Orders | 14,000 | Count of Order ID (all statuses) |
| Delivered Orders | 13,200 | Count where Status = Delivered |
| AOV (average order value) | ₹375 | Net Sales ÷ Delivered Orders |
| Cancellation Rate | 4.0% | 560 cancelled ÷ 14,000 |
| Avg Delivery Time | 11.6 min | Average of Delivery Mins for Delivered orders |
City split of Net Sales: Pune ₹18,42,500 · Nagpur ₹9,86,300 · Nashik ₹7,12,400 · Sambhaji Nagar ₹6,05,900 · Kolhapur ₹4,38,700 · Solapur ₹3,64,200 (total ₹49,50,000).
Concepts in this chapter
- 13.1Planning: Audience, Questions and KPIs
- 13.2Structuring the Workbook: Data, Calc, Dashboard
- 13.3PivotTables that Feed the Dashboard
- 13.4KPI Cards
- 13.5Charts for the Dashboard
- 13.6Slicers and a Timeline for All Pivots
- 13.7Layout and Design Principles
- 13.8Refresh, Finishing Touches and a Checklist
Review and practice
The chapter recap is at the end of the last concept page.
Quick revision cards
Quick revision
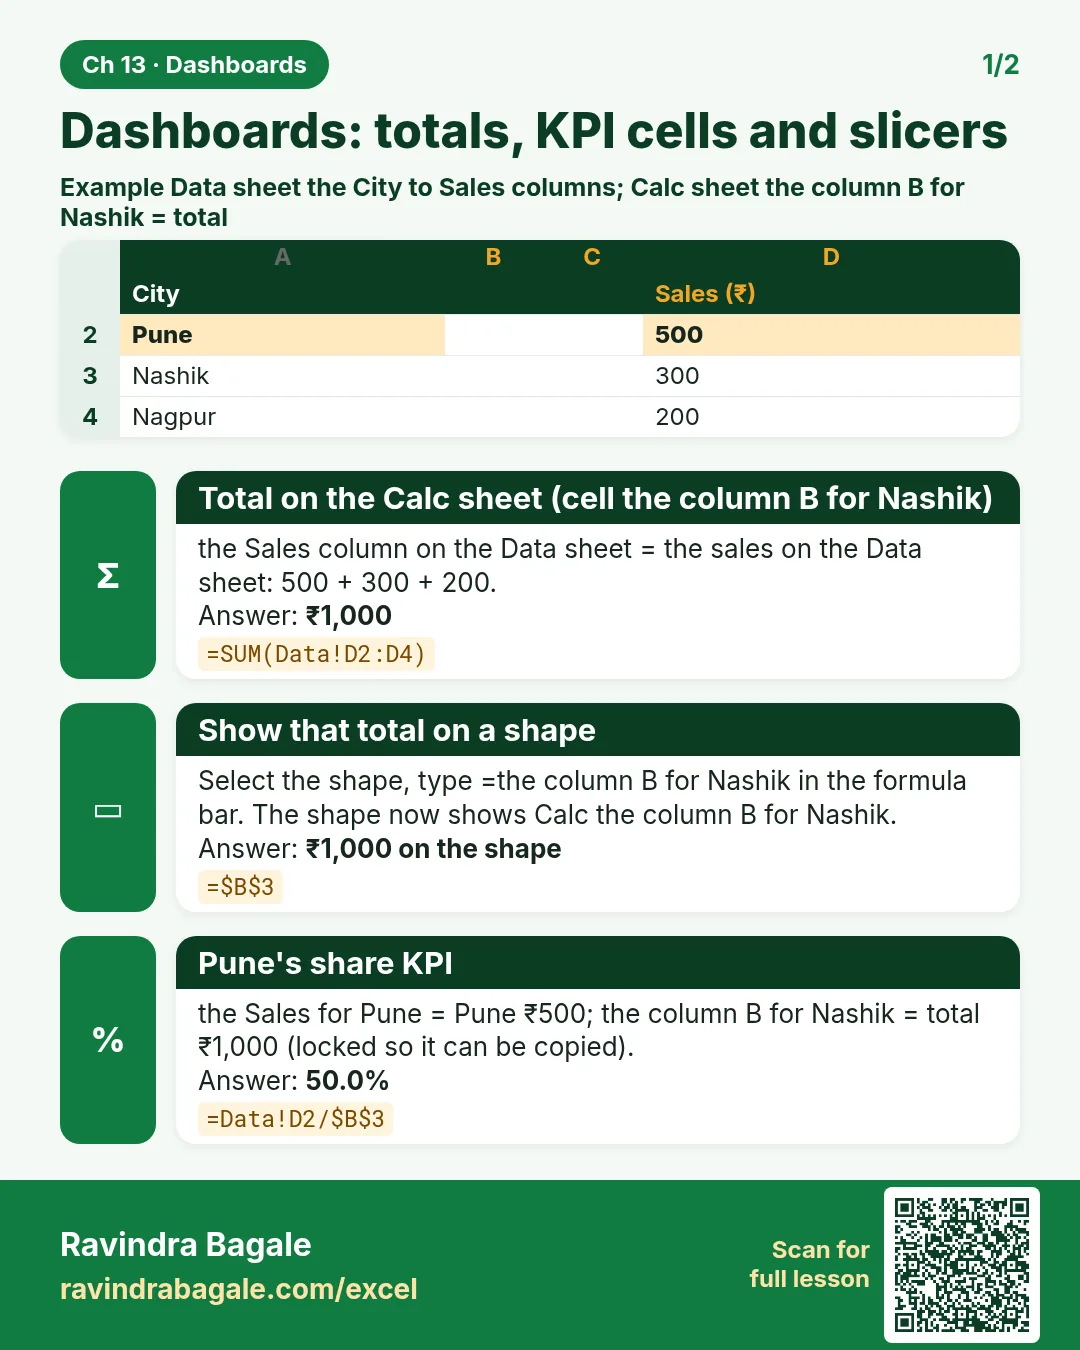
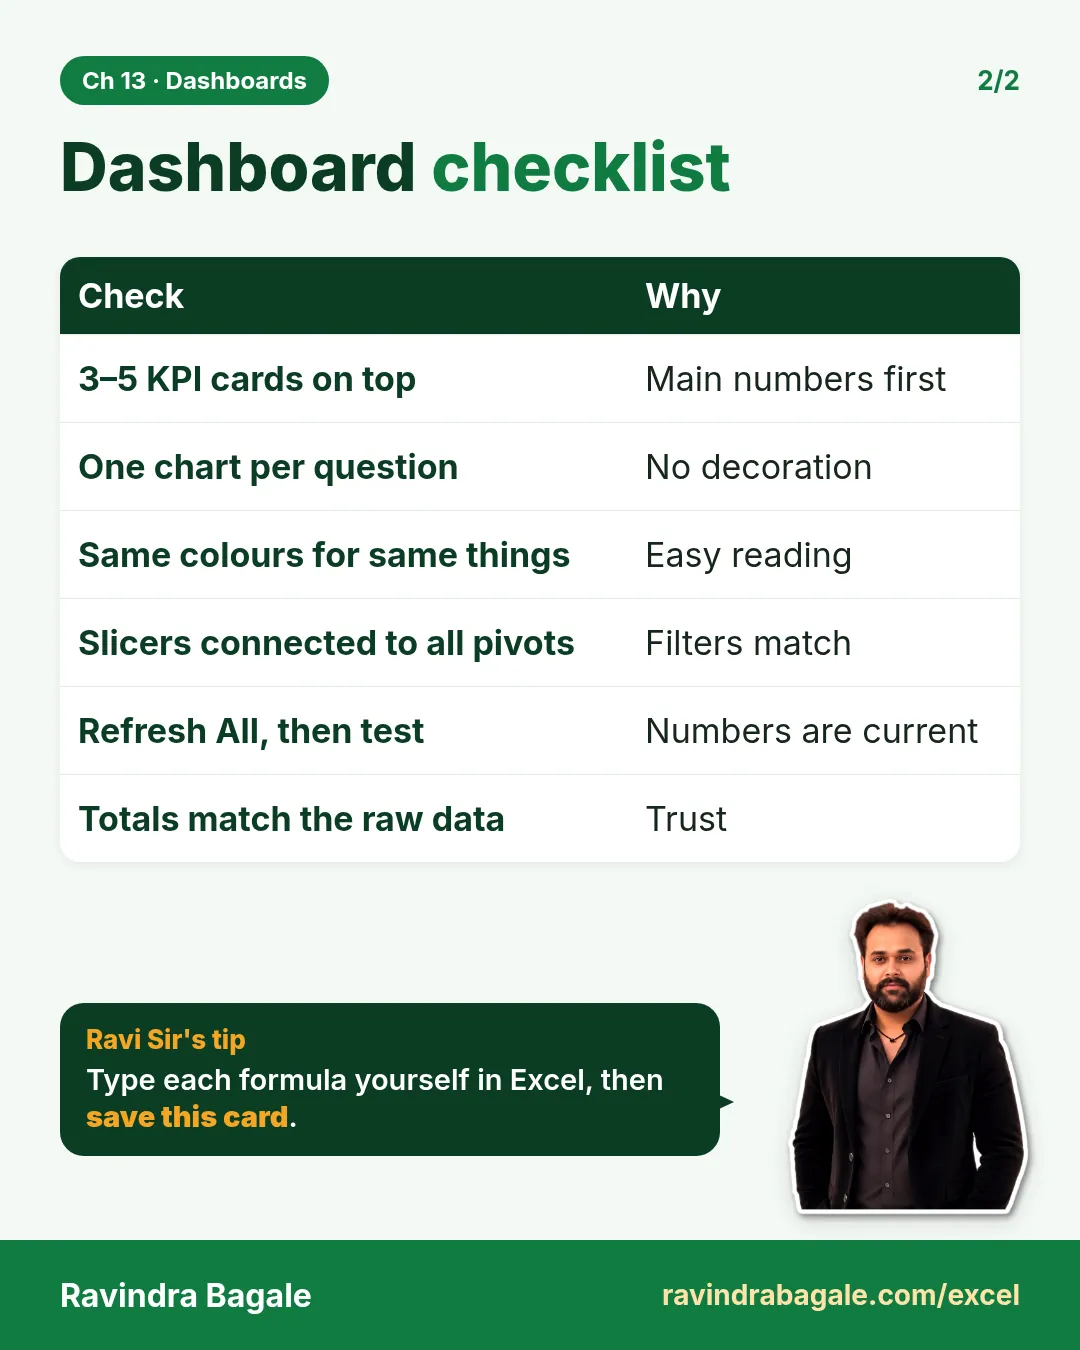
Revise this chapter in two minutes. Save the cards on your phone or download them as PNG files. All names and numbers are made up for practice.
झटपट उजळणी
हा chapter दोन मिनिटांत revise करा. Cards phone वर save करा किंवा PNG म्हणून download करा. सगळी नावं आणि आकडे सरावासाठी काल्पनिक आहेत.
झटपट दोहराई
यह chapter दो मिनट में revise करें. Cards phone पर save करें या PNG के रूप में download करें. सभी नाम और आंकड़े अभ्यास के लिए काल्पनिक हैं.

More cards for every chapter: Ravi Sir's Cards.