Farm Management System in Excel: Plot-wise Expenses, Crop Sales, Profit per Acre, Cost per Quintal and Dashboard
Ravindra Bagale farms 8.5 acres near Solapur: soybean, onion, tur and maize this kharif. Seed, fertiliser, spray and labour bills were in a notebook and sale slips in a bag, so nobody knew which crop really paid. This page builds an 8-sheet Excel system: every rupee spent is tagged to a plot and a head, every market sale nets out charges and transport, and Crop profit shows profit per acre and cost per quintal for each plot.
What you'll learn on this page
- Set plots with crop, area, expected yield and sowing date
- Tag every expense to a plot and a head
- Net out market charges and transport on each sale
- Work out profit per acre, yield vs expected and cost per quintal
- Report expenses by head and plot with a two-condition SUMIFS
- Print a crop card for one plot
- Show the season on a dashboard
Download the template: farm-management-system-template.xlsx: a 8-sheet system with example data and real formulas (Read me, Setup, Expenses, Sales, Crop profit, Report, Crop card, Dashboard). Yellow cells are inputs you can type over; green cells hold formulas; blue rows are headers and totals. Replace the example data with your own and every report and the dashboard recalculate.
Made-up data: every name, amount, business and date on this page is made up for practice. Cities are used only to make the examples feel real.
1. The business story
Bagale Farm, Solapur, kharif 2026, as of 17 October 2026 (made-up data). Market charges 6% and transport ₹40 a quintal are examples; use the numbers on your own sale slips.
| Question | Where the system answers it |
|---|---|
| Which crop pays best per acre? | Onion: ₹59,807 profit on 2 acres, ₹29,904 an acre |
| Did soybean yield as expected? | 8.8 quintal an acre against 9, 98% |
| What rate must soybean fetch to break even? | Cost per quintal ₹2,140 |
| Where did the money go? | Labour ₹79,000 of ₹2,20,700, the biggest head |
Net sales so far ₹3,53,254; profit ₹1,32,554, with tur still in the field.
Figure 1. Setup holds plots; Expenses and Sales are the entry sheets; Crop profit, Report, Crop card and Dashboard read from them.
2. Build it sheet by sheet
Step 1. Setup: plots
- B3 as-of date, B4 season, B5 market charges (6%), B6 transport per quintal (₹40).
- Plots in A9:E12: Plot, Crop, Area (acres), Expected yield (quintal per acre), Sowing date. Expense heads in column G.
Step 2. Expenses and Sales
- Expenses: Date, Plot, Head, Amount with plot and head from drop-downs. C5 fills the crop
=XLOOKUP(B5,Setup!$A$9:$A$12,Setup!$B$9:$B$12,"Check plot"). - Sales: Date, Plot, Qty, Rate from each slip. F5 gross
=ROUND(D5*E5,0), G5 market charges=ROUND(F5*Setup!$B$5,0), H5 transport=D5*Setup!$B$6, I5 net=F5-G5-H5.
Step 3. Crop profit
- D5 cost
=SUMIFS(Expenses!$E$5:$E$3000,Expenses!$B$5:$B$3000,A5), F5 quintals and J5 net sales with SUMIFS. - G5 yield per acre
=F5/C5and I5 yield vs expected=G5/H5. - K5 profit, L5 profit per acre
=K5/C5, M5 cost per quintal=IFERROR(D5/F5,0). - N5:
=IF(F5=0,"Not harvested",IF(K5>=0,"Profit","Loss")).

Figure 2. Crop profit: cost, yield, net sales, profit per acre, cost per quintal and status for each plot
Step 4. Report and Crop card
- Report B5
=SUMIFS(Expenses!$E$5:$E$3000,Expenses!$D$5:$D$3000,$A5,Expenses!$B$5:$B$3000,B$4). The mixed references let one formula fill the whole head × plot grid. - Crop card: type a plot in B4; rows 6 to 14 bring the plot's numbers with XLOOKUP. Set the print area.
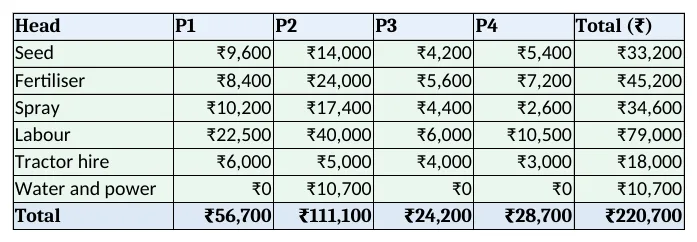
Figure 3. Report: expenses by head and plot with a two-condition SUMIFS
Step 5. Dashboard
- KPI cards: total cost, net sales, profit so far, profit per acre, best crop per acre and quintals sold.
- E5 best crop
=INDEX('Crop profit'!B5:B8,MATCH(MAX('Crop profit'!L5:L8),'Crop profit'!L5:L8,0))(INDEX MATCH). - Charts: profit by crop and expenses by head.
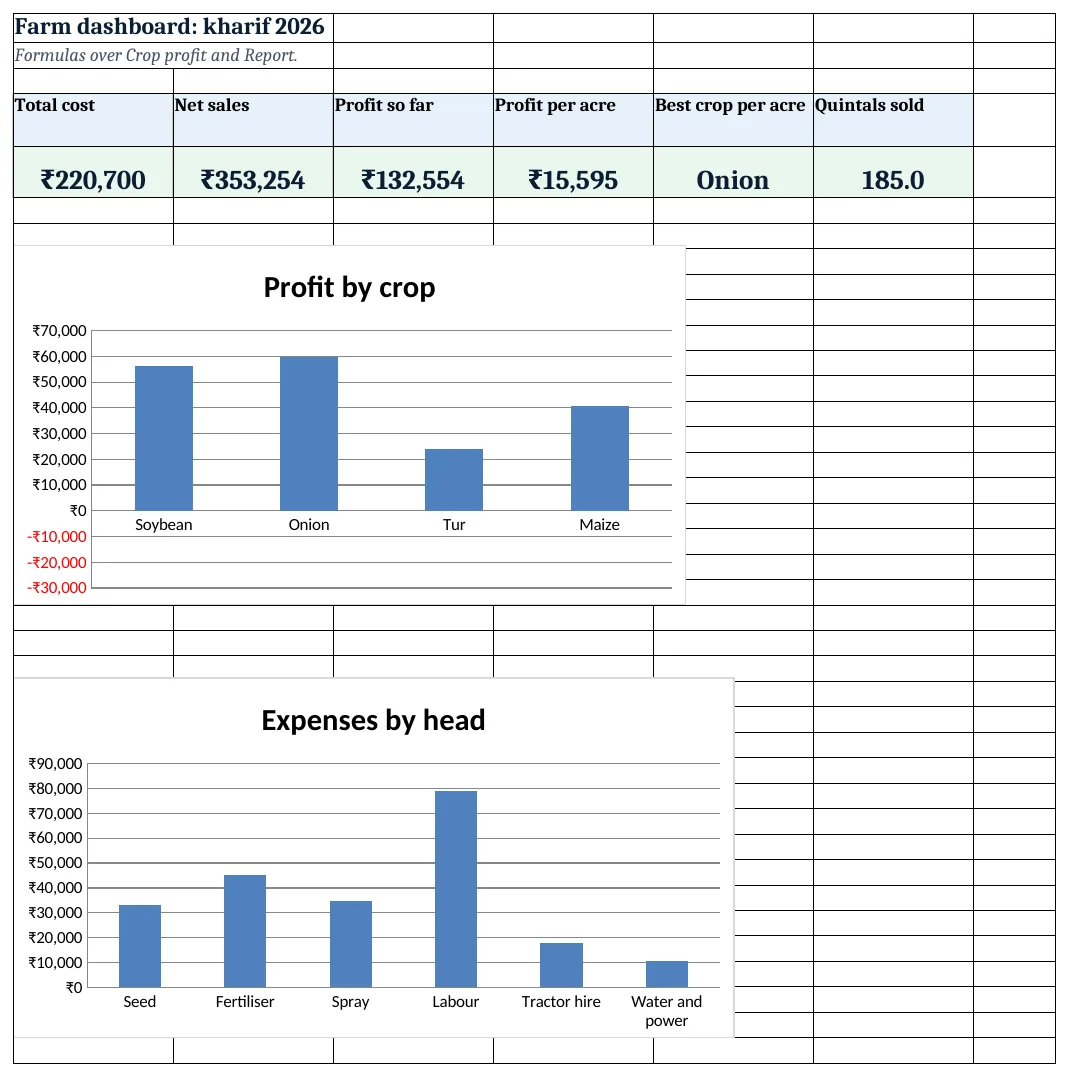
Figure 4. Farm dashboard: total cost, net sales, profit, profit per acre, best crop and quintals sold
Ravindra Bagale's Tip
Keep the cost per quintal handy at the market. If the rate offered is below it, the crop loses money.
Ravindra Bagale's Tip – मराठी
बाजारात cost per quintal लक्षात ठेवा. मिळणारा भाव त्यापेक्षा कमी असेल तर पिकात तोटा होतो.
Ravindra Bagale's Tip – हिंदी
मंडी में cost per quintal याद रखें. मिलने वाला भाव उससे कम हो तो फसल में घाटा है.
3. Formulas used
| Cell | Formula | What it does |
|---|---|---|
| Expenses!C5 | =XLOOKUP(B5,Setup!$A$9:$A$12,Setup!$B$9:$B$12,"Check plot") |
Crop from the plot |
| Sales!F5 | =ROUND(D5*E5,0) |
Gross sale |
| Sales!G5 | =ROUND(F5*Setup!$B$5,0) |
Market charges |
| Sales!H5 | =D5*Setup!$B$6 |
Transport |
| Sales!I5 | =F5-G5-H5 |
Net sale |
| Crop profit!D5 | =SUMIFS(Expenses!$E$5:$E$3000,Expenses!$B$5:$B$3000,A5) |
Cost per plot |
| Crop profit!G5 | =F5/C5 |
Yield per acre |
| Crop profit!I5 | =G5/H5 |
Yield vs expected |
| Crop profit!J5 | =SUMIFS(Sales!$I$5:$I$2000,Sales!$B$5:$B$2000,A5) |
Net sales per plot |
| Crop profit!L5 | =K5/C5 |
Profit per acre |
| Crop profit!M5 | =IFERROR(D5/F5,0) |
Cost per quintal |
| Crop profit!N5 | =IF(F5=0,"Not harvested",IF(K5>=0,"Profit","Loss")) |
Crop status |
| Report!B5 | =SUMIFS(Expenses!$E$5:$E$3000,Expenses!$D$5:$D$3000,$A5,Expenses!$B$5:$B$3000,B$4) |
Expense by head and plot |
| Crop card!B12 | =XLOOKUP($B$4,'Crop profit'!$A$5:$A$8,'Crop profit'!$K$5:$K$8,"Not found") |
Profit on the crop card |
| Dashboard!E5 | =INDEX('Crop profit'!B5:B8,MATCH(MAX('Crop profit'!L5:L8),'Crop profit'!L5:L8,0)) |
Best crop per acre |
Every formula above is written in the template, so you can click a cell and see it in the formula bar. All values on this page were recalculated in LibreOffice with zero errors.
4. Common mistakes
- Comparing total profit across plots. Plots differ in size. Profit per acre is the fair comparison.
- Using the gross sale. Market charges and transport come off before the money reaches you. Use net sales.
- Leaving family labour out. Put a rate on your own days too, or labour cost looks lower than it is.
- Expenses without a plot. Shared costs like a pump repair can be split by acres across plots.
- Calling an unharvested crop a loss. Tur shows Not harvested: its costs are in, sales are still to come.
Ravindra Bagale's Tip
Type each bill and sale slip the same day. A season of notebook entries is hard to tag to the right plot later.
Ravindra Bagale's Tip – मराठी
प्रत्येक बिल आणि पट्टी त्याच दिवशी नोंदवा. पूर्ण हंगामाच्या वहीतील नोंदी नंतर plot ला जोडणे कठीण जाते.
Ravindra Bagale's Tip – हिंदी
हर बिल और पर्ची उसी दिन दर्ज करें. पूरे मौसम की कॉपी की entries बाद में plot से जोड़ना कठिन है.
5. More real examples
Example 1: Dairy with fodder plots. Add milk income and link it with the dairy collection system.
Example 2: Orchard. Plots become blocks of trees; track yearly costs and income per tree as well as per acre.
Example 3: Polyhouse. Add a structure cost per season and yield per square metre.
Quick revision cards
Quick revision
Each card shows formulas from this page, each with an example and its answer from the template. Scan the QR code on a card to open this lesson. All names and numbers are made up for practice.
झटपट उजळणी
प्रत्येक card वर या page मधले formulas, त्यांचं example आणि template मधलं उत्तर आहे. Card वरचा QR code scan केला की हा lesson उघडतो. सगळी नावं आणि आकडे सरावासाठी काल्पनिक आहेत.
झटपट दोहराई
हर card पर इस page के formulas, उनका example और template का उत्तर है. Card का QR code scan करें तो यह lesson खुलेगा. सभी नाम और आंकड़े अभ्यास के लिए काल्पनिक हैं.
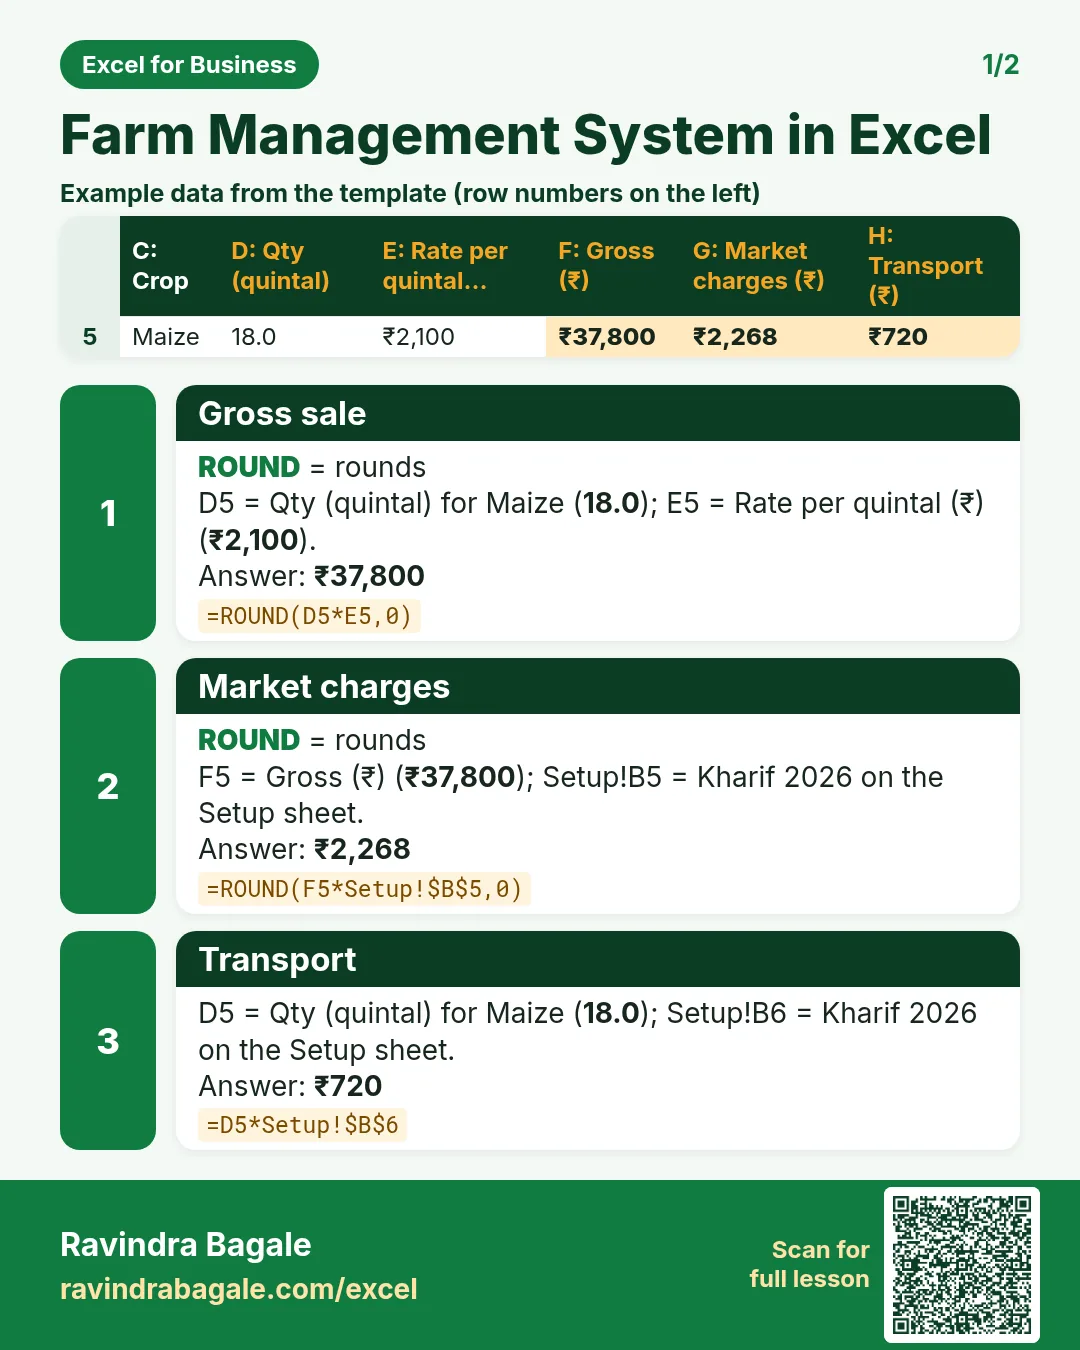

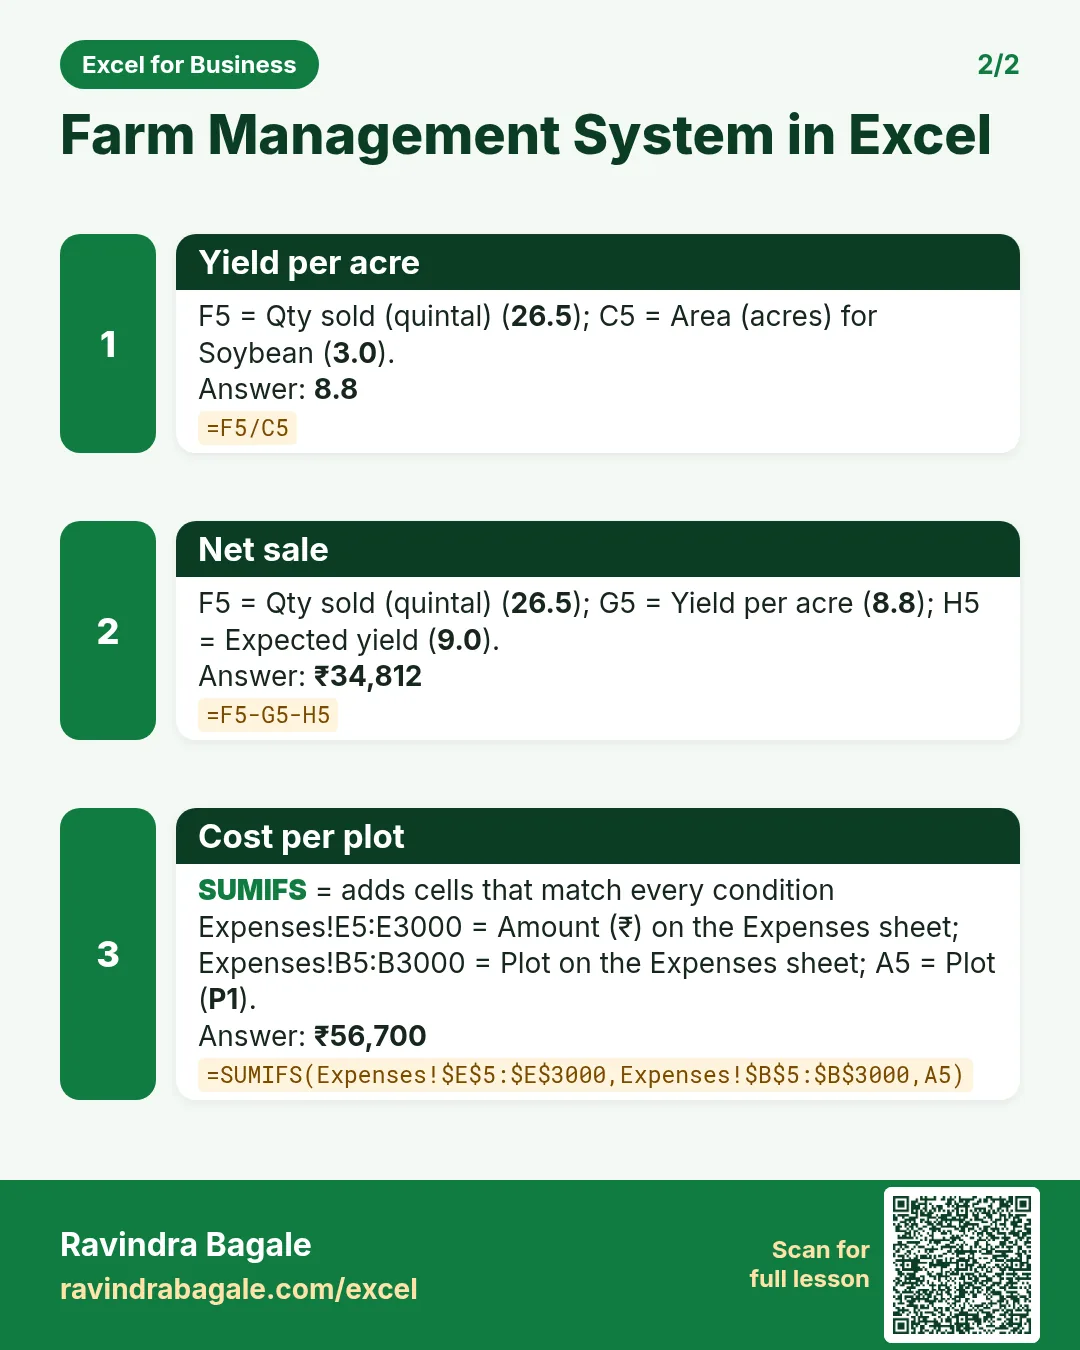

More cards: Ravi Sir's Cards.
6. Frequently asked questions
How do I calculate profit per acre in Excel?
(Net sales − cost) ÷ acres, per plot, as in Crop profit L5.
How do I work out cost per quintal?
Total cost ÷ quintals sold, with IFERROR for a crop not yet sold.
Is farm income taxed?
Agricultural income is exempt under section 10(1) of the Income-tax Act, but it can affect the rate on other income. Ask your tax adviser.
How do I report expenses by head and plot?
SUMIFS with two conditions and mixed references, so one formula fills the grid.
How do I compare yield with my target?
Yield per acre ÷ expected yield per acre, as in Crop profit I5.
7. Quick quiz
Ten questions on this page. Sign in to save your score.
Loading practice tasks...
- Total times (Easy): Add up Times in D2:D11.
- Average amount (Easy): Average of E2:E11, rounded to 2 decimals.
- Rows in Food (Easy): How many rows have Category "Food"?
- Largest times (Easy): The largest value in D2:D11.
- Times for Food (Medium): Total of D2:D11 where B is "Food".
- Food in Pune (Medium): Total of D2:D11 where B is "Food" and C is "Pune".
- Best in Food (Medium): Largest E2:E11 value where B is "Food".
- Value of row 2 (Medium): D2 times E2.
- Look up Arjun Mehta (Medium): The Times for "Arjun Mehta" (use a lookup on column A).
- Total value (Hard): Sum of D times E for all rows.
- Share of Food (Hard): Share of D2:D11 that is "Food", rounded to 3 decimals.
- Rank of row 2 (Hard): Rank of D2 among D2:D11 (largest = 1).
- Above average? (Hard): "Above" if E2 is above the average of E2:E11, else "Below".