7. PivotTables and PivotCharts
7.2 Field Areas: Rows, Columns, Values and Filters
| Area | Holds | Example |
|---|---|---|
| Rows | Categories listed down | City, Area |
| Columns | Categories across | Platform |
| Values | Numbers to summarise | Sum of Amount, Count of Order ID |
| Filters | A filter for the whole pivot | Status = Delivered |
About this data: Teaching sample for a fictional shop “GreenField Dairy”. Figures and names (e.g. Meera Joshi) are made up for this lesson on field areas rows columns values and filters.
Worked example – City × Platform (mini dataset). Rows: City; Columns: Platform; Values: Amount.
| City | MarketRush | FreshGo | Grand Total |
|---|---|---|---|
| Kolhapur | 232 | 232 | |
| Nagpur | 240 | 240 | |
| Nashik | 360 | 360 | |
| Pune | 110 | 434 | 544 |
| Sambhaji Nagar | 195 | 195 | |
| Solapur | 1,299 | 1,299 | |
| Grand Total | 537 | 2,333 | 2,870 |
About this data: Demo table only — not real customer or company data. Built to practise field areas rows columns values and filters.
Steps in Excel – layout options
- Design › Layout › Report Layout › Show in Tabular Form and Repeat All Item Labels – looks like a normal table (good for copying).
- Design › Layout › Grand Totals / Subtotals – on/off.
- Design › Layout › Blank Rows and PivotTable Styles for appearance.
- Right-click a value › Number Format… › apply the Indian rupee format (1.5) – it stays after refresh.
- Show empty cells as 0: PivotTable Analyze › PivotTable › Options › Layout & Format › For empty cells show:
0.
Ravindra Bagale's Tip
When formatting numbers in Values, many students select the cells and use Home › Number – and the format is lost on refresh. Use right-click on a value › Number Format or Value Field Settings › Number Format; then the format stays. Tabular Form + Repeat Labels make the pivot much easier to read.
Ravindra Bagale's Tip – मराठी
Values मध्ये number format लावताना बरेच students cells select करून Home › Number वापरतात – refresh केल्यावर format जातो. Value वर right-click › Number Format किंवा Value Field Settings › Number Format वापरा, मग format कायम राहतो. Tabular Form + Repeat Labels ने pivot वाचायला खूप सोपा होतो.
Ravindra Bagale's Tip – हिंदी
Values में number format लगाते समय बहुत से students cells select करके Home › Number इस्तेमाल करते हैं – refresh करते ही format चला जाता है. Value पर right-click › Number Format या Value Field Settings › Number Format इस्तेमाल करो, फिर format हमेशा रहता है. Tabular Form + Repeat Labels से pivot पढ़ना बहुत आसान हो जाता है.
Practice task
Build Area (rows) × Platform (columns) with Sum of Amount, Tabular Form, repeated labels, empty cells shown as 0 and Indian rupee format.
Loading practice tasks...
- Distinct groups (Easy): How many different values in the "Channel" column?
- List groups (Easy): Unique list of the "Channel" column.
- Filter names (Easy): Names in the "Name" column where "Channel" is "Website".
- Sum of filtered (Medium): Sum of the "Quantity" column where "Channel" is "App", using FILTER.
- Count filtered (Medium): Rows where "Quantity" is above the average of the "Quantity" column.
- Sorted values (Medium): the "Quantity" column sorted largest first.
- Top value via SORT (Medium): The largest the "Unit price ($)" column value using SORT and INDEX.
- Second largest (Hard): Second largest the "Quantity" column using SORT and INDEX.
- Numbers 1 to 5 (Hard): A spill of numbers 1 to 5.
- Two-condition filter (Hard): Sum of the "Quantity" column where "Channel" is "Website" or "App".
- Names joined (Hard): Names where "Channel" is "Website", joined with ", ".
Worked example — field areas rows columns values and filters
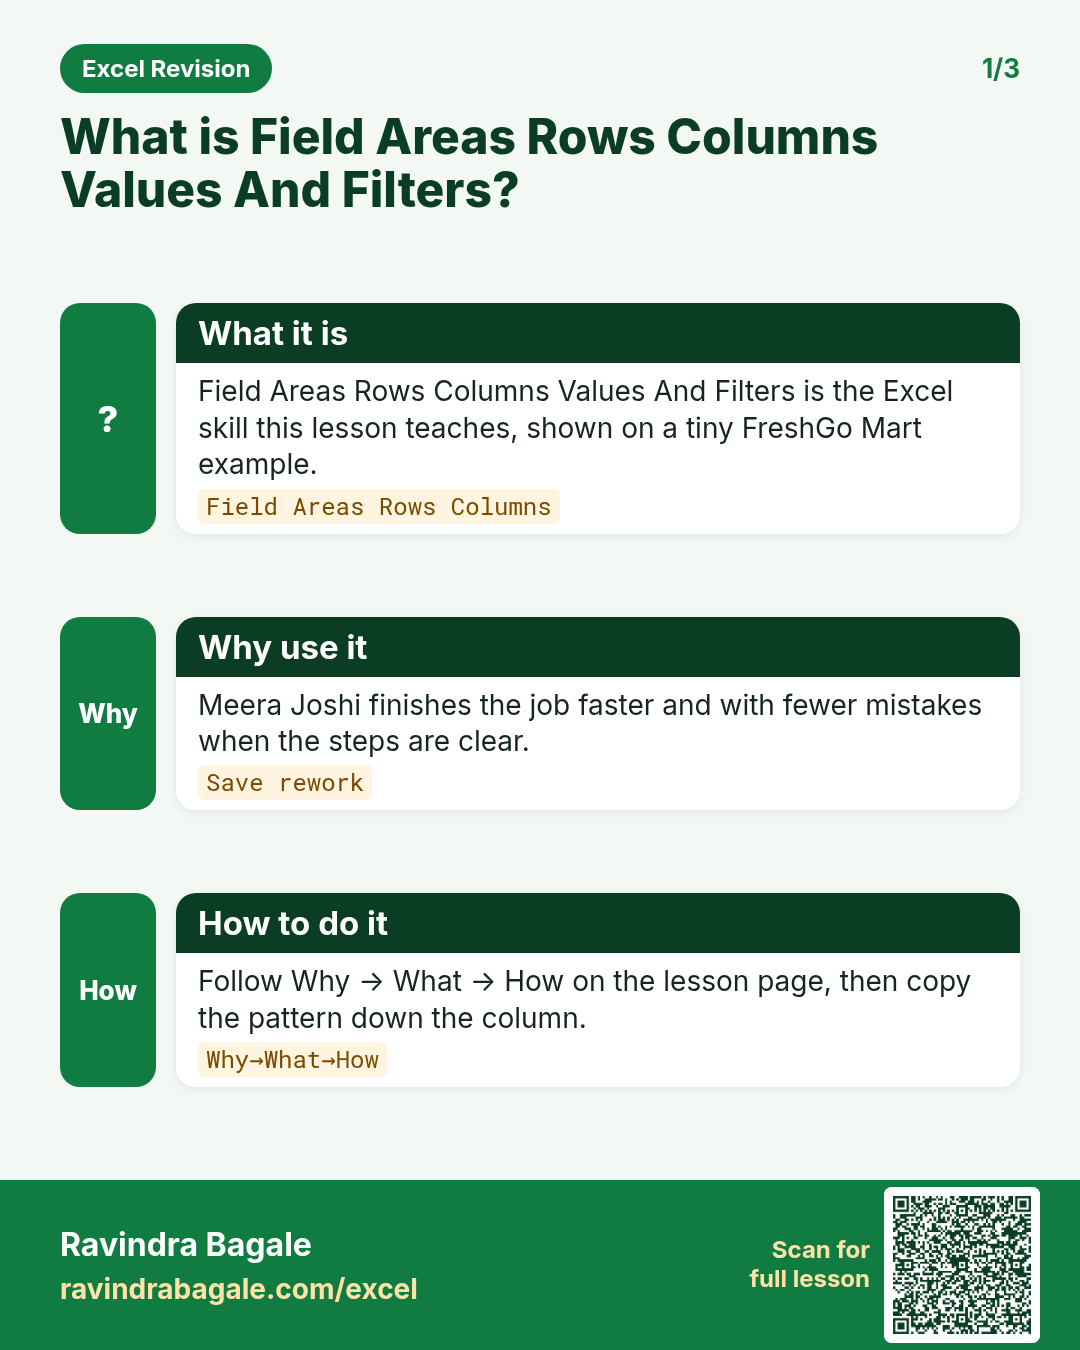
Why
Aamir Khan in Pune and Emma Clarke abroad both need a clear, repeatable way to use field areas rows columns values and filters on a Summit Schools sheet without breaking totals.
What
Field Areas Rows Columns Values And Filters is the Excel idea this page teaches. We will walk one tiny example end to end.
How
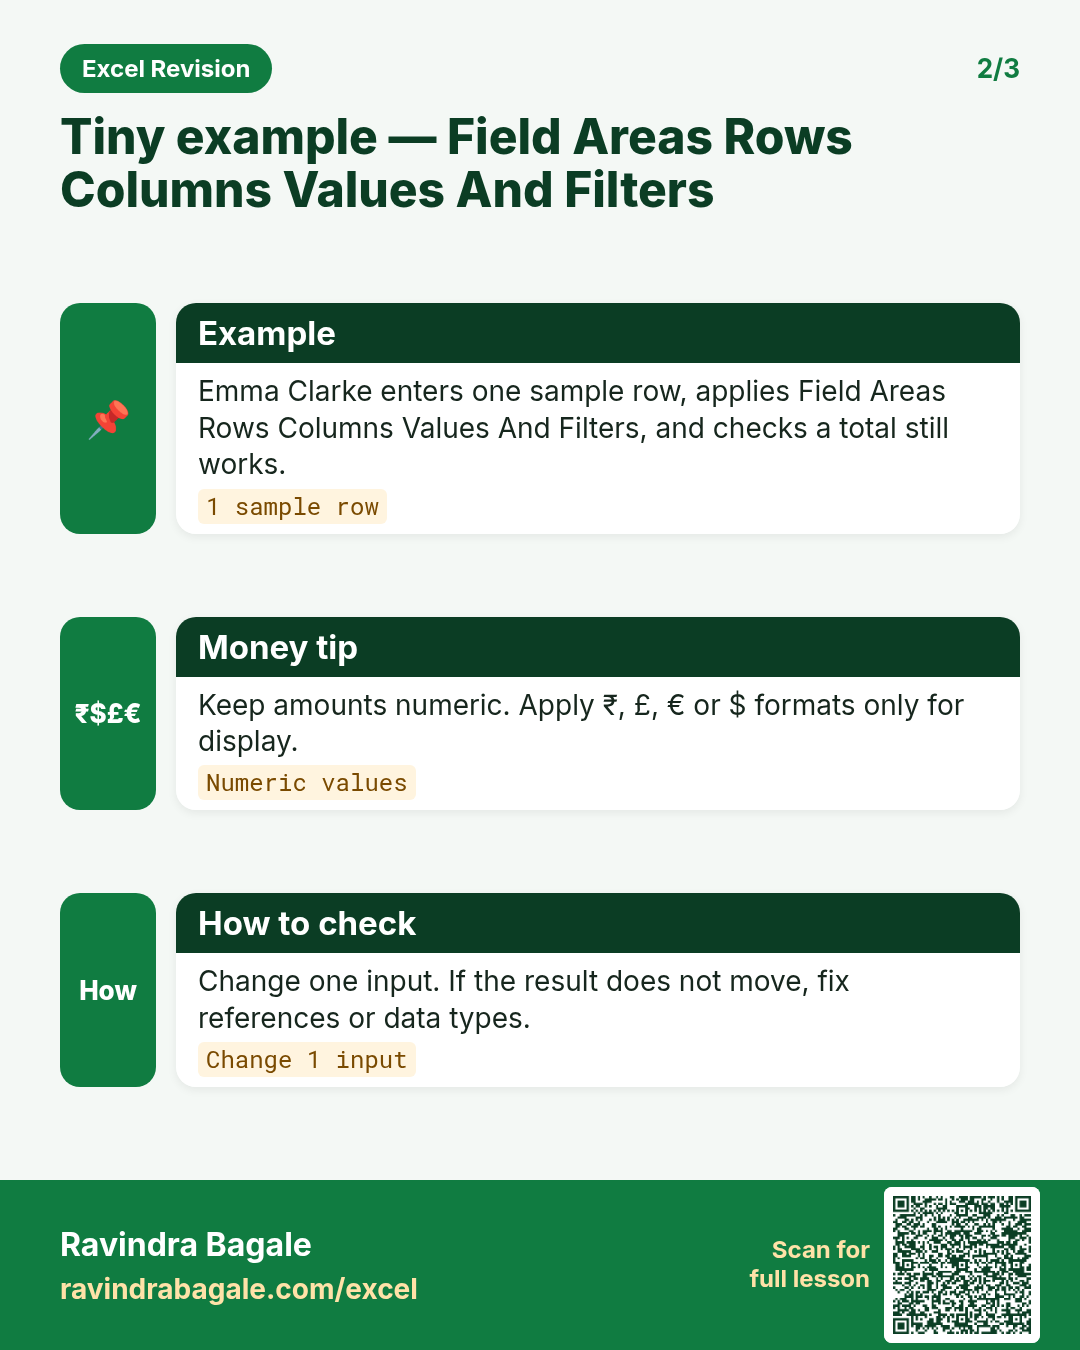
- Open a blank sheet. In A1 type a short label for field areas rows columns values and filters.
- Enter a small made-up value for Aamir Khan using ₹ where money appears.
- Add a second value for Emma Clarke using £ so you see mixed currencies stay numeric.
- Apply the method from this lesson step by step (menu or formula as shown above).
- Check the result still works inside SUM or a simple check cell.
Formula / action
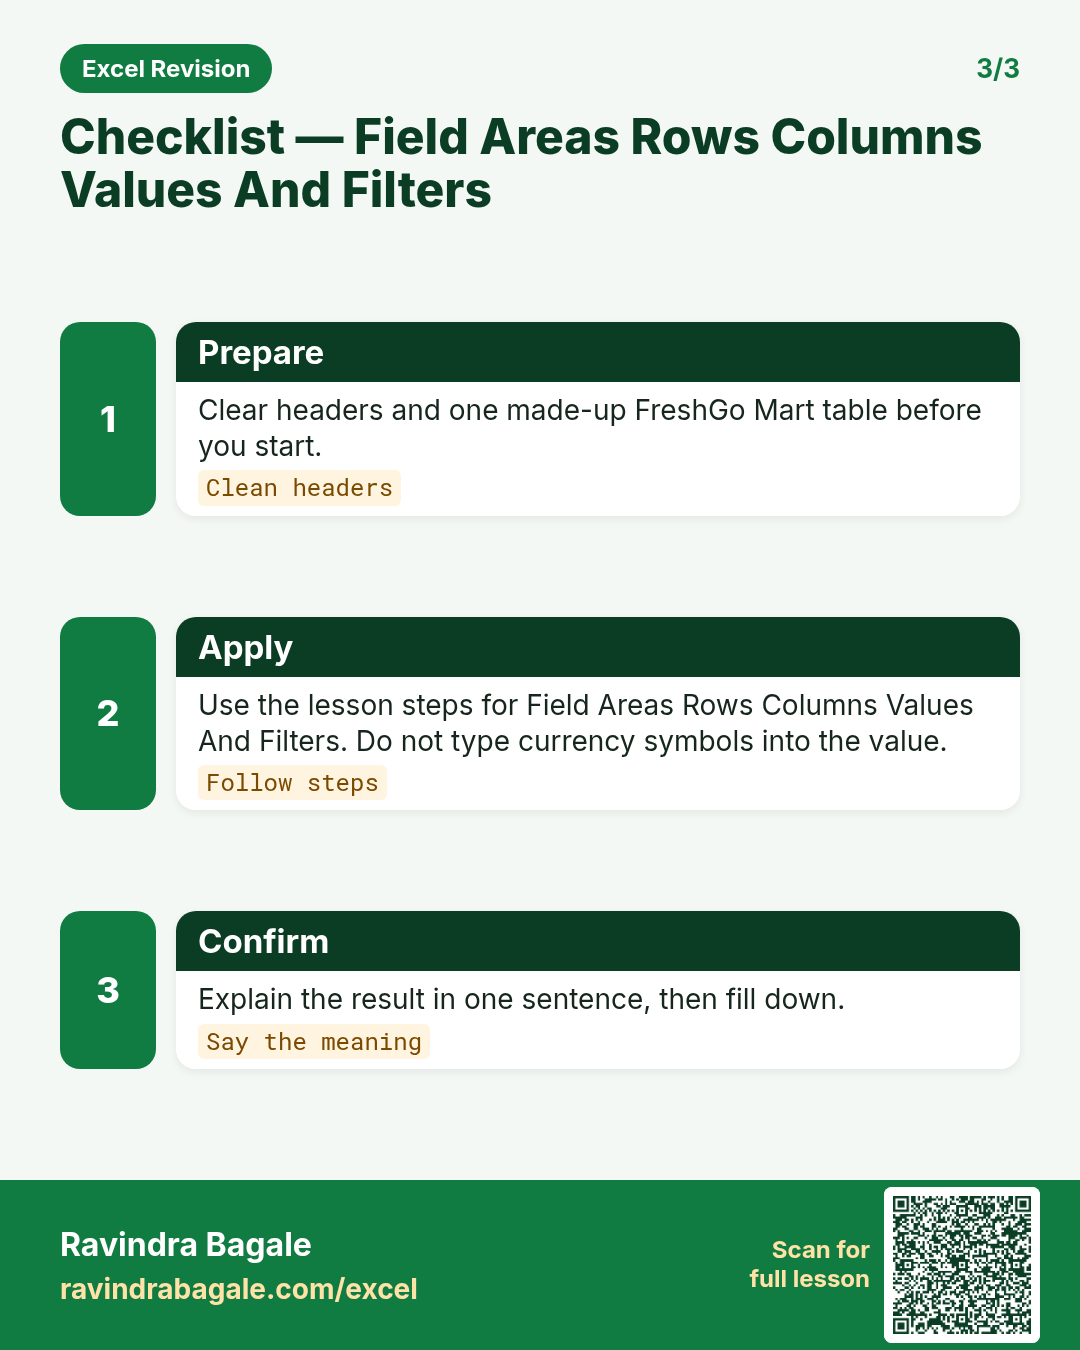
Follow the formula or ribbon steps shown in this lesson (keep values numeric).Meaning: Once field areas rows columns values and filters is correct on one row, copy the same pattern down the column.
Quick revision cards
Three standalone cards. Each one explains the idea with its own example. Scan the QR to open this lesson.