18. Interview Questions Asked in MNC Interviews
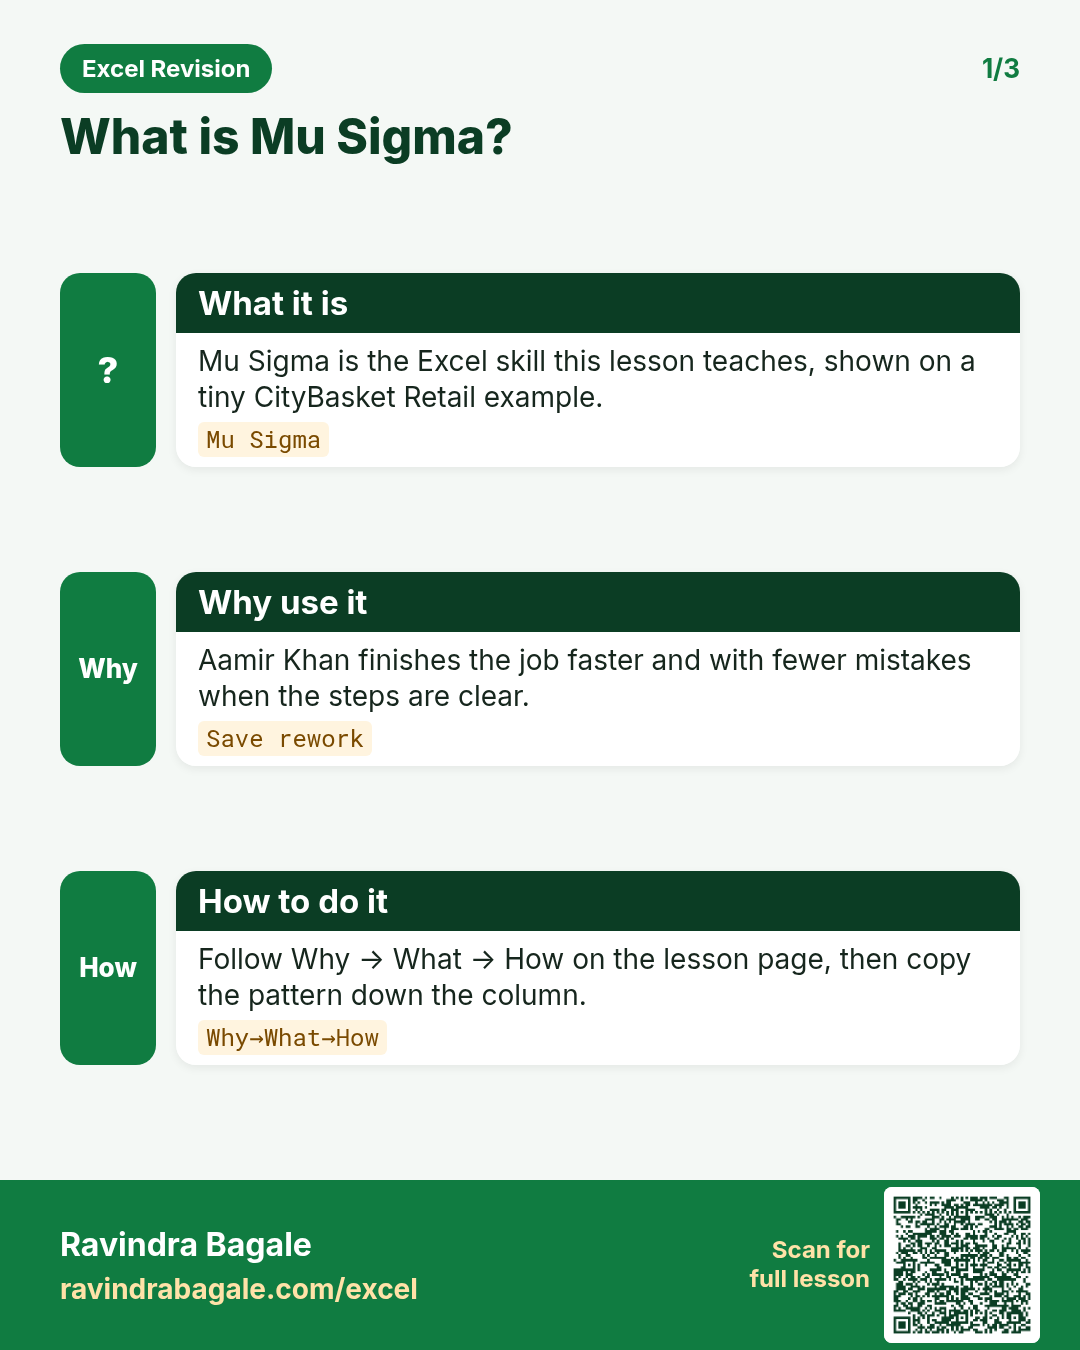
18.6 Mu Sigma
M38. Write a formula to mark students Pass or Fail based on marks and attendance.
Reported for: Mu Sigma [S7] · also MathCo [S15]
=IF(AND(B2>=40,C2>=75%),"Pass","Fail") where B = Marks and C = Attendance %. With OR for "either" conditions: =IF(OR(B2<40,C2<75%),"Fail","Pass"). Keep thresholds in input cells for flexibility.
M39. How would you calculate a running total?
Reported for: Mu Sigma [S7] · also Amazon [S8]
=SUM($G$2:G2) copied down (expanding range). In a Table: =SUM(INDEX([Amount],1):[@Amount]). In a pivot: Show Values As › Running Total In › Order Date. Plot it as a line chart to show cumulative sales through the month.
M40. Explain advanced filters and sorting for segmentation.
Reported for: Mu Sigma [S7]
Multi-level sort (Data › Sort › Add Level: City then Amount descending) and custom-list sorts. Advanced Filter (Data › Sort & Filter › Advanced) uses a criteria range: conditions on the same row are AND, on different rows are OR – e.g. Pune & Delivered or Nagpur & Delivered – and can copy results to another location or extract unique records.
M41. Which advanced PivotTable features have you used?
Reported for: Mu Sigma [S7]
Show Values As (% of total, % difference, running total, rank), date and number grouping, calculated fields, Top-N value filters, slicers and timelines with report connections, Distinct Count through the Data Model, GETPIVOTDATA for dashboards, Show Report Filter Pages, and PivotCharts.
M42. Highlight regions where sales dropped by more than 10%.
Reported for: Mu Sigma [S7]
With last month in C and this month in D: select the rows › Conditional Formatting › New Rule › Use a formula › =$D2<$C2*0.9 › red fill. If a growth column exists, =$E2<-10% does the same.
M43. What are wildcards and how are they used?
Reported for: Mu Sigma [S7]
* matches any number of characters, ? one character, and ~ escapes them. Examples: =COUNTIF(A:A,"BLK-*") counts FreshGo orders; =SUMIFS(G:G,E:E,"*Milk*") sums all milk products; ? in "BLK-26031?" matches one digit. Wildcards also work in Find & Replace, filters, XLOOKUP (match mode 2) and MATCH.
M44. How do you check for inconsistencies between two columns?
Reported for: Mu Sigma [S7]
Row-wise: =A2=B2 or =EXACT(A2,B2) (case-sensitive), or Home › Find & Select › Go To Special › Row differences. Across lists: =COUNTIF(B:B,A2)=0 for missing items, conditional formatting of unique values, or a Power Query anti-join. Clean with TRIM first to avoid false mismatches.
M45. How do you protect a sheet or workbook to prevent accidental changes?
Reported for: Mu Sigma [S7]
Unlock input cells (Ctrl + 1 › Protection › untick Locked), then Review › Protect › Protect Sheet and choose allowed actions. Protect Workbook locks the structure (sheets can't be added, deleted or unhidden). For confidentiality use File › Info › Protect Workbook › Encrypt with Password. (Module 14.)
M46. How do you split text into columns, and what are Text to Columns and Flash Fill used for?
Reported for: Mu Sigma [S7] · also MathCo [S15]
Data › Data Tools › Text to Columns splits by a delimiter or fixed width and can also convert text dates (choose DMY). Flash Fill (Ctrl + E) fills a column from examples, e.g. first names from full names. Formulas (LEFT/MID/FIND, or TEXTSPLIT in Microsoft 365) keep the result live when the source changes.
M47. How would you transpose data from rows to columns?
Reported for: Mu Sigma [S7]
Copy › right-click › Paste Special › Transpose (static), =TRANSPOSE(A1:F2) (spills in Microsoft 365; live), or Power Query › Transform › Transpose. To turn month columns into rows for analysis, use Unpivot in Power Query instead.
M48. Show month-over-month growth for each region.
Reported for: Mu Sigma [S7] · also MathCo [S15]
Pivot: Region in Rows, Order Date grouped by Month in Columns, Sales in Values shown as % Difference From › Base field Month › (previous). With formulas: a Region × Month SUMIFS grid and =IFERROR(C2/B2-1,"") for each month.
M49. How do you create a dynamic chart that updates when data changes?
Reported for: Mu Sigma [S7]
Base the chart on a Table (new rows appear automatically), on a PivotTable with slicers, on dynamic named ranges (INDEX/OFFSET), or on a helper range driven by a drop-down selection with XLOOKUP. (Modules 8.13–8.15.)
Ravindra Bagale's Tip
The Mu Sigma list has many practical tasks – running total, wildcards, dynamic chart. Many students read them and think "I know this", but have never actually done them in Excel. Do each task yourself in Excel once; your hands shouldn't freeze in a live test.
Ravindra Bagale's Tip – मराठी
Mu Sigma च्या list मध्ये खूप practical tasks आहेत – running total, wildcards, dynamic chart. बरेच students हे वाचून "येतं" समजतात पण Excel मध्ये कधी केलेले नसतात. प्रत्येक task एकदा स्वतः Excel मध्ये करून बघा; live test मध्ये हात थांबला नाही पाहिजे.
Ravindra Bagale's Tip – हिंदी
Mu Sigma की list में बहुत से practical tasks हैं – running total, wildcards, dynamic chart. बहुत से students इन्हें पढ़कर "आता है" मान लेते हैं पर Excel में कभी किया नहीं होता. हर task एक बार खुद Excel में करके देखो; live test में हाथ रुकना नहीं चाहिए.
Loading practice tasks...
- Total billable hours (Easy): Add up Billable hours in the "Billable hours" column.
- Average rate per hour (Easy): Average of the Rate per hour ($) column, rounded to 2 decimals.
- Rows in Cloud (Easy): How many rows have Practice "Cloud"?
- Largest billable hours (Easy): The largest value in the "Billable hours" column.
- Billable hours for Cloud (Medium): Total of the Billable hours column where Practice is "Cloud".
- Cloud in Denver (Medium): Total of the Billable hours column where Practice is "Cloud" and City is "Denver".
- Best in Cloud (Medium): Largest value in the "Rate per hour ($)" column where "Practice" is "Cloud".
- Value of row 2 (Medium): Multiply the first-row Billable hours by the first-row Rate per hour ($).
- Look up Noah Wilson (Medium): The Billable hours for "Noah Wilson" (use a lookup on the "Name" column).
- Total value (Hard): Sum of "Billable hours" times "Rate per hour ($)" for all rows.
- Share of Cloud (Hard): Share of the "Billable hours" column that is "Cloud", rounded to 3 decimals.
- How many rows are above the average "Rate per hour ($)" (Hard): Count the rows where "Rate per hour ($)" is above the average "Rate per hour ($)".
- Above average? (Hard): "Above" if the "Rate per hour ($)" value in the first row is above the average of the "Rate per hour ($)" column, else "Below".
Worked example — mu sigma
Why
Neha Shah in Pune and Sophie Martin abroad both need a clear, repeatable way to use mu sigma on a Skyline Clinics sheet without breaking totals.
What
Mu Sigma is the Excel idea this page teaches. We will walk one tiny example end to end.
How
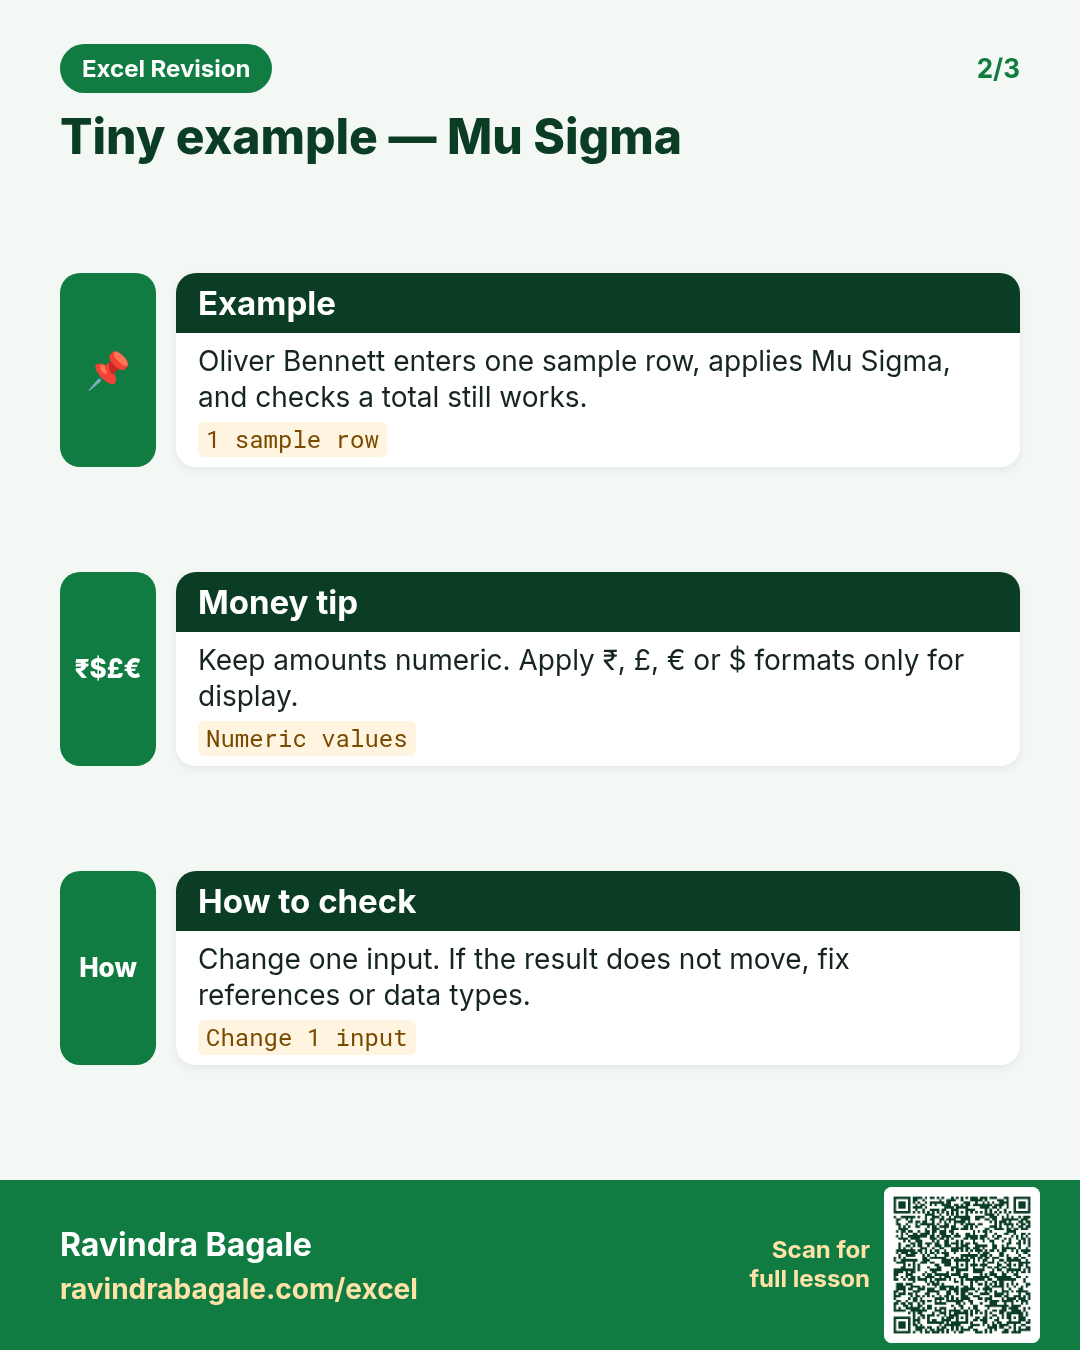
- Open a blank sheet. In A1 type a short label for mu sigma.
- Enter a small made-up value for Neha Shah using $ where money appears.
- Add a second value for Sophie Martin using £ so you see mixed currencies stay numeric.
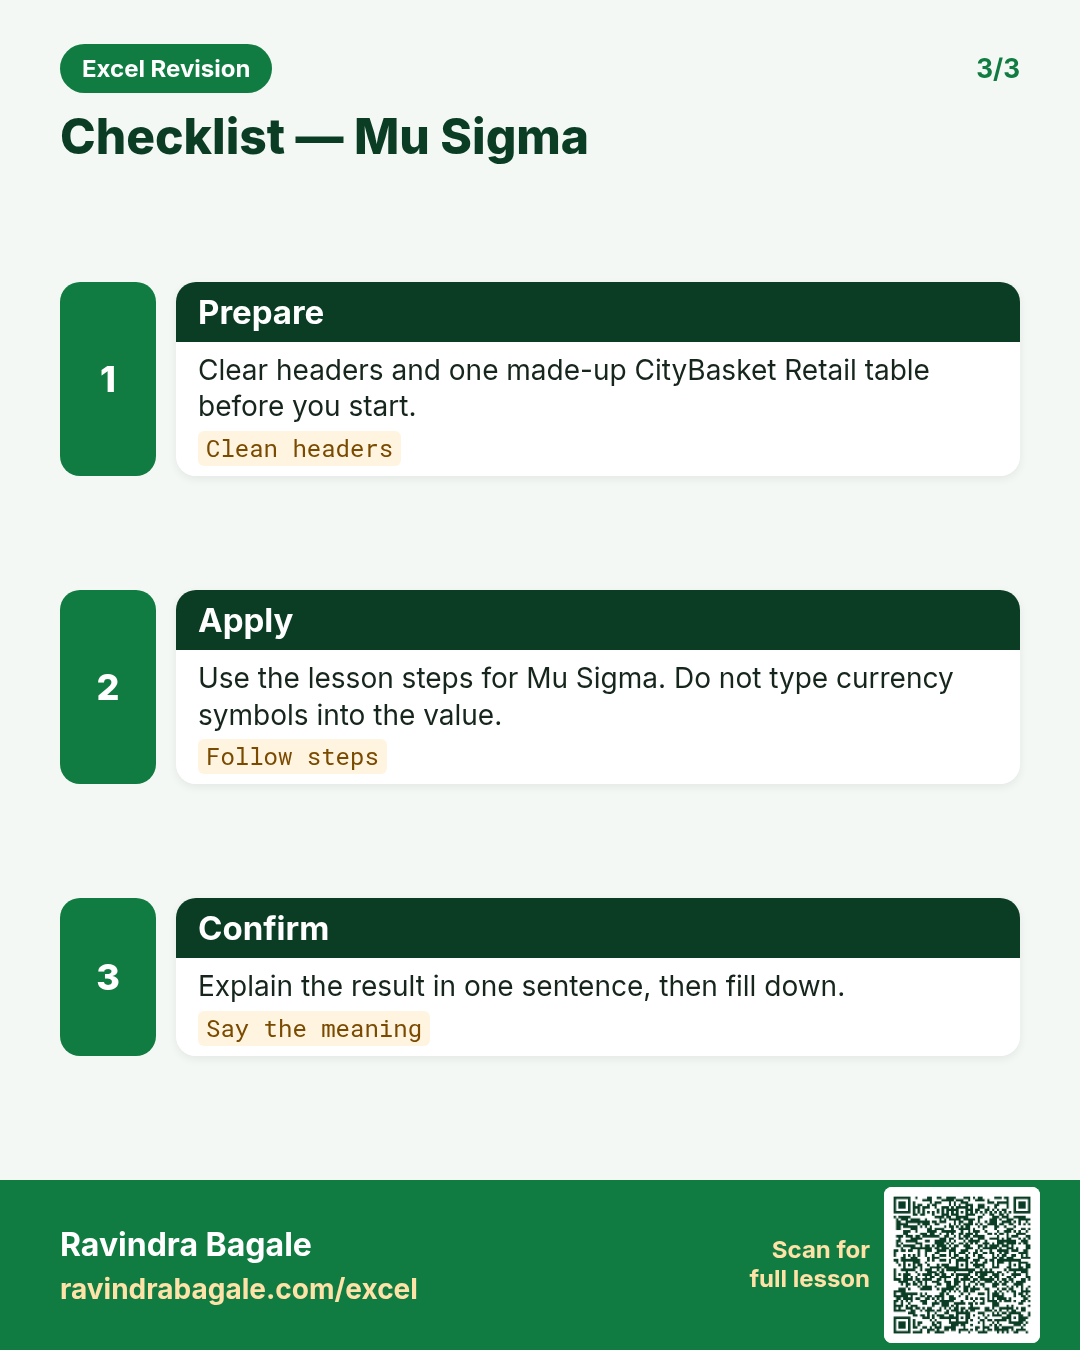
- Apply the method from this lesson step by step (menu or formula as shown above).
- Check the result still works inside SUM or a simple check cell.
Formula / action
Follow the formula or ribbon steps shown in this lesson (keep values numeric).Meaning: Once mu sigma is correct on one row, copy the same pattern down the column.
Quick revision cards
Three standalone cards. Each one explains the idea with its own example. Scan the QR to open this lesson.