18. Interview Questions Asked in MNC Interviews
18.10 MathCo and FedEx India
M67. What is the difference between VLOOKUP and HLOOKUP, and their limitations?
Reported for: MathCo [S15]
VLOOKUP searches vertically in the first column of a range; HLOOKUP searches horizontally in the first row (e.g. months across the top). Both share the same limitations: they can't look left/up, use a hard-coded index number, default to approximate match and return only the first match. XLOOKUP or INDEX-MATCH replace both.
M68. Build a pivot of total sales by month and region, with each region's % contribution per month. Some dates are mm/dd/yyyy and some dd-mm-yyyy – how do you standardise?
Reported for: MathCo [S15]
First standardise dates: find text dates with ISNUMBER, convert US-style text with DATE(RIGHT(A2,4),LEFT(A2,2),MID(A2,4,2)) and dd-mm-yyyy text with DATE(RIGHT(A2,4),MID(A2,4,2),LEFT(A2,2)), or use Power Query › Change Type › Using Locale. Then pivot: Order Date grouped by Months in Rows, Region in Columns, Sales in Values shown as % of Row Total – each month row sums to 100%.
M69. Find the top 3 products by revenue in each region and compute month-over-month growth.
Reported for: MathCo [S15]
Pivot with Region then Product in Rows, Sum of Revenue, and Value Filters › Top 10 › 3 Items on Product (applies within each region). For MoM, add Month to Columns and a second Revenue field shown as % Difference From previous month. In Microsoft 365, TAKE(SORT(FILTER(...),2,-1),3) per region gives the same list with formulas.
M70. A dataset has repeated customer IDs, missing fields and outliers in order amounts. How do you prepare it?
Reported for: MathCo [S15]
Decide whether repeated IDs are true duplicates (same order repeated) or legitimate repeat purchases – remove only exact duplicate orders. Profile missing fields and handle them by business meaning (flag, "Unknown", fill down). Flag outliers with IQR, verify them, and decide to keep, cap or exclude them in a documented way. Reconcile row counts and totals at the end.
M71. Design an Excel dashboard for product metrics such as DAU, churn rate, revenue and AOV. How would you refresh it and ensure correctness?
Reported for: MathCo [S15]
Data sheets fed by Power Query (refreshable); a Calc sheet with clear KPI definitions – DAU = distinct active users per day, churn = users lost ÷ users at start of period, AOV = revenue ÷ orders; KPI cards with comparison vs previous period; line charts for DAU and revenue trend, bar for churn by segment; slicers for date and segment. Ensure correctness with cross-check formulas and reconciliation to source totals; refresh with Refresh All; document definitions.
M72. How do you extract part of a string, such as the city from "City-Zip"?
Reported for: MathCo [S15]
=LEFT(A2,FIND("-",A2)-1) returns "Pune" from "Pune-411038"; =TEXTBEFORE(A2,"-") in Microsoft 365; or Text to Columns / Flash Fill / Power Query Split Column by delimiter.
M73. Explain SUMIFS/COUNTIFS, OFFSET and INDIRECT.
Reported for: MathCo [S15]
SUMIFS/COUNTIFS sum or count with multiple AND conditions. OFFSET returns a range shifted from a start cell by rows/columns with a given size – useful for rolling windows but volatile. INDIRECT converts text into a reference, e.g. =SUM(INDIRECT("'"&B1&"'!G:G")) sums column G of the sheet named in B1 – flexible but volatile and it breaks silently if sheets are renamed, so use sparingly.
M74. When do you use a line chart and when a pie chart?
Reported for: FedEx India [S16]
A line chart shows how a value changes over an ordered sequence, usually time – daily sales through Ganeshotsav. A pie chart shows parts of one whole at one point in time and works only with a few categories (ideally 2–5) that add up to 100% – FreshGo vs MarketRush share of orders. Never use a pie for trends or for many small categories.
Ravindra Bagale's Tip
In analytics companies like MathCo, questions are big and multi-step (standardise dates + pivot + % contribution). Many students jump straight to the final answer. Break the question into small steps, say each step out loud, and then do it in Excel.
Ravindra Bagale's Tip – मराठी
MathCo सारख्या analytics companies मध्ये प्रश्न मोठे आणि multi-step असतात (date standardise + pivot + % contribution). बरेच students एकदम शेवटच्या उत्तरावर उडी मारतात. प्रश्न छोट्या steps मध्ये तोडा, प्रत्येक step मोठ्याने सांगा आणि मग Excel मध्ये करा.
Ravindra Bagale's Tip – हिंदी
MathCo जैसी analytics companies में सवाल बड़े और multi-step होते हैं (date standardise + pivot + % contribution). बहुत से students सीधे आख़िरी जवाब पर कूद जाते हैं. सवाल को छोटे steps में तोड़ो, हर step ज़ोर से बोलो और फिर Excel में करो.
Loading practice tasks...
- Total stock units (Easy): Add up Stock units in the "Stock units" column.
- Average unit cost (Easy): Average of the Unit cost (€) column, rounded to 2 decimals.
- Rows in Antibiotic (Easy): How many rows have Category "Antibiotic"?
- Largest stock units (Easy): The largest value in the "Stock units" column.
- Stock units for Antibiotic (Medium): Total of the Stock units column where Category is "Antibiotic".
- Antibiotic in Dublin (Medium): Total of the Stock units column where Category is "Antibiotic" and City is "Dublin".
- Best in Antibiotic (Medium): Largest value in the "Unit cost (€)" column where "Category" is "Antibiotic".
- Value of row 2 (Medium): Multiply the first-row Stock units by the first-row Unit cost (€).
- Look up James Carter (Medium): The Stock units for "James Carter" (use a lookup on the "Name" column).
- Total value (Hard): Sum of "Stock units" times "Unit cost (€)" for all rows.
- Share of Antibiotic (Hard): Share of the "Stock units" column that is "Antibiotic", rounded to 3 decimals.
- How many rows are above the average "Unit cost (€)" (Hard): Count the rows where "Unit cost (€)" is above the average "Unit cost (€)".
- Above average? (Hard): "Above" if the "Unit cost (€)" value in the first row is above the average of the "Unit cost (€)" column, else "Below".
Worked example — mathco and fedex india
Why
Vikram Rao in Pune and Oliver Bennett abroad both need a clear, repeatable way to use mathco and fedex india on a GreenField Dairy sheet without breaking totals.
What
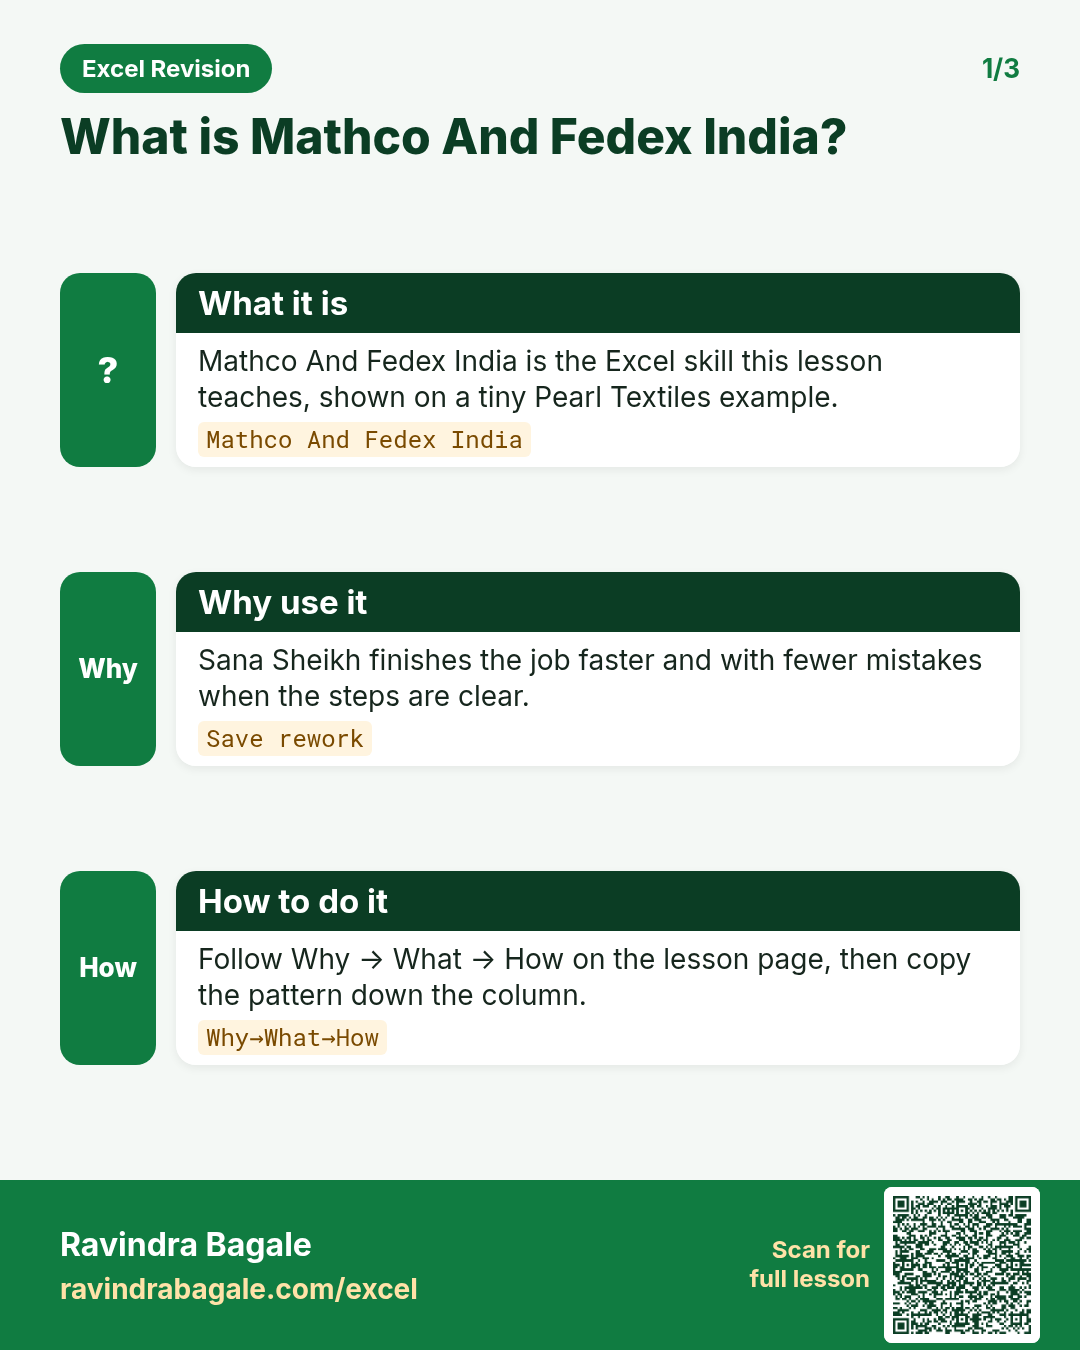
Mathco And Fedex India is the Excel idea this page teaches. We will walk one tiny example end to end.
How
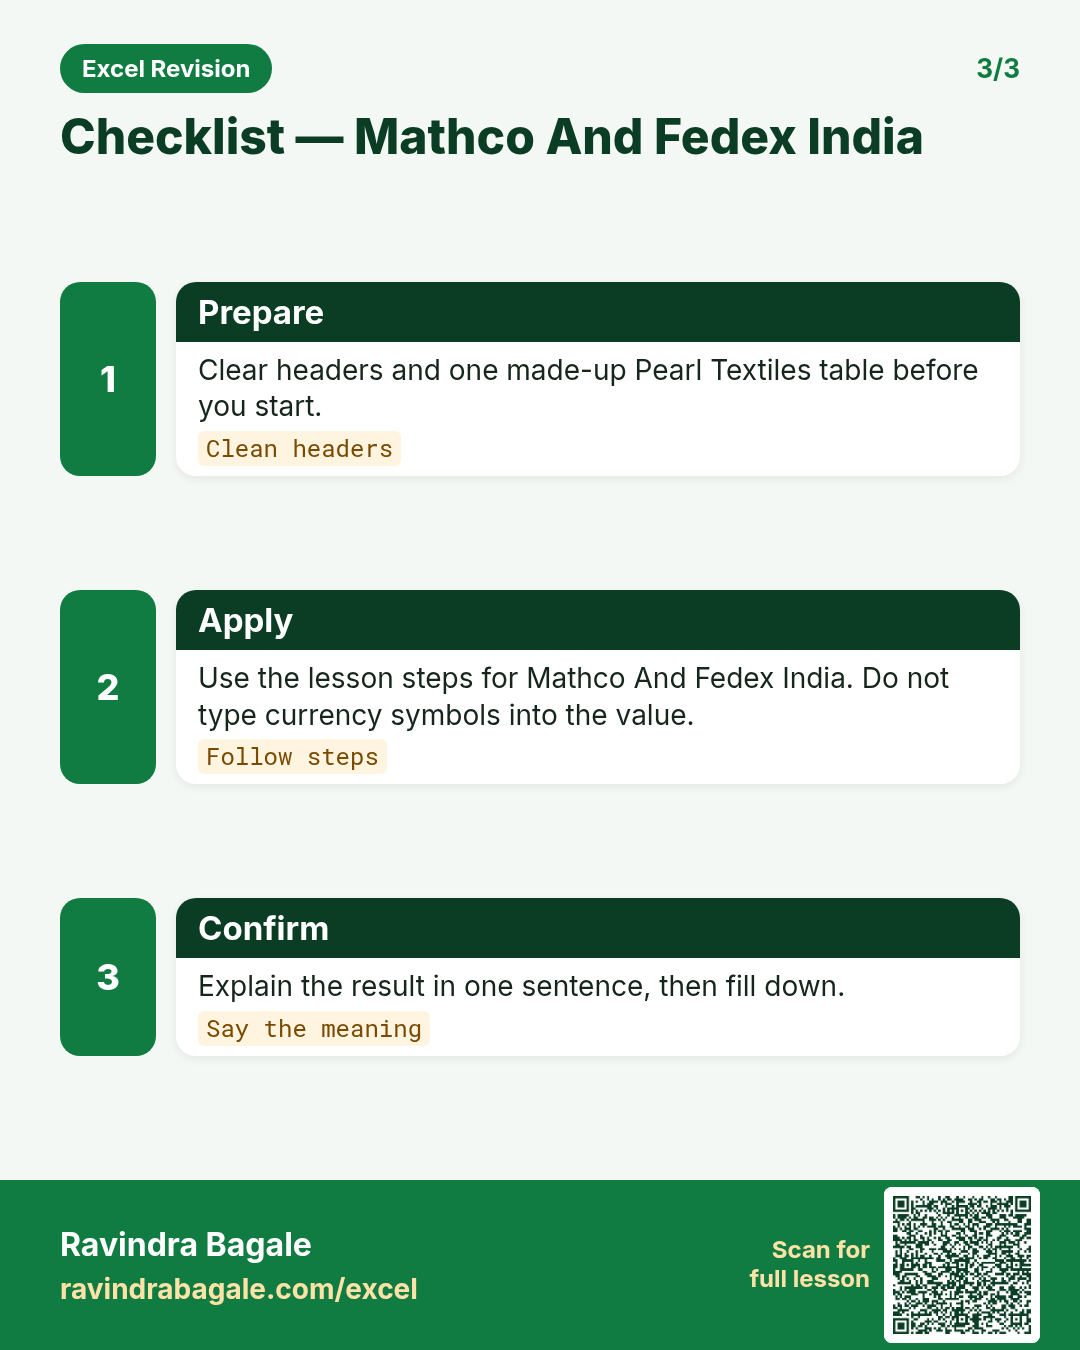
- Open a blank sheet. In A1 type a short label for mathco and fedex india.
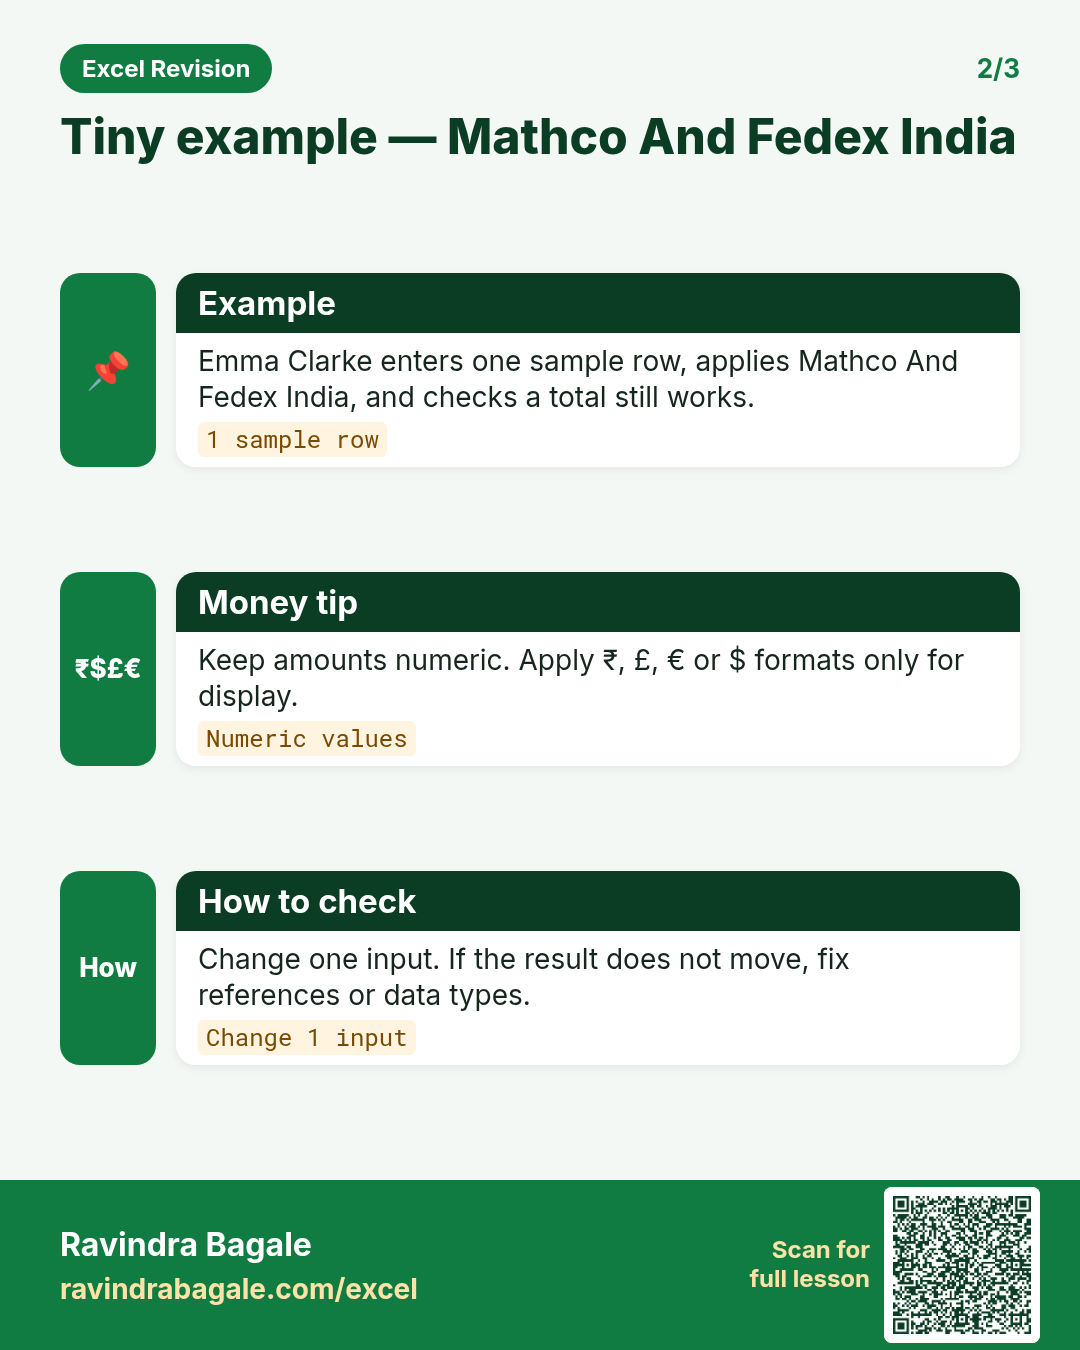
- Enter a small made-up value for Vikram Rao using ₹ where money appears.
- Add a second value for Oliver Bennett using ₹ so you see mixed currencies stay numeric.
- Apply the method from this lesson step by step (menu or formula as shown above).
- Check the result still works inside SUM or a simple check cell.
Formula / action
Follow the formula or ribbon steps shown in this lesson (keep values numeric).Meaning: Once mathco and fedex india is correct on one row, copy the same pattern down the column.
Quick revision cards
Three standalone cards. Each one explains the idea with its own example. Scan the QR to open this lesson.