16. Practice Exercises with Answer Hints
16.10 Module 11: What-If Analysis
- With Goal Seek, find the orders per day needed to break even in the Wakad model. Hint: Data › Forecast › What-If Analysis › Goal Seek; Set cell = Profit, To value 0 → about 507 orders/day.
- Create three scenarios (Normal, Ganeshotsav, Monsoon) and a summary report. Hint: Scenario Manager › Add › Summary.
- A one-variable data table of profit for AOV ₹300–₹450. Hint: What-If Analysis › Data Table › Column input cell = AOV cell.
- A two-variable data table: AOV × orders/day. Hint: formula in the top-left corner; Row and Column input cells.
- Use Solver to find the milk and fruit crates that maximise profit within the van capacity. Hint: File › Options › Add-ins › Solver Add-in; Data › Analyze › Solver → 35 milk + 25 fruit = ₹12,800.
Ravindra Bagale's Tip
Many students swap the Data Table input cells (a column's cell in the row input) and all the answers come out the same. If the values run down (a column), use the Column input cell; if they run across (a row), use the Row input cell. Check one or two answers manually.
Ravindra Bagale's Tip – मराठी
बरेच students Data Table चे input cells उलट देतात (row input मध्ये column चा cell) आणि सगळी उत्तरं same येतात. Values खाली (column) असतील तर Column input cell, आडवी (row) असतील तर Row input cell. एक-दोन उत्तरं हाताने check करा.
Ravindra Bagale's Tip – हिंदी
बहुत से students Data Table के input cells उल्टे दे देते हैं (row input में column का cell) और सारे जवाब same आते हैं. Values नीचे की ओर (column) हों तो Column input cell, आड़ी (row) हों तो Row input cell. एक-दो जवाब हाथ से check करो.
Loading practice tasks...
- Total units (Easy): Add up Units in D2:D11. (sheet "Data")
- Total price list (Easy): Add up Price (£) in C2:C11. (sheet "Data")
- Max price (Easy): Largest Price (£) in C2:C11. (sheet "Data")
- Min unit cost (Easy): Smallest Unit cost (£) in E2:E11. (sheet "Data")
- Pune rows (Easy): How many rows have City "Pune"? (sheet "Data")
- London units (Medium): Total of Units where City is "London". (sheet "Data")
- Price over 10 (Medium): How many products have Price (£) > 10? (sheet "Data")
- Units of UrbanSip tea (Medium): Units for Product "UrbanSip tea". (sheet "Data")
- Mumbai cost (Medium): Unit cost (£) for City "Mumbai". (sheet "Data")
- Revenue proxy (Hard): SUMPRODUCT of Price (£) × Units. (sheet "Data")
- Avg units (Hard): Average of Units in D2:D11, rounded to 1 decimal. (sheet "Data")
- Above avg price? (Hard): "Premium" if C2 > average price else "OK". (sheet "Data")
Worked example — module 11 what if analysis
Why
Vikram Rao in Pune and Yuki Tanaka abroad both need a clear, repeatable way to use module 11 what if analysis on a BrightLedger Finance sheet without breaking totals.
What
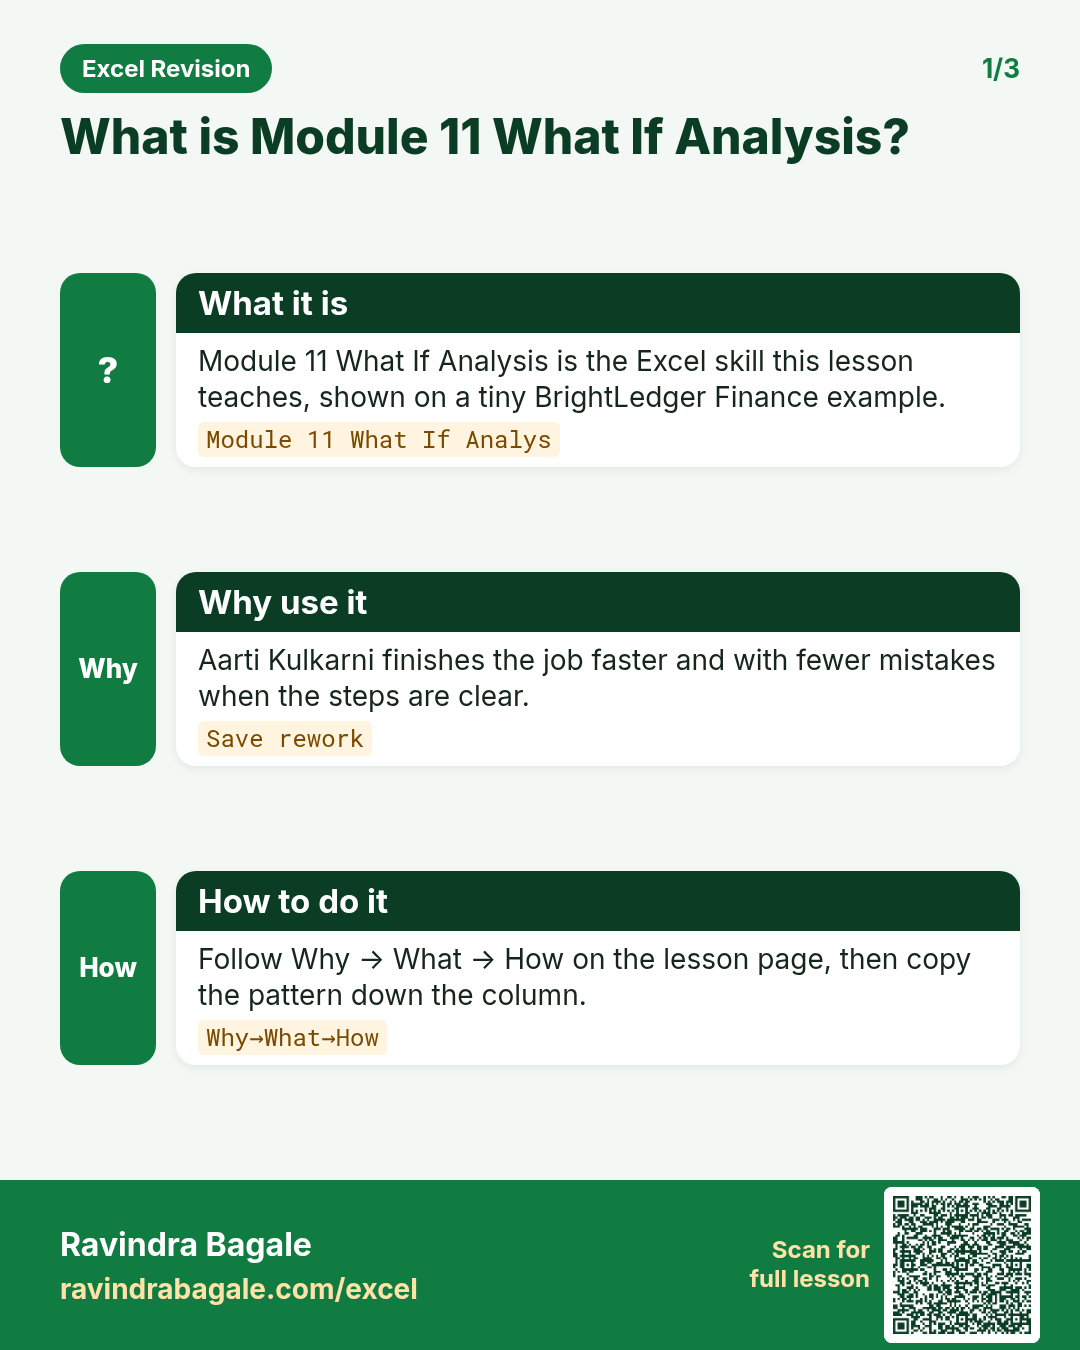
Module 11 What If Analysis is the Excel idea this page teaches. We will walk one tiny example end to end.
How
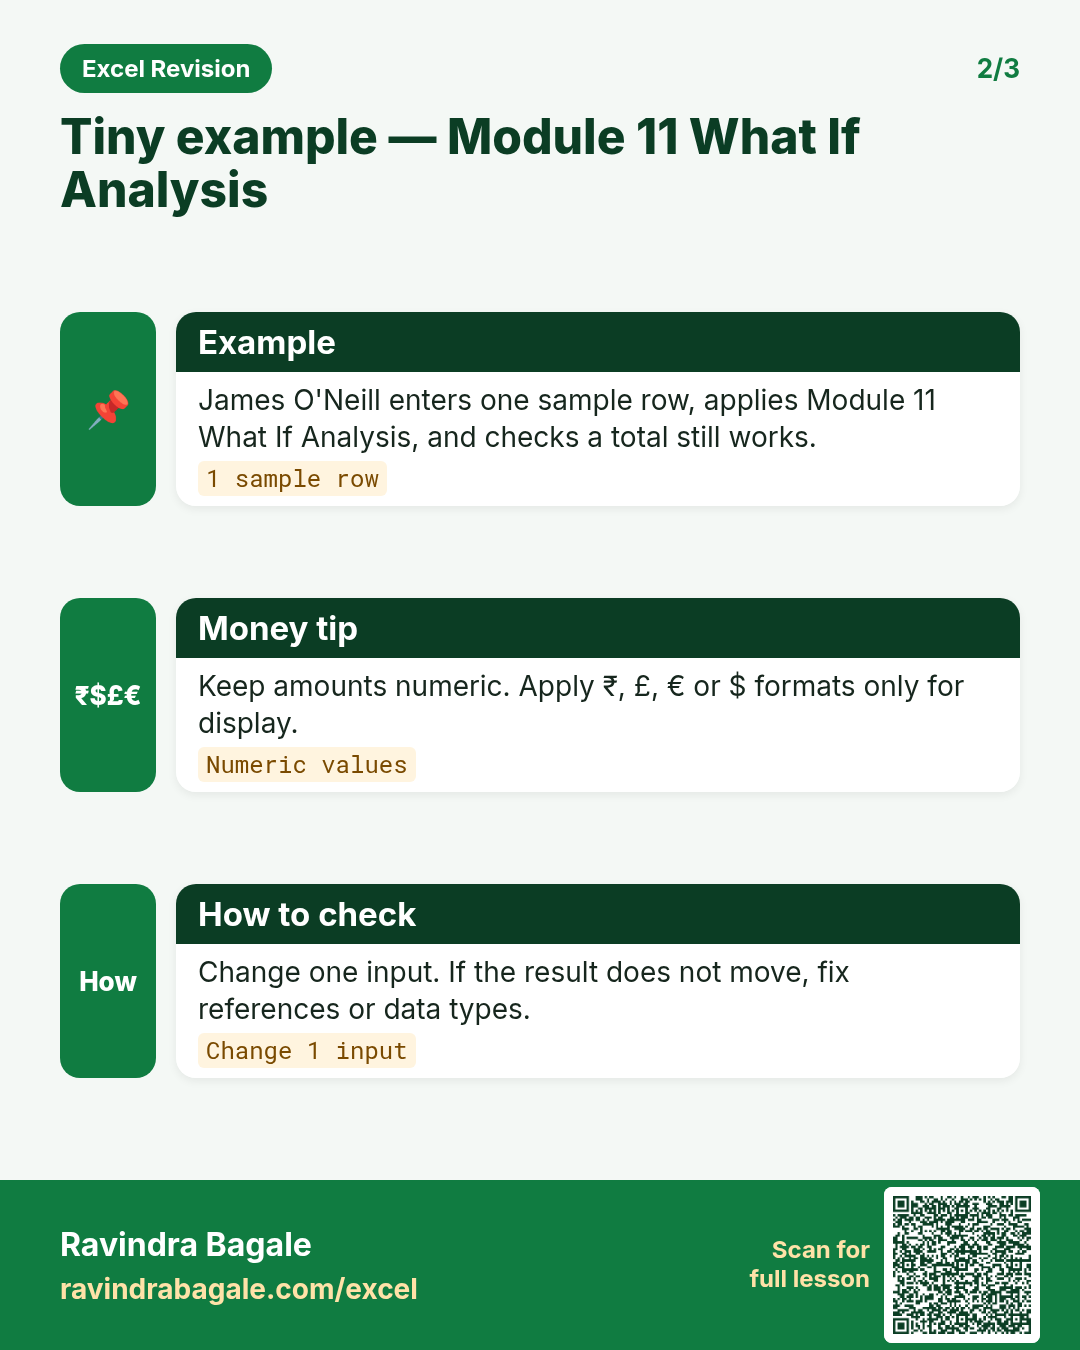
- Open a blank sheet. In A1 type a short label for module 11 what if analysis.
- Enter a small made-up value for Vikram Rao using $ where money appears.
- Add a second value for Yuki Tanaka using € so you see mixed currencies stay numeric.
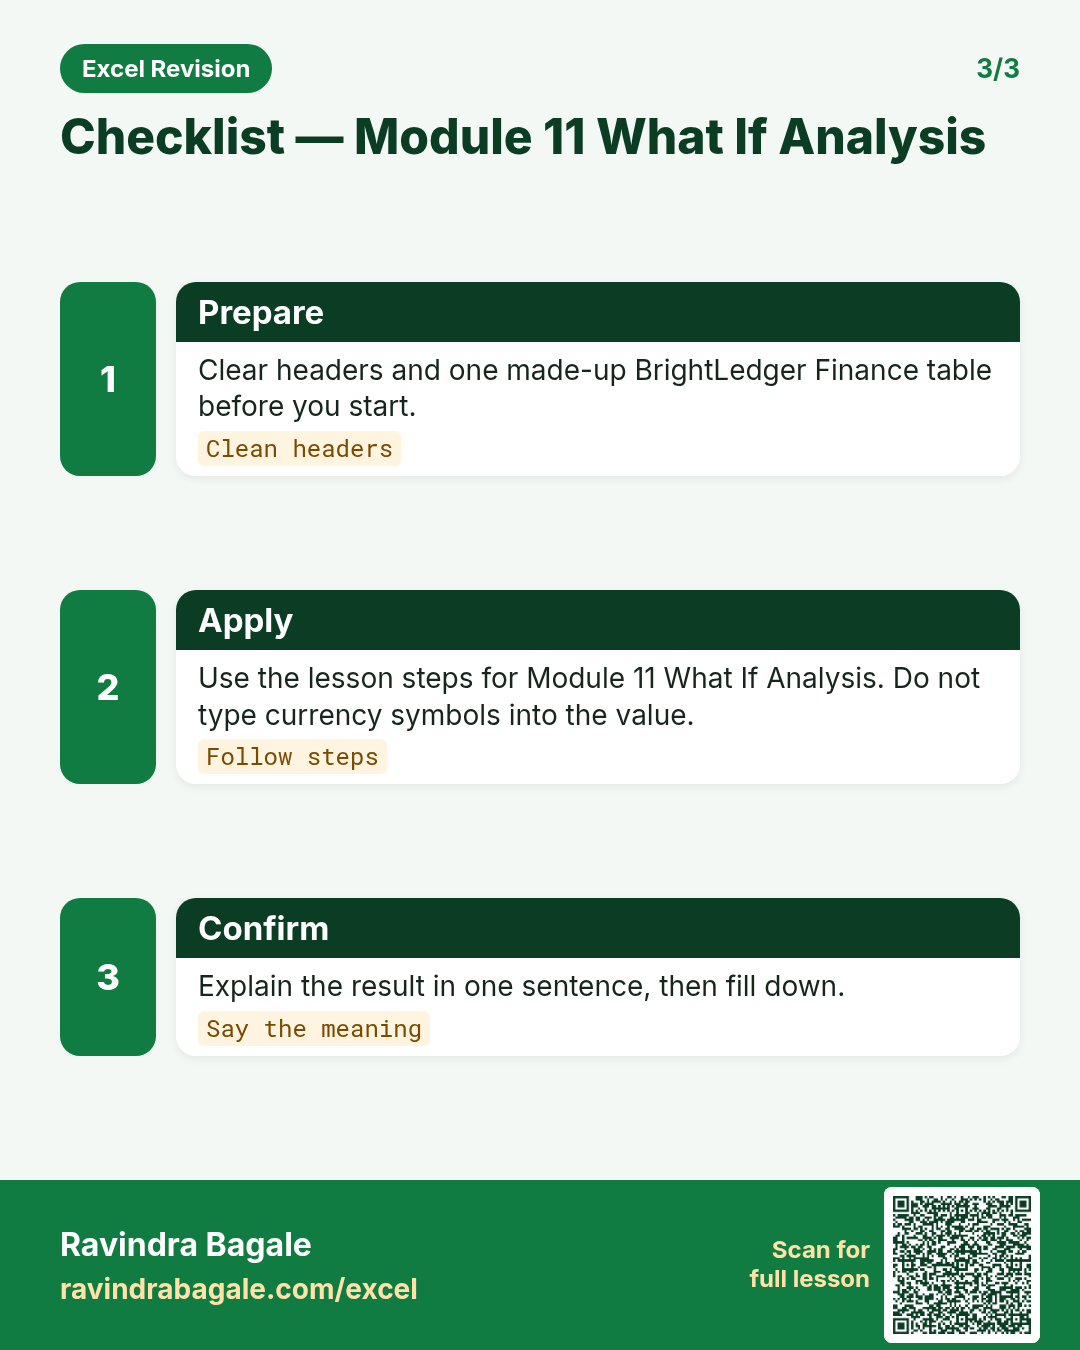
- Apply the method from this lesson step by step (menu or formula as shown above).
- Check the result still works inside SUM or a simple check cell.
Formula / action
Follow the formula or ribbon steps shown in this lesson (keep values numeric).Meaning: Once module 11 what if analysis is correct on one row, copy the same pattern down the column.
Quick revision cards
Three standalone cards. Each one explains the idea with its own example. Scan the QR to open this lesson.