Ravi Sir's Cards › Excel
PivotTable average and Pivot Chart
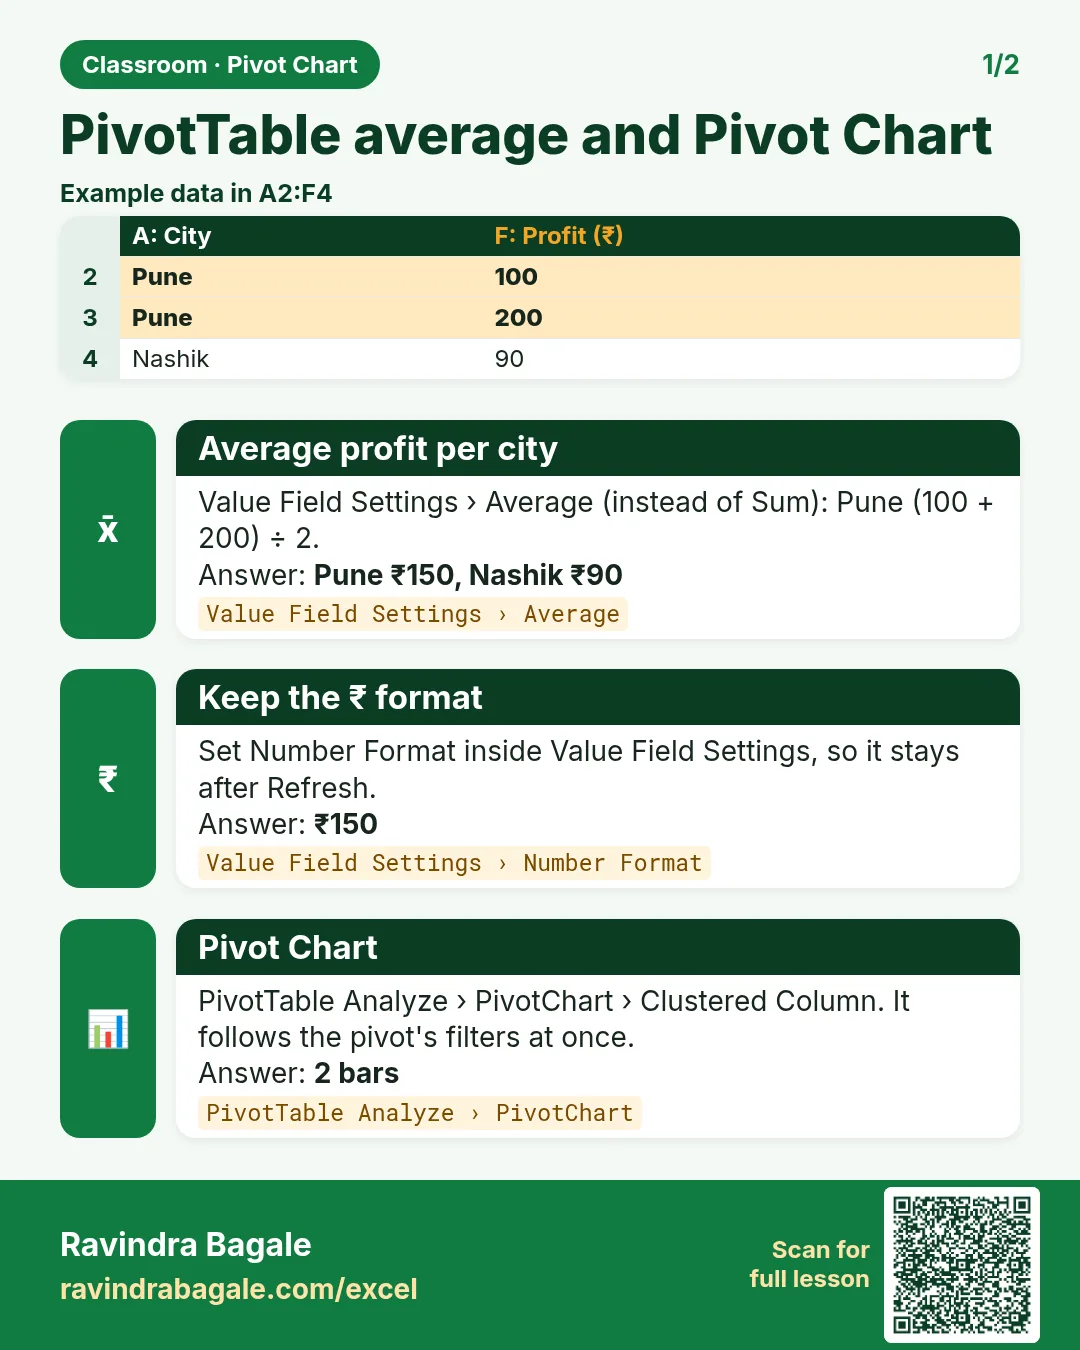
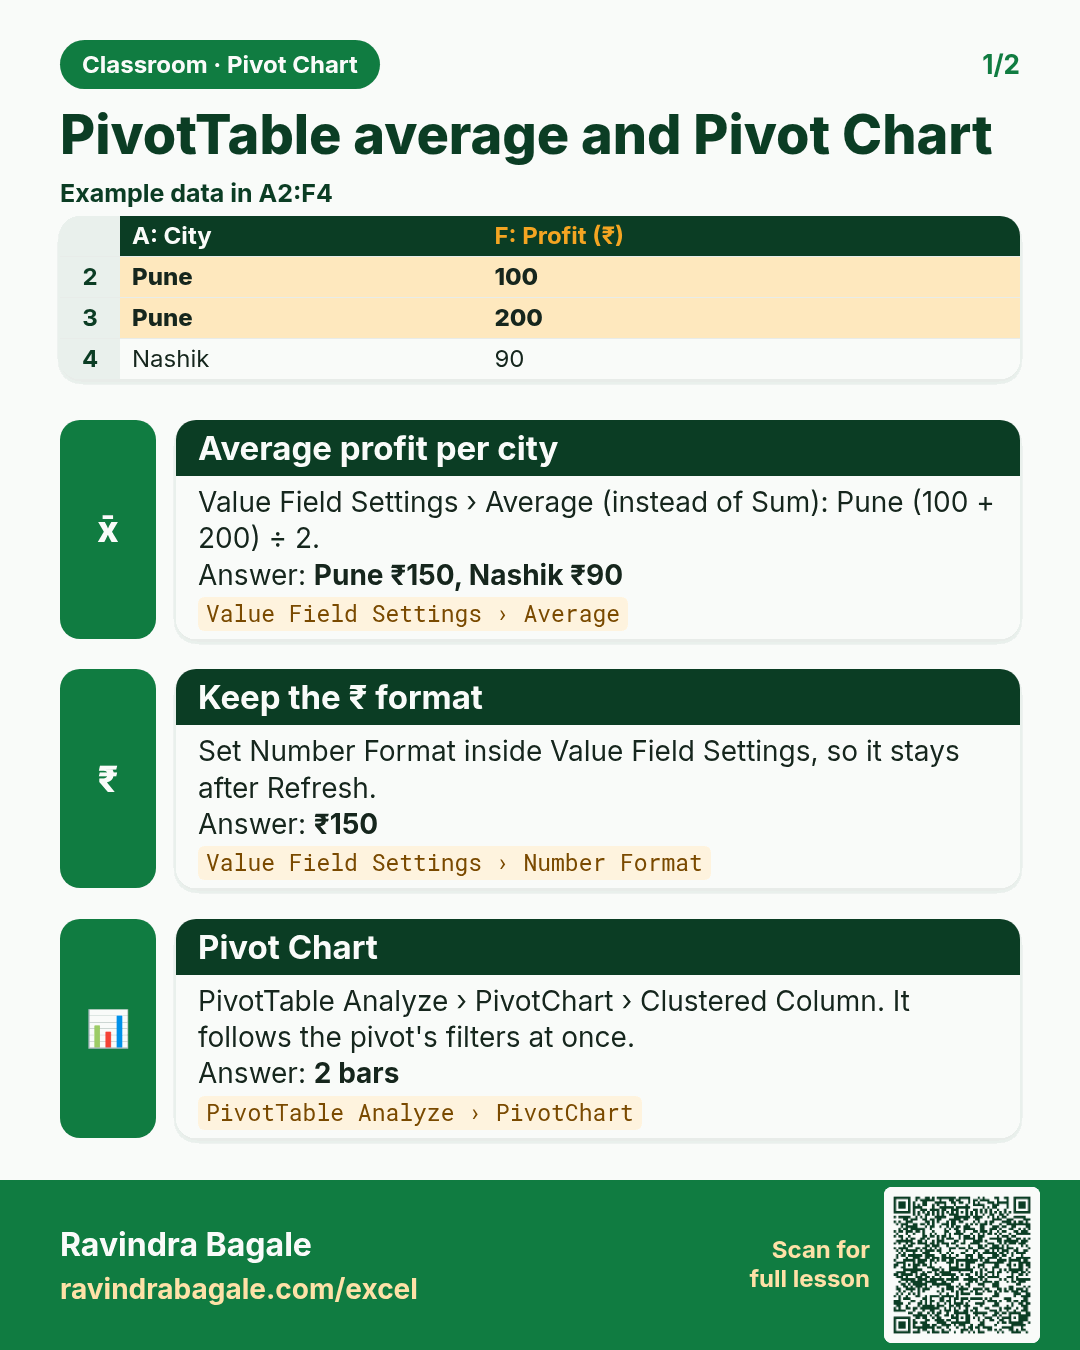
Revision card: PivotTable average and Pivot Chart. Example data table with Average profit per city: Pune ₹150, Nashik ₹90; Keep the ₹ format: ₹150; Pivot Chart: 2 bars.
Read card text
What this card says
PivotTable average and Pivot Chart
Example
data table with Average profit per city: Pune ₹150, Nashik ₹90; Keep the ₹ format: ₹150; Pivot Chart: 2 bars
Learn this in the lesson: Change Sum to Average in an Excel PivotTable and Create a Pivot Chart (Clustered Column) for a Dashboard