13. DAX: Data Analysis Expressions
13.5 Base Measures in Power BI DAX with Example
Quick answer: the short, self-contained version of this lesson is the guide Intermediate DAX Patterns in Power BI.
Base measures in Power BI DAX with example — in 30 seconds
What: Base measures are your first simple measures: Total Sales, Total Orders, Delivered Orders.
Why: Every KPI (AOV, cancel rate) is built on top of them. Fix one base measure and all KPIs stay right.
Tiny example: 4 order lines but only 3 orders. COUNTROWS says 4. DISTINCTCOUNT says 3.
Base measures in Power BI DAX with example — 30 सेकंदात
काय: Base measures म्हणजे तुमचे पहिले साधे measures: Total Sales, Total Orders, Delivered Orders.
का: प्रत्येक KPI (AOV, cancel rate) त्यांच्यावरच उभा असतो. एक base measure बरोबर केला की सगळे KPIs बरोबर राहतात.
छोटं उदाहरण: 4 order lines पण फक्त 3 orders. COUNTROWS 4 म्हणतो. DISTINCTCOUNT 3 म्हणतो.
Base measures in Power BI DAX with example — 30 सेकंड में
क्या: Base measures आपके पहले सादे measures हैं: Total Sales, Total Orders, Delivered Orders.
क्यों: हर KPI (AOV, cancel rate) उन्हीं पर खड़ा होता है. एक base measure ठीक किया तो सारे KPIs ठीक रहते हैं.
छोटा उदाहरण: 4 order lines पर सिर्फ़ 3 orders. COUNTROWS 4 कहता है. DISTINCTCOUNT 3 कहता है.
First look at the data (before → after):
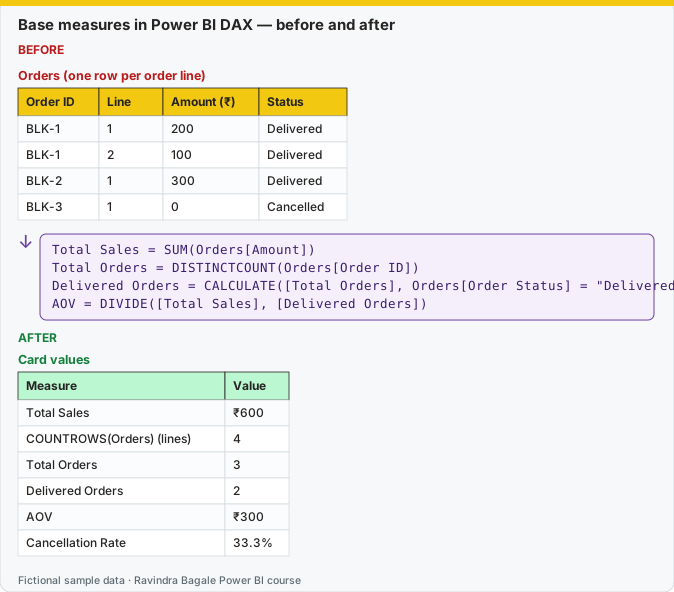
Same before / after tables as text
Before — Orders (one row per order line)
| Order ID | Line | Amount (₹) | Status |
|---|---|---|---|
| BLK-1 | 1 | 200 | Delivered |
| BLK-1 | 2 | 100 | Delivered |
| BLK-2 | 1 | 300 | Delivered |
| BLK-3 | 1 | 0 | Cancelled |
About this data: This table uses columns: Order ID, Line, Amount (₹), Status. This table uses columns: Measure, Value. Values shown are the lesson examples already on this page (not a new dataset).
Formula / click path
Total Sales = SUM(Orders[Amount])
Total Orders = DISTINCTCOUNT(Orders[Order ID])
Delivered Orders = CALCULATE([Total Orders], Orders[Order Status] = "Delivered")
AOV = DIVIDE([Total Sales], [Delivered Orders])
After — Card values
| Measure | Value |
|---|---|
| Total Sales | ₹600 |
| COUNTROWS(Orders) (lines) | 4 |
| Total Orders | 3 |
| Delivered Orders | 2 |
| AOV | ₹300 |
| Cancellation Rate | 33.3% |
Do it step by step:
- Click Home › New measure.
- Type
Total Sales = SUM(Orders[Amount]). Press Enter. Format as ₹. - New measure:
Total Orders = DISTINCTCOUNT(Orders[Order ID]). - New measure: Delivered Orders (formula above).
- New measure:
AOV = DIVIDE([Total Sales], [Delivered Orders]). - Put all of them on cards. Compare with the table above.
एक-एक step करून बघा:
- Home › New measure वर click करा.
Total Sales = SUM(Orders[Amount])type करा. Enter दाबा. ₹ format द्या.- New measure:
Total Orders = DISTINCTCOUNT(Orders[Order ID]). - New measure: Delivered Orders (वरचा formula).
- New measure:
AOV = DIVIDE([Total Sales], [Delivered Orders]). - सगळे cards वर टाका. वरच्या table शी तुलना करा.
एक-एक step करके देखिए:
- Home › New measure पर click कीजिए.
Total Sales = SUM(Orders[Amount])type कीजिए. Enter दबाइए. ₹ format दीजिए.- New measure:
Total Orders = DISTINCTCOUNT(Orders[Order ID]). - New measure: Delivered Orders (ऊपर वाला formula).
- New measure:
AOV = DIVIDE([Total Sales], [Delivered Orders]). - सबको cards पर लगाइए. ऊपर की table से मिलाइए.
Create these first; later measures reuse them. Reusing measures ("measure branching") keeps your model consistent and easy to maintain. Remember the grain (एका ओळीचा नेमका अर्थ) from Module 1.7: one row per order line, and cancelled orders have Amount = 0.
Total Sales = SUM(Orders[Amount])                       -- net value after discount

Total Orders = DISTINCTCOUNT(Orders[Order ID])

Delivered Orders = CALCULATE([Total Orders], Orders[Order Status] = "Delivered")

Cancelled Orders = CALCULATE([Total Orders], Orders[Order Status] = "Cancelled")

Total Quantity = SUM(Orders[Quantity])

Total Discount = SUM(Orders[Discount])

Active Customers = DISTINCTCOUNT(Orders[Customer ID])
Format Total Sales and Total Discount as currency (₹) and ratio measures as percentage in Measure tools › Format.
Quick-commerce KPIs
AOV (Average Order Value) = DIVIDE([Total Sales], [Delivered Orders])

Cancellation Rate = DIVIDE([Cancelled Orders], [Total Orders])

-- Delivery time is an order-level value repeated on every line,
-- so first take one value per order, then average across orders
Avg Delivery Time (mins) =
AVERAGEX(
    VALUES(Orders[Order ID]),
    CALCULATE(MAX(Orders[Delivery Time Mins]))
)

% Orders Delivered Under 10 Mins =
DIVIDE(
    CALCULATE([Delivered Orders], Orders[Delivery Time Mins] <= 10),
    [Delivered Orders]
)

Orders per Dark Store =
DIVIDE([Total Orders], DISTINCTCOUNT(Orders[Store ID]))

Repeat Customer % =
DIVIDE(
    COUNTROWS(FILTER(VALUES(Customer[Customer ID]), [Total Orders] > 1)),
    [Active Customers]
)

Delivery Fee Revenue =
SUMX(
    VALUES(Orders[Order ID]),
    CALCULATE(MAX(Orders[Delivery Fee]))
)

Cost of Goods Sold =
CALCULATE(
    SUMX(Orders, Orders[Quantity] * RELATED(Product[Unit Cost])),
    Orders[Order Status] = "Delivered"
)

Gross Profit = [Total Sales] - [Cost of Goods Sold]

Gross Margin % = DIVIDE([Gross Profit], [Total Sales])
Why not simply AVERAGE(Orders[Delivery Time Mins])?
An order with five lines would be counted five times and a one-line order once, so big orders would pull the average. AVERAGEX(VALUES(Orders[Order ID]), …) gives each order equal weight. Cancelled orders have a blank delivery time, and AVERAGEX ignores blanks. Always check the grain of your data before choosing an aggregation.
"Under 10 mins" here means 10 minutes or less (<= 10). Agree on the exact definition of every KPI with the business before building it.
Next we move on to aggregation functions. But first, make these base measures in your own file.
आता पुढे जाऊया aggregation functions कडे. पण आधी हे base measures तुमच्या file मध्ये बनवून ठेवा.
अब आगे चलते हैं aggregation functions की ओर. लेकिन पहले ये base measures अपनी file में बनाकर रखिए.
Ravindra Bagale's Tip
Friends, many students average the Delivery Time column directly, so big orders with many lines count several times. Check the grain before choosing an aggregation: here, take one value per order with AVERAGEX(VALUES(Orders[Order ID]), …). Agree every KPI definition (for example "under 10 minutes means ≤ 10") with the business. Don't make this mistake!
Ravindra Bagale's Tip – मराठी
मित्रांनो, बरेच students Delivery Time column चं थेट average घेतात, त्यामुळे अनेक lines असलेल्या मोठ्या orders अनेकदा मोजल्या जातात. Aggregation निवडण्याआधी grain चेक करा: इथे AVERAGEX(VALUES(Orders[Order ID]), …) ने प्रत्येक order ची एकच value घ्या. प्रत्येक KPI ची व्याख्या (उदाहरणार्थ "under 10 minutes म्हणजे ≤ 10") business सोबत ठरवून घ्या. ही चूक करू नका!
Ravindra Bagale's Tip – हिंदी
दोस्तों, बहुत से students Delivery Time column का सीधा average ले लेते हैं, जिससे कई lines वाले बड़े orders कई बार गिने जाते हैं. Aggregation चुनने से पहले grain check करो: यहाँ AVERAGEX(VALUES(Orders[Order ID]), …) से हर order की एक ही value लो. हर KPI की परिभाषा (जैसे "under 10 minutes यानी ≤ 10") business के साथ तय कर लो. यह गलती मत करना!
Loading DAX practice tasks...
- Total Sales (Easy): Write Sales Amt = SUMX over Orders of Qty × UnitPrice.
- Total Orders (Easy): Write Orders Count = number of different OrderID values.
- Delivered Sales (Easy): Write Delivered Sales = [Total Sales] only for Status "Delivered".
- Average Order Value (AOV) (Medium): Write AOV = [Total Sales] divided by [Total Orders] using DIVIDE.
- Cancelled Orders (Medium): Write Cancelled Orders = [Total Orders] where Status is "Cancelled".
- Cancellation Rate % (Medium): Write Cancel Rate = cancelled orders ÷ all orders. Use DIVIDE and CALCULATE.
- Avg Delivery Minutes (Medium): Write Avg Delivery Mins = AVERAGE of Orders[DeliveryMins].
- Net Sales after discount (Hard): Write Net Sales = SUMX over Orders of (Qty × UnitPrice − Discount).
- Gross Margin % (Hard): Write Margin % = (sales − cost) ÷ sales, where cost = Qty × the product CostPrice, added over all rows.
- AOV by platform (Hard): The box shows a row per Platform. Write AOV = [Total Sales] ÷ [Total Orders], using safe division.
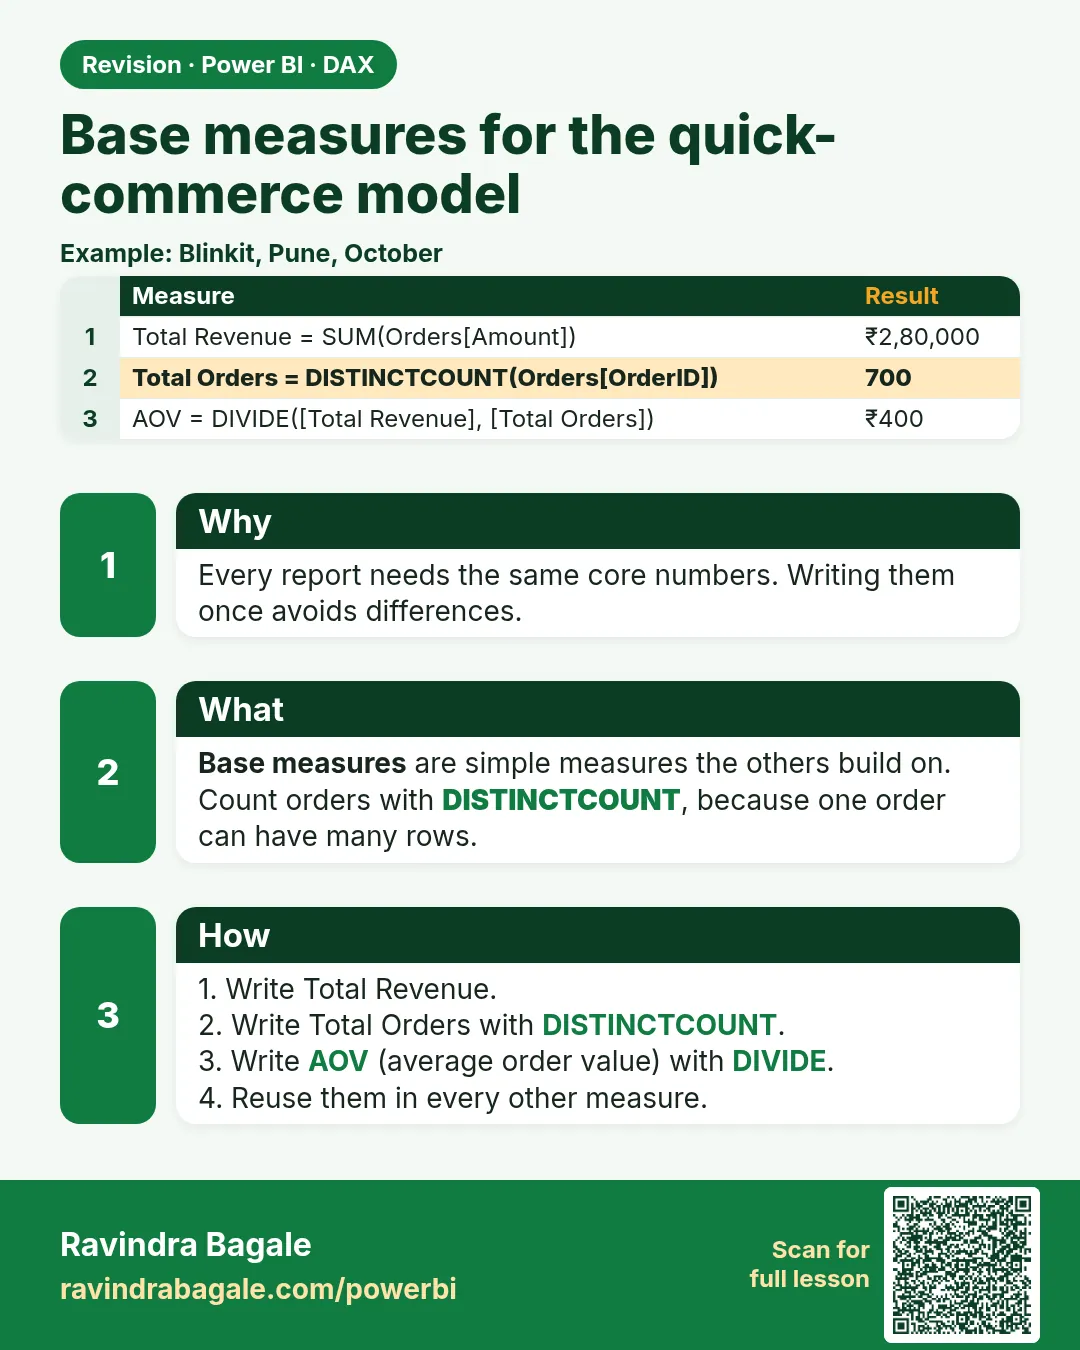 Revision card
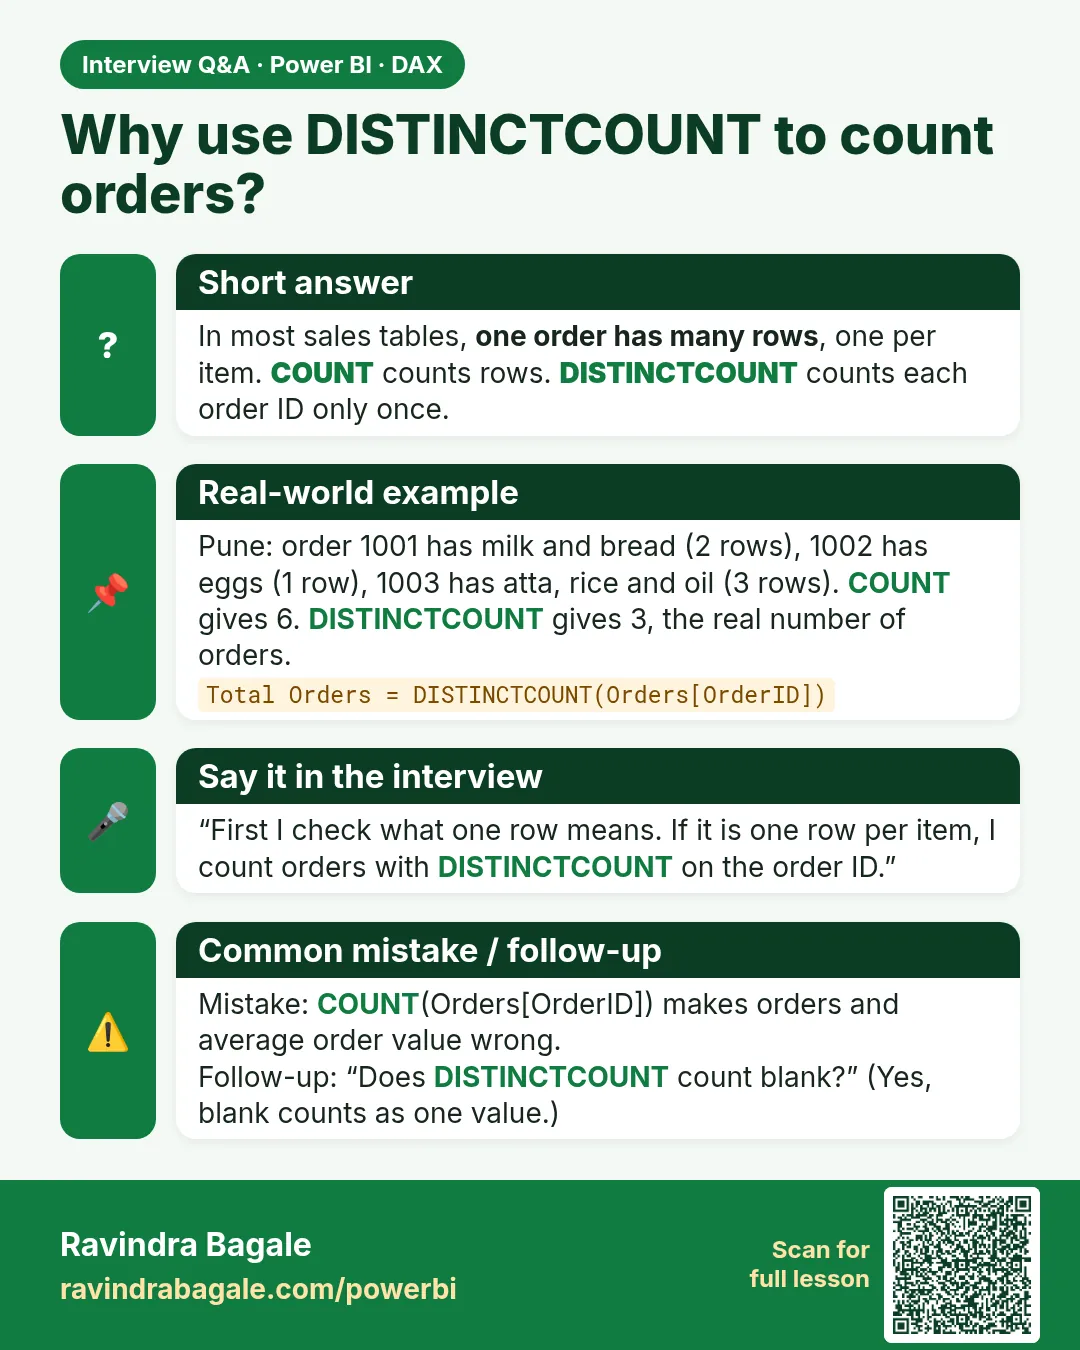 Interview card