13. DAX: Data Analysis Expressions
13.18 VAR and RETURN in Power BI DAX with Example
Quick answer: the short, self-contained version of this lesson is the guide DAX VAR and RETURN.
VAR and RETURN in Power BI DAX with example — in 30 seconds
What: VAR stores a value once inside a measure. RETURN gives the final answer.
Why: The formula is easier to read and Power BI does not calculate the same thing twice.
Tiny example: This month ₹1,200. Last month ₹1,000. Growth = 20%.
VAR and RETURN in Power BI DAX with example — 30 सेकंदात
काय: VAR measure च्या आत एखादी value एकदाच साठवतो. RETURN अंतिम उत्तर देतो.
का: Formula वाचायला सोपा होतो आणि Power BI तेच काम दोनदा calculate करत नाही.
छोटं उदाहरण: हा महिना ₹1,200. मागचा महिना ₹1,000. Growth = 20%.
VAR and RETURN in Power BI DAX with example — 30 सेकंड में
क्या: VAR measure के अंदर कोई value एक बार रखता है. RETURN आख़िरी जवाब देता है.
क्यों: Formula पढ़ना आसान होता है और Power BI एक ही चीज़ दो बार calculate नहीं करता.
छोटा उदाहरण: यह महीना ₹1,200. पिछला महीना ₹1,000. Growth = 20%.
First look at the data (before → after):
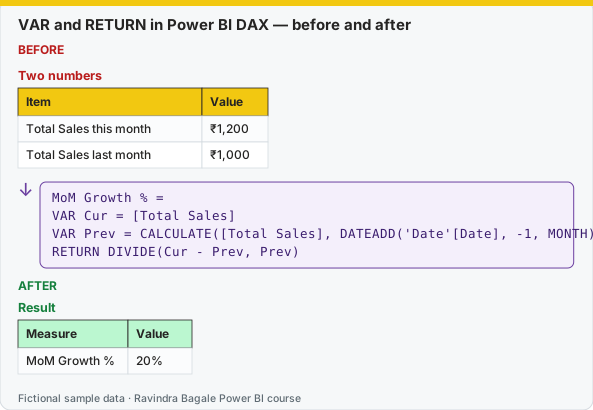
Same before / after tables as text
Before — Two numbers
| Item | Value |
|---|---|
| Total Sales this month | ₹1,200 |
| Total Sales last month | ₹1,000 |
About this data: This table uses columns: Item, Value. This table uses columns: Measure, Value. Values shown are the lesson examples already on this page (not a new dataset).
Formula / click path
MoM Growth % =
VAR Cur  = [Total Sales]
VAR Prev = CALCULATE([Total Sales], DATEADD('Date'[Date], -1, MONTH))
RETURN DIVIDE(Cur - Prev, Prev)
After — Result
| Measure | Value |
|---|---|
| MoM Growth % | 20% |
Do it step by step:
- New measure. Type the four lines. Use Shift + Enter for a new line.
- Format as percentage.
- To debug, change RETURN to
RETURN Prev. Check ₹1,000. Then change it back.
एक-एक step करून बघा:
- New measure. चार lines type करा. नवीन line साठी Shift + Enter वापरा.
- Percentage format द्या.
- Debug करायला RETURN बदलून
RETURN Prevकरा. ₹1,000 तपासा. मग परत आधीसारखं करा.
एक-एक step करके देखिए:
- New measure. चार lines type कीजिए. नई line के लिए Shift + Enter इस्तेमाल कीजिए.
- Percentage format दीजिए.
- Debug करने के लिए RETURN बदलकर
RETURN Prevकीजिए. ₹1,000 जाँचिए. फिर वापस पहले जैसा कीजिए.
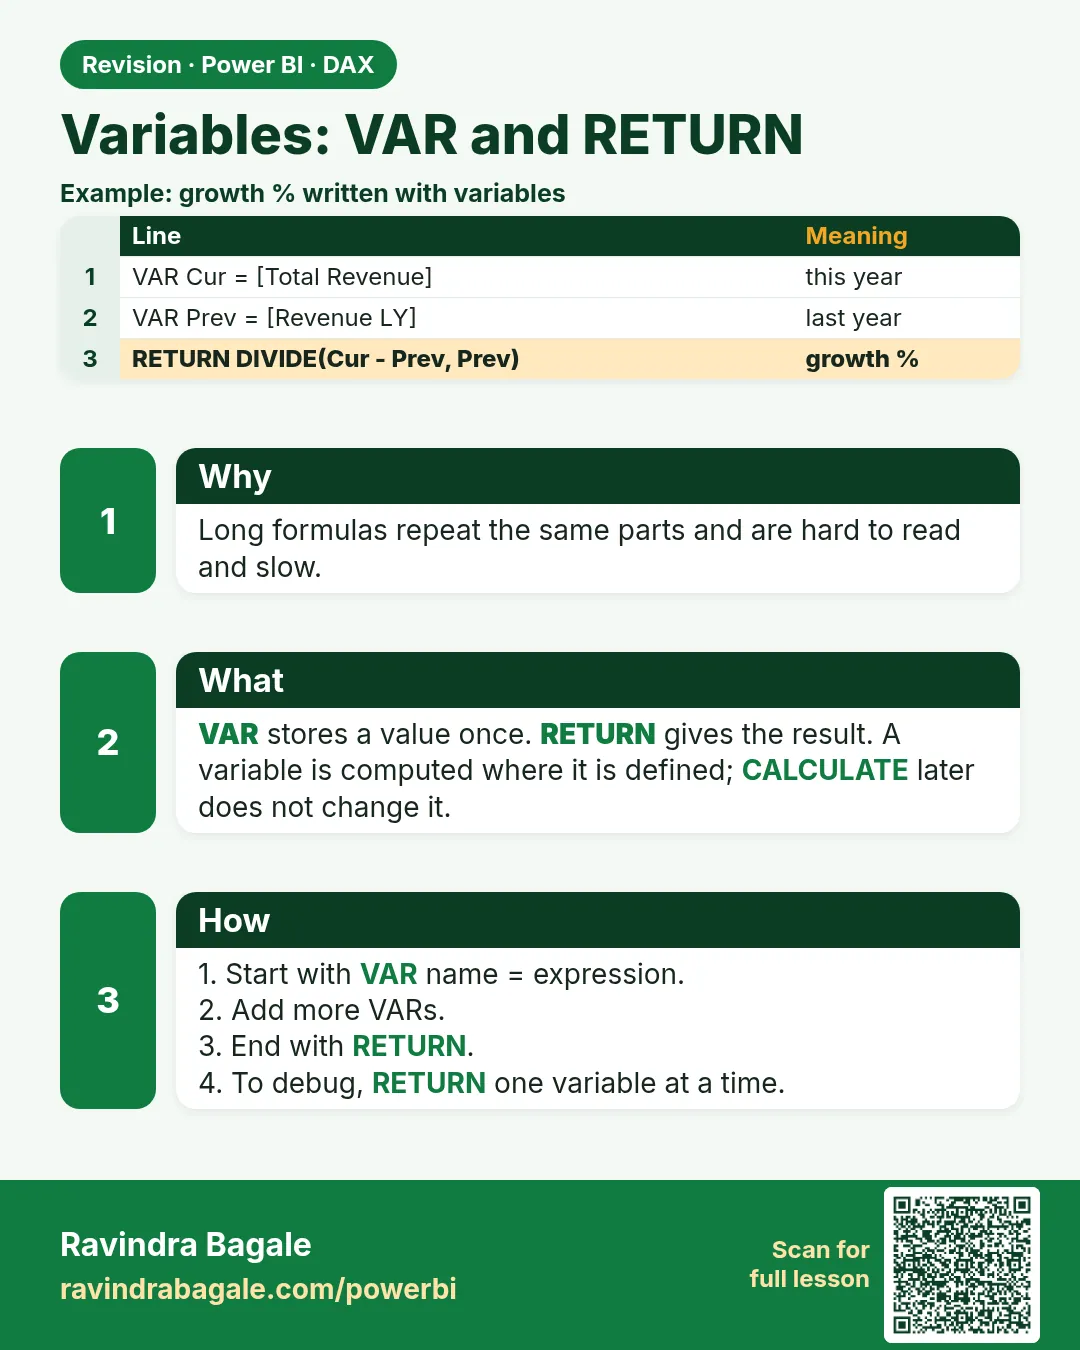
Variables store an intermediate result, making formulas easier to read, easier to debug and often faster (a variable is calculated once, even if used several times).
Store Health =
VAR OrdersCount = [Total Orders]
VAR AvgTime = [Avg Delivery Time (mins)]
VAR CancelRate = [Cancellation Rate]
RETURN
    SWITCH(TRUE(),
        ISBLANK(OrdersCount), BLANK(),
        AvgTime <= 10 && CancelRate < 0.02, "Excellent",
        AvgTime <= 15 && CancelRate < 0.05, "Good",
        "Needs Attention")
(The thresholds are example values for practice, not industry benchmarks.)
Now look at this: rules: define variables with VAR name = expression; finish with one RETURN. A variable is evaluated where it is defined, in the context at that point – it does not change later, even inside CALCULATE.
Debugging with variables
To check an intermediate value, temporarily change RETURN … to RETURN AvgTime. You can also test measures in DAX query view using EVALUATE and SUMMARIZECOLUMNS.
EVALUATE
SUMMARIZECOLUMNS(
    DarkStore[City],
    Orders[Platform],
    "Orders", [Total Orders],
    "Avg Mins", [Avg Delivery Time (mins)],
    "Cancel %", [Cancellation Rate]
)
ORDER BY [Orders] DESC
Make using variables a habit. The formula becomes easier to read, and mistakes become easier to find.
Variables वापरायची सवय लावून घ्या. Formula वाचायला सोपा होतो आणि चूक शोधायलाही.
Variables इस्तेमाल करने की आदत डालिए. Formula पढ़ना आसान हो जाता है और ग़लती ढूँढना भी.
Ravindra Bagale's Tip
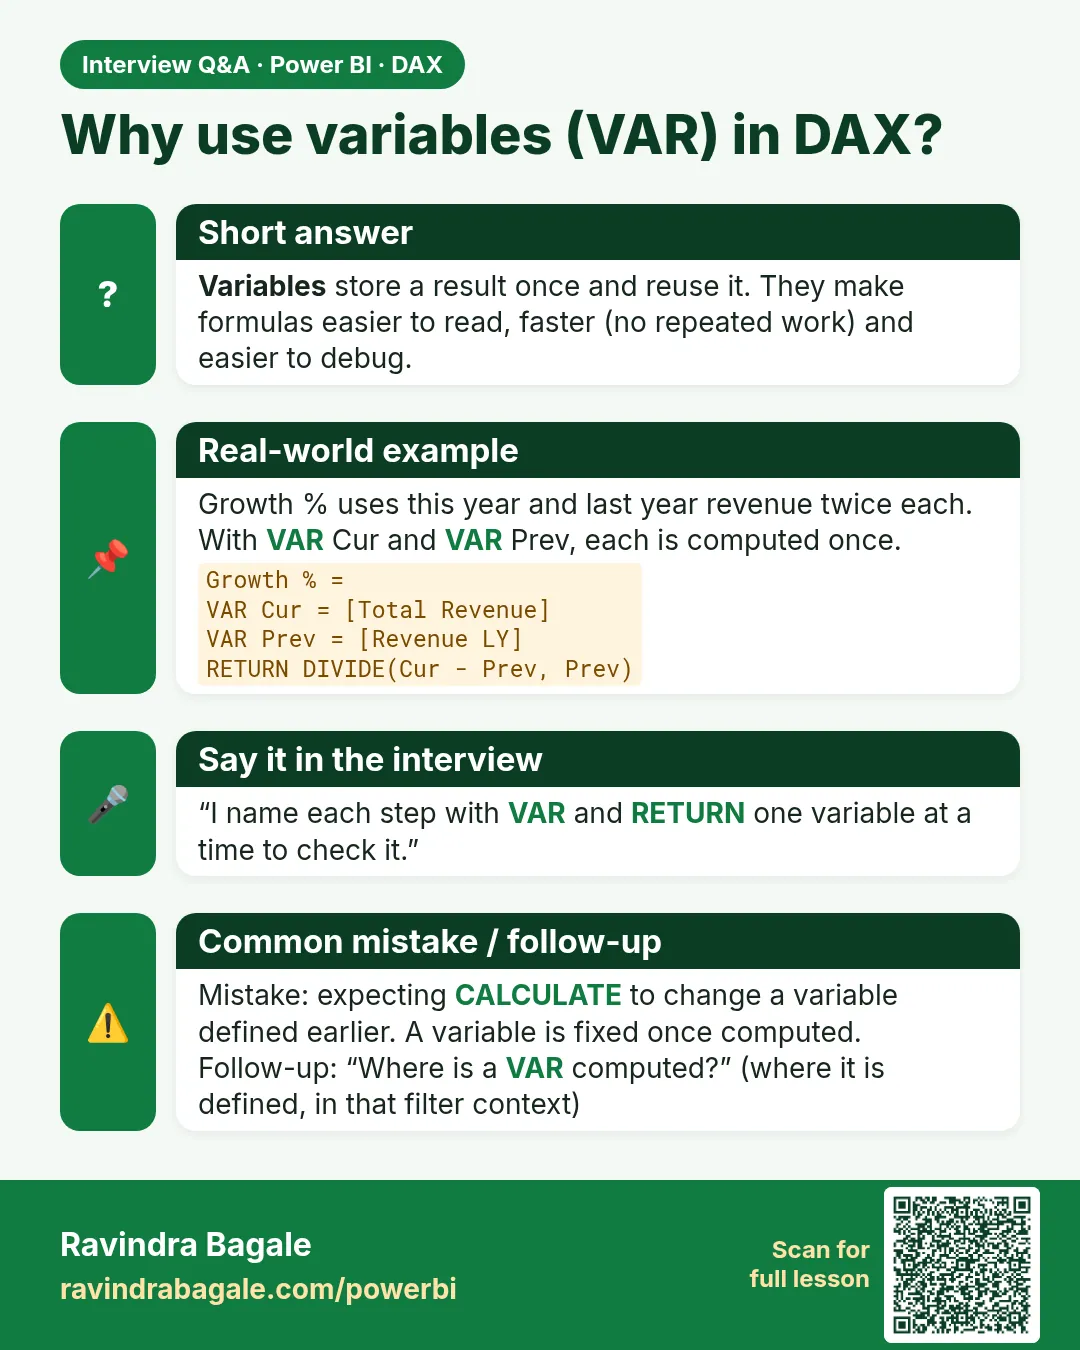
A common mistake is defining a variable and expecting it to change inside a later CALCULATE. Variables are evaluated once, where they are defined. Use this on purpose to "freeze" a value, and return a variable on its own when you need to debug a long measure. Keep this in mind!
Ravindra Bagale's Tip – मराठी
एक common चूक म्हणजे variable define करून तो नंतरच्या CALCULATE मध्ये बदलेल अशी अपेक्षा करणं. Variables जिथे define होतात तिथेच एकदाच evaluate होतात. Value "freeze" करण्यासाठी याचा मुद्दाम वापर करा, आणि मोठा measure debug करायचा असेल तर फक्त एक variable return करून बघा. लक्षात ठेवा!
Ravindra Bagale's Tip – हिंदी
एक common गलती है variable define करके उम्मीद करना कि वह बाद वाले CALCULATE में बदल जाएगा. Variables जहाँ define होते हैं वहीं एक बार evaluate होते हैं. किसी value को "freeze" करने के लिए इसका जानबूझकर इस्तेमाल करो, और लंबा measure debug करना हो तो अकेला एक variable return करके देखो. ध्यान रखना!
Loading DAX practice tasks...
- Reject rate with variables (Easy): Measure: Reject Rate = rejected units ÷ units made, using two variables.
- Good units (Easy): Measure: Good Units = units made minus units rejected, with variables.
- Production cost per country (Easy): Shown per Country. Measure: Prod Cost = UnitsMade × CostPerUnit added, stored in a variable.
- Cost per good unit (Medium): Shown per Part. Measure: Cost per Good = total cost ÷ good units.
- Share of all units (Medium): Shown per Plant. Measure: Unit Share = this plant's units ÷ units of all plants.
- Check or OK (Medium): Shown per Part. Measure: Quality Flag = "Check" if rejected ÷ made is above 0.02, else "OK".
- Germany share (Medium): Measure: Germany Share = units made in Germany ÷ all units made.
- Night minus day (Hard): Shown per Plant. Measure: Night Gap = Night shift units − Day shift units.
- Biggest part volume (Hard): Measure: Top Part Units = the highest total UnitsMade of any Part.
- Good percent column (Hard): Calculated column on Batches: Good Pct = (UnitsMade − UnitsRejected) ÷ UnitsMade, using a variable.
 Revision card
 Interview card