13. DAX: Data Analysis Expressions
13.1 What is DAX?
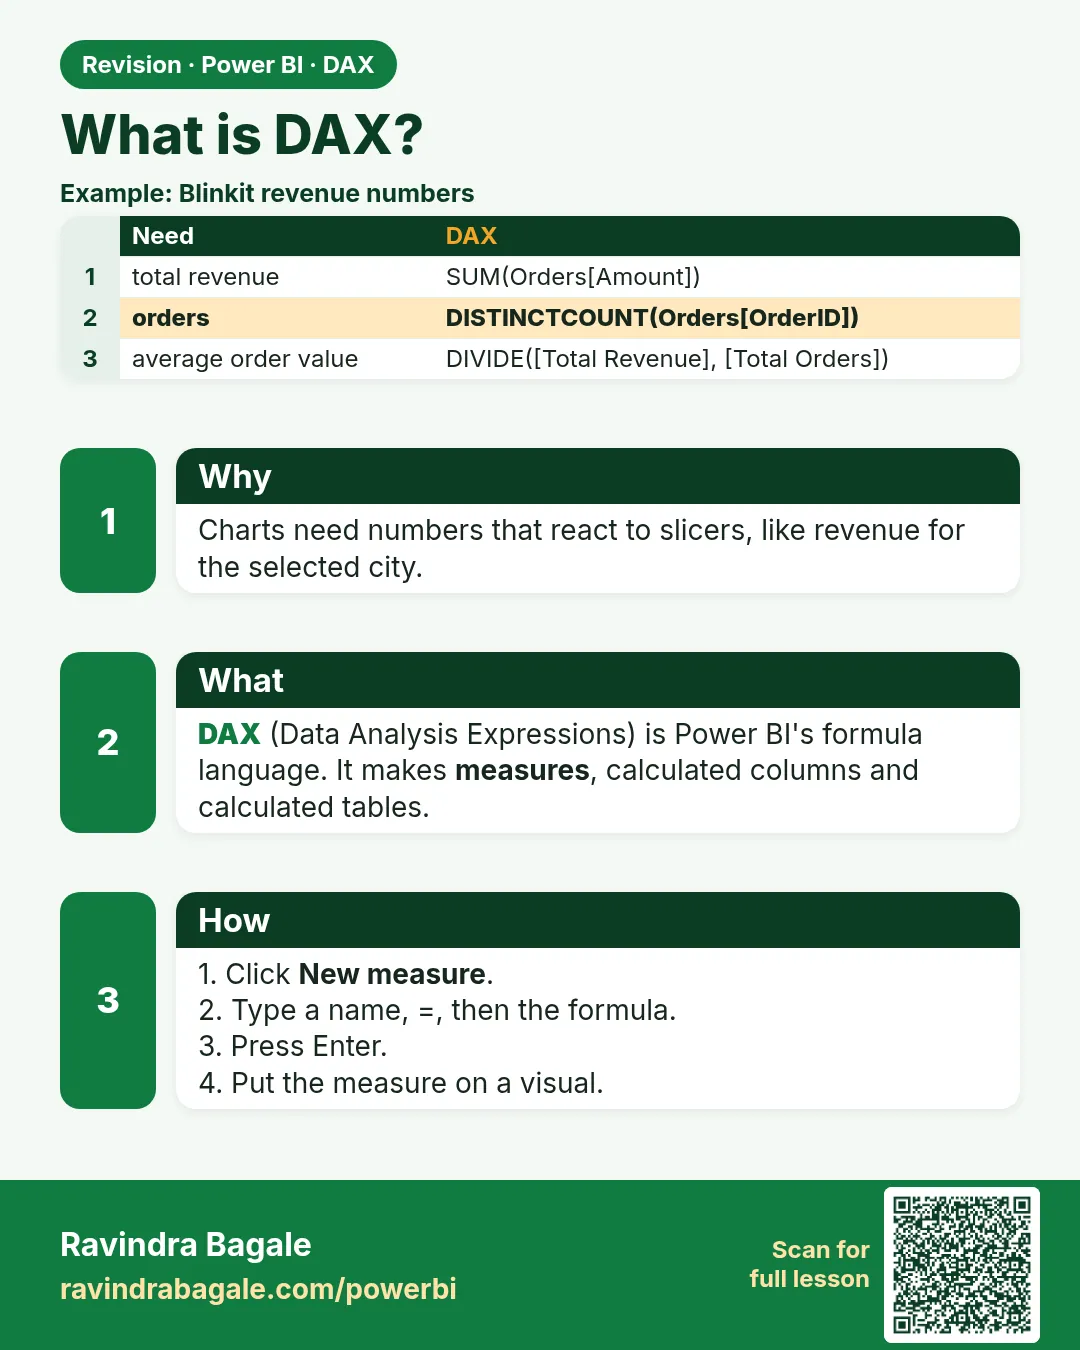
In short: DAX (Data Analysis Expressions) is the formula language of Power BI, Analysis Services and Power Pivot in Excel.
Quick answer: the short, self-contained version of this lesson is the guide What Is DAX? Beginner Guide for Power BI.
DAX (Data Analysis Expressions) is the formula language of Power BI, Analysis Services and Power Pivot in Excel. It looks similar to Excel formulas, but there is one big difference: Excel formulas work on cells, DAX works on tables and columns. You never refer to "cell B2"; you refer to Orders[Amount] and let the context decide which rows are included.
You write DAX in three places:
| Object | Created with | Evaluated | Stored |
|---|---|---|---|
| Calculated column | Table tools › New column | Row by row, at data refresh | Stored in the model (uses memory) |
| Measure | Home › New measure | At query time, in the current filter context | Not stored – only the formula |
| Calculated table | Modeling › New table | At data refresh | Stored in the model |
About this data: This table uses columns: Object, Created with, Evaluated, Stored. Values shown are the lesson examples already on this page (not a new dataset).
Ravindra Bagale's Tip
Friends, many students start DAX by writing long formulas copied from the internet. Start with simple base measures (Total Sales, Total Orders) and build new measures on top of them. Understanding filter context matters much more than memorising function names. Remember this rule.
Ravindra Bagale's Tip – मराठी
मित्रांनो, बरेच students internet वरून copy केलेले मोठे formulas लिहून DAX ची सुरुवात करतात. साध्या base measures (Total Sales, Total Orders) पासून सुरुवात करा आणि त्यांच्यावर नवीन measures बांधा. Function names पाठ करण्यापेक्षा filter context समजणं खूप जास्त महत्त्वाचं आहे. हा नियम लक्षात ठेवा.
Ravindra Bagale's Tip – हिंदी
दोस्तों, बहुत से students internet से copy किए लंबे formulas लिखकर DAX शुरू करते हैं. आसान base measures (Total Sales, Total Orders) से शुरू करो और उन्हीं पर नए measures बनाओ. Function names रटने से कहीं ज़्यादा ज़रूरी है filter context को समझना. यह नियम याद रखो.
Loading DAX practice tasks...
- Total units sold (Easy): Create a measure Total Qty that adds up the Qty column of the Orders table.
- Count order lines (Easy): Create a measure Order Lines that counts the rows of the Orders table.
- Biggest quantity in one line (Easy): Create a measure Max Qty that returns the largest Qty in Orders.
- Total discount given (Easy): Create a measure Total Discount that adds the Discount column of Orders.
- Average unit price (Easy): Create a measure Avg Unit Price that gives the average of Orders[UnitPrice].
- Number of different customers (Medium): Create a measure Customers that counts how many different CustomerID values appear in Orders.
- Total sales value (Medium): Create a measure Sales Value that multiplies Qty by UnitPrice on each Orders row and adds the results.
- Fastest delivery (Medium): Create a measure Fastest Delivery that returns the smallest DeliveryMins. Blank cells (cancelled orders) are ignored automatically.
- Average order lines per customer (Hard): Create a measure Lines per Customer = order lines divided by different customers. Use the safe divide function.
- Gross profit (Hard): Create a measure Gross Profit = SUM over Orders of Qty × (UnitPrice − the product's CostPrice). CostPrice lives in Product.
 Revision card