13. DAX: Data Analysis Expressions
13.16 Time Intelligence in Power BI with Example: FYTD, Last Year and YoY %
Quick answer: the short, self-contained version of this lesson is the guide DAX Rolling 12-Month Average.
TOTALYTD and SAMEPERIODLASTYEAR in Power BI with example (FY April–March) — in 30 seconds
What: Time intelligence functions move or stretch the dates in the filter: year-to-date, same period last year.
Why: The monthly Maharashtra report always asks two things: "How much so far this financial year?" and "Better than last year?"
Tiny example: FY YTD after June = 100 + 120 + 150 = ₹370K. April 2025 vs April 2024: 130 vs 100 = +30%.
TOTALYTD and SAMEPERIODLASTYEAR in Power BI with example (FY April–March) — 30 सेकंदात
काय: Time intelligence functions filter मधल्या dates पुढे-मागे करतात किंवा ताणतात: year-to-date, गेल्या वर्षीचा तोच काळ.
का: Maharashtra चा monthly report नेहमी दोन गोष्टी विचारतो: "या financial year मध्ये आतापर्यंत किती?" आणि "गेल्या वर्षीपेक्षा चांगलं का?"
छोटं उदाहरण: June नंतर FY YTD = 100 + 120 + 150 = ₹370K. April 2025 vs April 2024: 130 vs 100 = +30%.
TOTALYTD and SAMEPERIODLASTYEAR in Power BI with example (FY April–March) — 30 सेकंड में
क्या: Time intelligence functions filter की dates को आगे-पीछे करते हैं या फैलाते हैं: year-to-date, पिछले साल की वही अवधि.
क्यों: Maharashtra की monthly report हमेशा दो बातें पूछती है: "इस financial year में अब तक कितना?" और "पिछले साल से बेहतर?"
छोटा उदाहरण: June के बाद FY YTD = 100 + 120 + 150 = ₹370K. April 2025 vs April 2024: 130 vs 100 = +30%.
First look at the data (before → after):
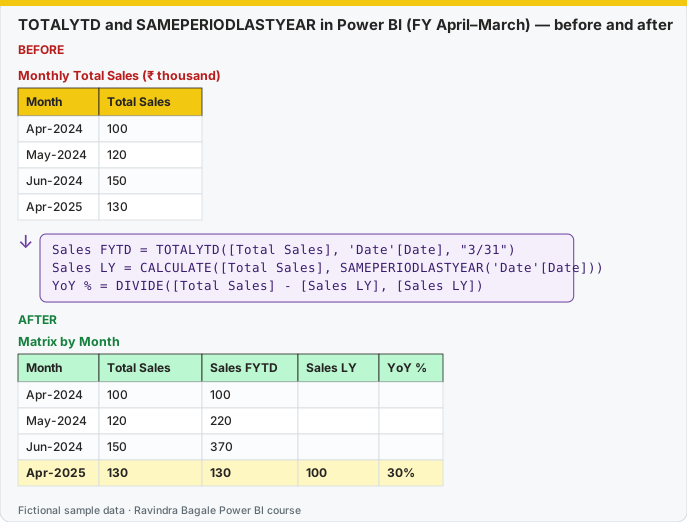
Same before / after tables as text
Before — Monthly Total Sales (₹ thousand)
| Month | Total Sales |
|---|---|
| Apr-2024 | 100 |
| May-2024 | 120 |
| Jun-2024 | 150 |
| Apr-2025 | 130 |
About this data: This table uses columns: Month, Total Sales. This table uses columns: Month, Total Sales, Sales FYTD, Sales LY, YoY %. This table uses columns: Function, Returns, Example with March 2025 selected. Values shown are the lesson examples already on this page (not a new dataset).
Formula / click path
Sales FYTD = TOTALYTD([Total Sales], 'Date'[Date], "3/31")
Sales LY = CALCULATE([Total Sales], SAMEPERIODLASTYEAR('Date'[Date]))
YoY % = DIVIDE([Total Sales] - [Sales LY], [Sales LY])
After — Matrix by Month
| Month | Total Sales | Sales FYTD | Sales LY | YoY % |
|---|---|---|---|---|
| Apr-2024 | 100 | 100 | — | — |
| May-2024 | 120 | 220 | — | — |
| Jun-2024 | 150 | 370 | — | — |
| Apr-2025 | 130 | 130 | 100 | 30% |
Do it step by step:
- Check you have a marked Date table (11.5) with no gaps.
- New measure: Sales FYTD with year end
"3/31"(31 March). - New measure: Sales LY.
- New measure: YoY %. Format as percentage.
- Matrix: Rows = Year Month from the Date table (not from Orders).
- Check: FYTD restarts at April. That is the Indian financial year.
एक-एक step करून बघा:
- Gap नसलेला marked Date table (11.5) आहे ना ते तपासा.
- New measure: year end
"3/31"(31 March) सोबत Sales FYTD. - New measure: Sales LY.
- New measure: YoY %. Percentage format द्या.
- Matrix: Rows = Date table मधला Year Month (Orders मधला नाही).
- तपासा: FYTD April ला पुन्हा सुरू होतो. हेच Indian financial year.
एक-एक step करके देखिए:
- Gap रहित marked Date table (11.5) है या नहीं, जाँचिए.
- New measure: year end
"3/31"(31 March) के साथ Sales FYTD. - New measure: Sales LY.
- New measure: YoY %. Percentage format दीजिए.
- Matrix: Rows = Date table का Year Month (Orders वाला नहीं).
- जाँचिए: FYTD April में फिर से शुरू होता है. यही Indian financial year है.
Simple bhashet sangaycha tar, time intelligence functions compare values across periods. Requirements: a proper date table marked as a date table (Module 11), related to the fact table, and the date column from the Date table used in the functions.
Year-to-date (YTD), QTD, MTD
Sales YTD = TOTALYTD([Total Sales], 'Date'[Date])

-- Same result using CALCULATE + DATESYTD
Sales YTD v2 = CALCULATE([Total Sales], DATESYTD('Date'[Date]))

-- Indian financial year (April–March): year ends on 31 March
Sales FYTD = TOTALYTD([Total Sales], 'Date'[Date], "3/31")

Orders QTD = TOTALQTD([Total Orders], 'Date'[Date])
Orders MTD = TOTALMTD([Total Orders], 'Date'[Date])
The optional year-end argument is a text date (month/day). Its interpretation can depend on locale; "3/31" is the common way to express 31 March.
Previous year and previous period
Sales LY = CALCULATE([Total Sales], SAMEPERIODLASTYEAR('Date'[Date]))

Sales LY (DATEADD) = CALCULATE([Total Sales], DATEADD('Date'[Date], -1, YEAR))

Orders Previous Month = CALCULATE([Total Orders], DATEADD('Date'[Date], -1, MONTH))

Orders Previous Week = CALCULATE([Total Orders], DATEADD('Date'[Date], -7, DAY))

-- Full previous year, regardless of which month is selected
Sales Full Prev Year = CALCULATE([Total Sales], PARALLELPERIOD('Date'[Date], -1, YEAR))

Sales LY YTD = CALCULATE([Sales YTD], SAMEPERIODLASTYEAR('Date'[Date]))
| Function | Returns | Example with March 2025 selected |
|---|---|---|
SAMEPERIODLASTYEAR |
Same dates shifted back one year | March 2024 |
DATEADD(dates, -1, YEAR) |
Dates shifted by any number of days/months/quarters/years | March 2024 |
DATEADD(dates, -1, MONTH) |
Shifted back one month | February 2025 |
PARALLELPERIOD(dates, -1, YEAR) |
The complete previous period(s) at the chosen level | Jan–Dec 2024 |
DATESYTD(dates) |
Dates from start of year to last visible date | 1 Jan – 31 Mar 2025 |
Festivals move every year
Diwali and Ganeshotsav fall on different calendar dates each year. SAMEPERIODLASTYEAR compares the same dates, so October this year may be compared with a non-festival October last year – growth will look unusually high or low. For festival analysis, compare festival days with festival days using the Festival column from Module 5:
Festival Orders = CALCULATE([Total Orders], 'Date'[Is Festival Day] = TRUE())

-- Use in a visual or card filtered to one Year
Diwali Orders LY =
VAR PrevYear = MAX('Date'[Year]) - 1
RETURN
    CALCULATE(
        [Total Orders],
        'Date'[Festival] = "Diwali",
        'Date'[Year] = PrevYear
    )
Year-over-Year and Month-over-Month growth %
YoY Growth % =
VAR CurrentSales = [Total Sales]
VAR PreviousSales = [Sales LY]
RETURN
    IF(
        NOT ISBLANK(CurrentSales) && NOT ISBLANK(PreviousSales),
        DIVIDE(CurrentSales - PreviousSales, PreviousSales)
    )

MoM Orders Growth % =
DIVIDE([Total Orders] - [Orders Previous Month], [Orders Previous Month])
Running total (cumulative)
Running Total Orders =
CALCULATE(
    [Total Orders],
    FILTER(
        ALL('Date'[Date]),
        'Date'[Date] <= MAX('Date'[Date])
    )
)
For each point on the axis, it counts orders from the first date in the model up to the last visible date. A YTD measure is a running total (आतापर्यंतची एकत्रित बेरीज) that restarts every year. (Because orders are counted with DISTINCTCOUNT, each Order ID is counted once even across dates.)
Moving (rolling) average
-- Average of the last 3 months' sales (monthly level visual)
Sales 3M Moving Avg =
VAR Period =
    DATESINPERIOD('Date'[Date], MAX('Date'[Date]), -3, MONTH)
RETURN
    CALCULATE(
        AVERAGEX(VALUES('Date'[Year Month]), [Total Sales]),
        Period
    )

-- 7-day moving average of daily orders (daily level visual)
Orders 7D Moving Avg =
CALCULATE(
    AVERAGEX(VALUES('Date'[Date]), [Total Orders]),
    DATESINPERIOD('Date'[Date], MAX('Date'[Date]), -7, DAY)
)
DATESINPERIOD(dates, start_date, number_of_intervals, interval) returns a continuous set of dates going backwards (negative number) or forwards from the start date. Moving averages smooth out short-term ups and downs (for example weekend peaks in grocery orders) so the trend is easier to see.
Time intelligence needs continuous dates
If you use the date column from the Orders table instead of the Date table, results can be wrong karan the fact table may have gaps (days without orders). Always use 'Date'[Date].
Ghabru naka, time intelligence suruvatila khup functions vattat. Pan sagle ekach niyamavar chaltat – marked Date table.
Ravindra Bagale's Tip
Remember one thing: time intelligence fails silently when the Date table is not marked, has gaps, or is related through a DateTime column. Before writing SAMEPERIODLASTYEAR or TOTALYTD, check these three things. For an April–March financial year, pass the year-end date "3/31" (month/day, as in Microsoft's examples) to TOTALYTD. Practise, and it will feel very easy.
Ravindra Bagale's Tip – मराठी
एक गोष्ट लक्षात ठेवा: Date table mark केलेला नसेल, त्यात gaps असतील, किंवा तो DateTime column ने relate केलेला असेल तर time intelligence काहीही न सांगता fail होतं. SAMEPERIODLASTYEAR किंवा TOTALYTD लिहिण्याआधी या तीन गोष्टी चेक करा. April–March financial year साठी TOTALYTD ला year-end date "3/31" द्या (month/day, Microsoft च्या examples सारखं). Practice करा, मग एकदम सोपं वाटेल.
Ravindra Bagale's Tip – हिंदी
एक बात याद रखो: Date table mark न हो, उसमें gaps हों, या वह DateTime column से relate हो तो time intelligence चुपचाप fail हो जाता है. SAMEPERIODLASTYEAR या TOTALYTD लिखने से पहले ये तीन बातें check करो. April–March financial year के लिए TOTALYTD को year-end date "3/31" दो (month/day, Microsoft के examples की तरह). Practice करो, फिर बहुत आसान लगेगा.
Loading DAX practice tasks...
- Year-to-date sales (Easy): Slicer: FY 2024-25. Shown per FYMonthNo (April = 1). Measure: Sales YTD = running total of [Total Sales] from April.
- Last year sales by FY (Easy): Shown per FY. Measure: Sales LY = [Total Sales] for the same period last year.
- Year-to-date units (Easy): Slicer: FY 2024-25. Shown per FYMonthNo. Measure: Qty YTD = [Total Qty] for dates from April to now.
- Same month last year (Medium): Slicer: FY 2025-26. Shown per FYMonthNo. Measure: Sales LY = [Total Sales] for the same period last year.
- Last month sales (Medium): Slicer: FY 2025-26. Shown per FYMonthNo. Measure: Sales PM = [Total Sales] shifted back one month.
- Quarter-to-date (Medium): Slicer: FY 2025-26. Shown per FYMonthNo. Measure: Sales QTD = running total of [Total Sales] inside the quarter.
- Last quarter sales (Medium): Slicer: FY 2025-26. Shown per FYQuarter. Measure: Sales PQ = [Total Sales] shifted back one quarter.
- Last year per city (Hard): Slicer: FY 2025-26. Shown per Store City. Measure: Sales LY = [Total Sales] for the same period last year.
- Growth versus last year (Hard): Shown per FY. Measure: YoY % = growth of [Total Sales] over the same period last year.
- Full-year YTD per city (Hard): Slicer: FY 2025-26. Shown per Store City. Measure: Sales YTD = [Total Sales] year to date with year end "3-31".
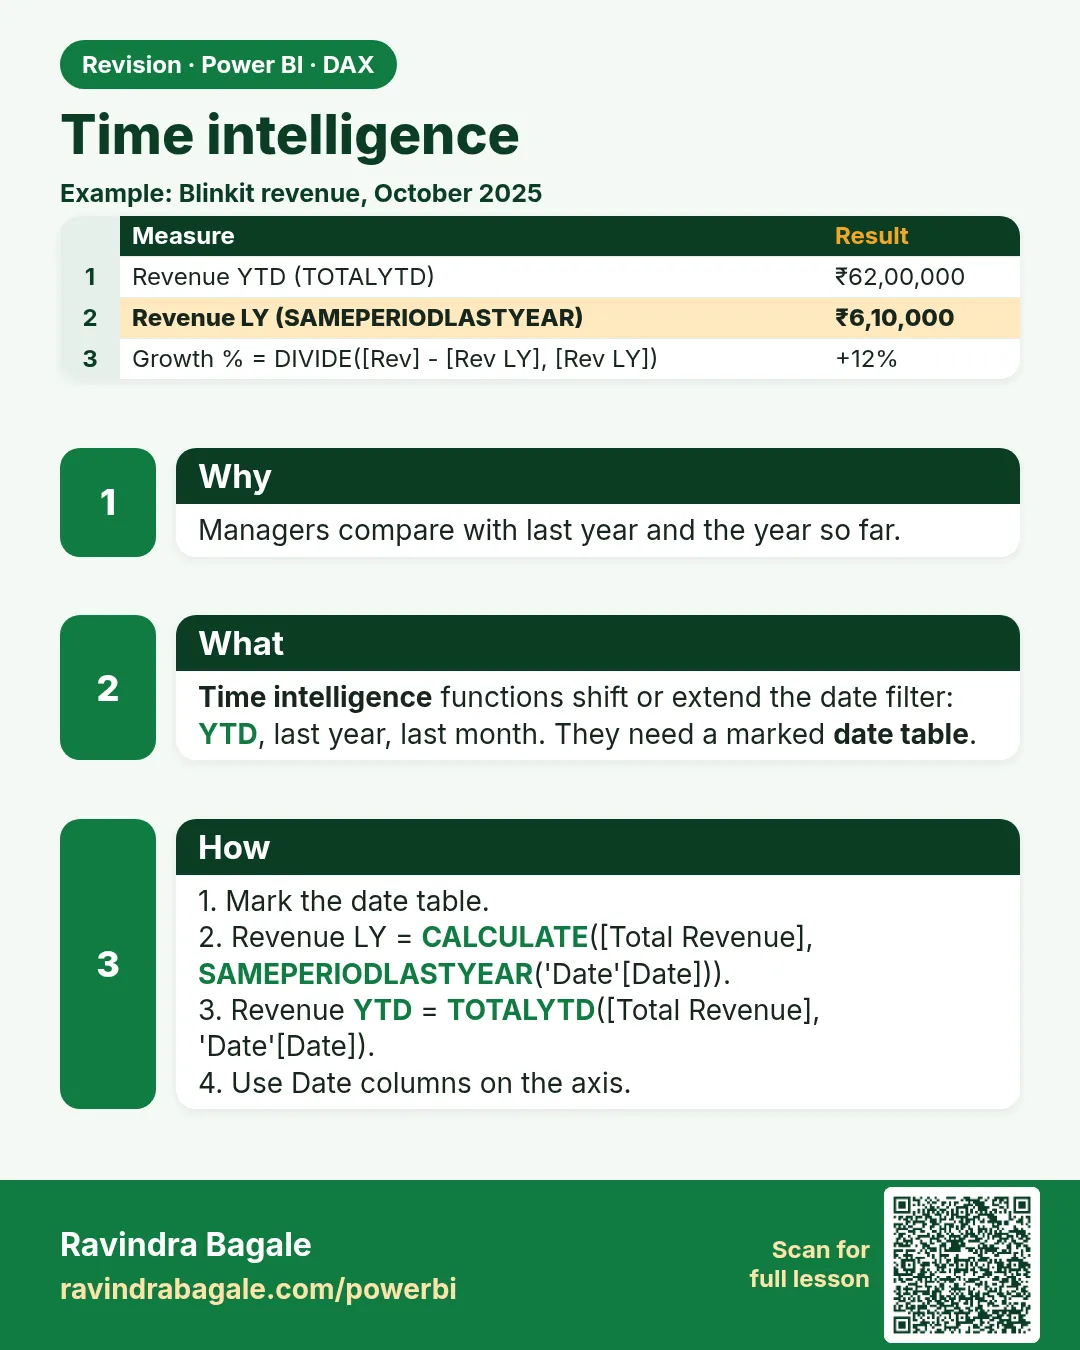 Revision card