13. DAX: Data Analysis Expressions
13.2 Calculated Columns vs Measures (Recap)
Quick answer: the short, self-contained version of this lesson is the guide Measures vs Calculated Columns in Power BI.
Start with a problem
Raja runs a small Power BI training batch in Sambhaji Nagar. He tracks fictional Blinkit-style practice orders for class demos. He wants two numbers on one page:
- A band for each order line (Below ₹199 / ₹199–498 / ₹499+) so students can put it on a slicer.
- Profit % that changes when they pick City = Pune or Nashik.
He stored both as calculated columns. The slicer band worked. The Profit % card looked fine until the matrix total disagreed with the city rows. That is the classic column-vs-measure trap.
Module 8.11–8.13 covers this in depth. This section is the DAX recap with the full teaching pattern.
Explain simply
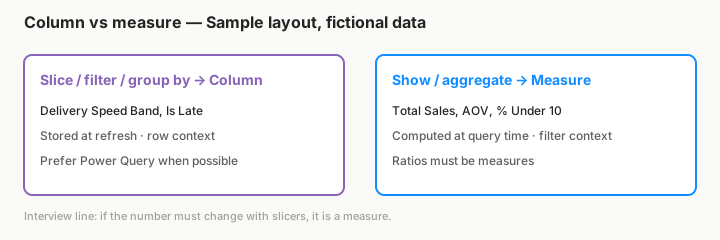
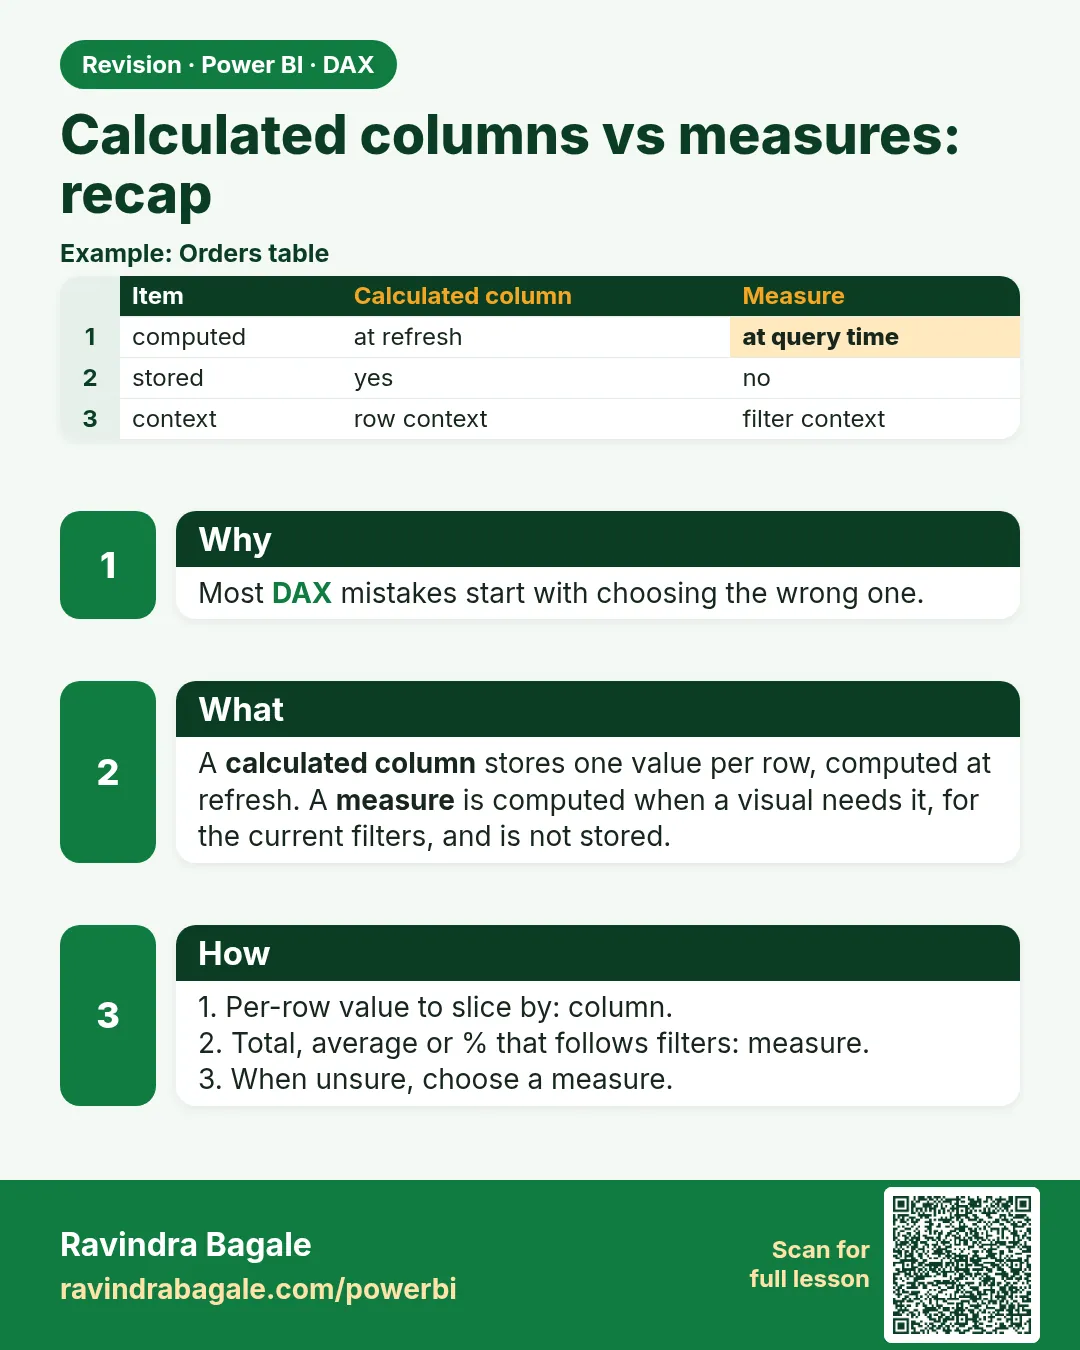
- A calculated column fills one value per row, at refresh, and stores it (like a new Excel column that never changes until you refresh).
- A measure stores only a formula. Power BI runs it when a visual asks, in the current filter context (the filters from slicers, matrix rows, Filters pane, RLS, and
CALCULATE). - Slice or filter by a value, then column (preferably in Power Query). Show or aggregate a value, then explicit measure. Ratios, KPIs and time intelligence are always measures.
Abstract idea: aggregation means combining many row values into one number (sum, count, average).
Show the data
Fictional sample (hand-calculable). File: src/practice/column_vs_measure_orders.csv.
| Order ID | City | Amount (₹) | Discount (₹) |
|---|---|---|---|
| 201 | Pune | 500 | 50 |
| 202 | Nashik | 300 | 0 |
| 203 | Pune | 700 | 100 |
| 204 | Kolhapur | 400 | 0 |
About this data: This table uses columns: Order ID, City, Amount (₹), Discount (₹). This table uses columns: City, Net Sales (₹). This table uses columns: Wrong result, Reason, Correction. Values shown are the lesson examples already on this page (not a new dataset).
Net line = Amount − Discount. Hand totals: Net all = ₹1,750. Pune net = ₹1,050. Nashik = ₹300. Kolhapur = ₹400.
Demonstrate
- Open Power BI Desktop with a small Orders table (or Enter data from the table above).
- Select the Orders table → Table tools › New column → enter
Net Amount = Orders[Amount] - Orders[Discount]→ Enter. Why: row-level net for slicing or SUM later. - Home › New measure →
Total Sales = SUM(Orders[Amount])→ Enter. Format as ₹. - Home › New measure →
Net Sales = SUMX(Orders, Orders[Amount] - Orders[Discount])→ Enter. Why: same net without storing a column. - Add a Matrix: Rows = City, Values = Net Sales. Add a City slicer.
- Do not create
Profit %as a column. CreateProfit % = DIVIDE([Net Sales], [Total Sales])as a measure.
Gross Line Value = Orders[Amount] + Orders[Discount]      -- column: one value per row, stored at refresh
Total Sales = SUM(Orders[Amount])                         -- measure: one value per filter context
Net Sales = SUMX(Orders, Orders[Amount] - Orders[Discount])
Show the result
Your result should look like this (fictional sample):
| City | Net Sales (₹) |
|---|---|
| Pune | 1,050 |
| Nashik | 300 |
| Kolhapur | 400 |
| Total | 1,750 |
Slicer Pune, then matrix and card both show ₹1,050 for Net Sales. Profit % uses the measure, so the total is 1750/1900, not the average of city percentages.
Explain what happened
The column Net Amount is fixed per row after refresh. SUM / SUMX of those nets respects whatever filters the visual has (City = Pune keeps only Pune rows). A percentage column that you then average across cities is mathematically wrong: the average of percentages is not the overall percentage. Measures recompute in each cell's filter context, so totals stay consistent.
Explore further
- Prefer building bands and flags in Power Query when the logic needs no relationships.
- Use a DAX column when you need
RELATEDfrom a dimension (e.g. Category on the fact). - Use a measure-only pattern (
SUMX) when you never slice by the net amount itself — saves memory on large facts.
Fix common mistakes
| Wrong result | Reason | Correction |
|---|---|---|
| Every city shows the same Profit % | Percentage stored as column, then averaged | Profit % = DIVIDE([Net Sales], [Total Sales]) measure |
Grand total on every row for SUM(Orders[Amount]) in a column |
Row context does not filter aggregations | Use the row's columns, or CALCULATE for context transition (13.3) |
| File size jumps after many fact columns | Stored columns cost RAM | Prefer measures; push static logic to Power Query |
Practise independently
Practice task
Using src/practice/column_vs_measure_orders.csv, create Net Sales as a measure only (no Net Amount column). Confirm Pune = ₹1,050 and All = ₹1,750. Then add Profit % as a measure and check the total is not the average of city %.
Hints
Net Sales = SUMX(Orders, Orders[Amount] - Orders[Discount])- Put City on rows; compare card vs matrix total.
- Answers:
src/practice/ANSWERS.md
Solution
- Get data › Text/CSV › the practice file › Load (or Transform then Close & Apply).
- New measure
Net Sales(Net Sales = SUMX(Orders, Orders[Amount] - Orders[Discount])); put it in a matrix by City. Profit % = DIVIDE([Net Sales], SUM(Orders[Amount]))— total ≈ 92.1% (1750/1900), while averaging city profit % would differ.
Think like a professional
Interview answer in one line: If I need to put it on a slicer or axis, I use a column; if the number must respond to filters and totals, I use a measure — ratios are always measures. On large models, every unused calculated column on the fact table costs memory at refresh and in the Service.
Ravindra Bagale's Tip
Friends, remember: the mistake I see in almost every batch is using a calculated column where a measure is needed, for example a "Profit %" column. If the number must change with slicers and totals, it is a measure. Columns are for values you filter or group by. Try it once more, then move on.
Ravindra Bagale's Tip – मराठी
मित्रांनो, लक्षात ठेवा: जवळजवळ प्रत्येक batch मध्ये दिसणारी चूक म्हणजे measure लागत असताना calculated column वापरणं, उदाहरणार्थ "Profit %" column. Number slicers आणि totals सोबत बदलायलाच हवा असेल तर तो measure आहे. Columns हे ज्या values ने filter किंवा group करता त्यांच्यासाठी असतात. पुन्हा एकदा करून बघा, मग पुढे जा.
Ravindra Bagale's Tip – हिंदी
दोस्तों, याद रखो: लगभग हर batch में दिखने वाली गलती है measure की ज़रूरत होने पर calculated column इस्तेमाल करना, जैसे "Profit %" column. अगर number को slicers और totals के साथ बदलना है तो वह measure है. Columns उन values के लिए होते हैं जिनसे तुम filter या group करते हो. एक बार फिर करके देखो, फिर आगे बढ़ो.
Loading DAX practice tasks...
- Line value column (Easy): Calculated column on Orders: Line Value = Qty × UnitPrice.
- Total line value as a measure (Easy): Measure: Total Line Value = add Qty × UnitPrice over all Orders rows.
- Is it cancelled? column (Easy): Calculated column on Orders: Is Cancelled = TRUE when Status is "Cancelled".
- Price band column (Easy): Calculated column on Orders: Band = "Big" if UnitPrice is 200 or more, otherwise "Small".
- Product category on each order (Medium): Calculated column on Orders: Category = the Category of the product on that row.
- Delivered orders measure (Medium): Measure: Delivered Lines = number of Orders rows where Status is "Delivered".
- Cost price column (Medium): Calculated column on Orders: Line Cost = Qty × the product CostPrice.
- Average line value (Medium): Measure: Avg Line Value = average of Qty × UnitPrice across Orders rows.
- Pune share as a measure (Hard): Measure: Pune Share = Pune sales value divided by all sales value. Sales value = SUMX of Qty × UnitPrice. Use DIVIDE.
- Days to deliver column (Hard): Calculated column on Orders: Days to Deliver = number of days from OrderDate to DeliveredDate (blank stays blank).
 Revision card