13. DAX: Data Analysis Expressions
13.12 USERELATIONSHIP in Power BI DAX with Example
Quick answer: the short, self-contained version of this lesson is the guide DAX USERELATIONSHIP for Inactive Relationships.
USERELATIONSHIP in Power BI with example — in 30 seconds
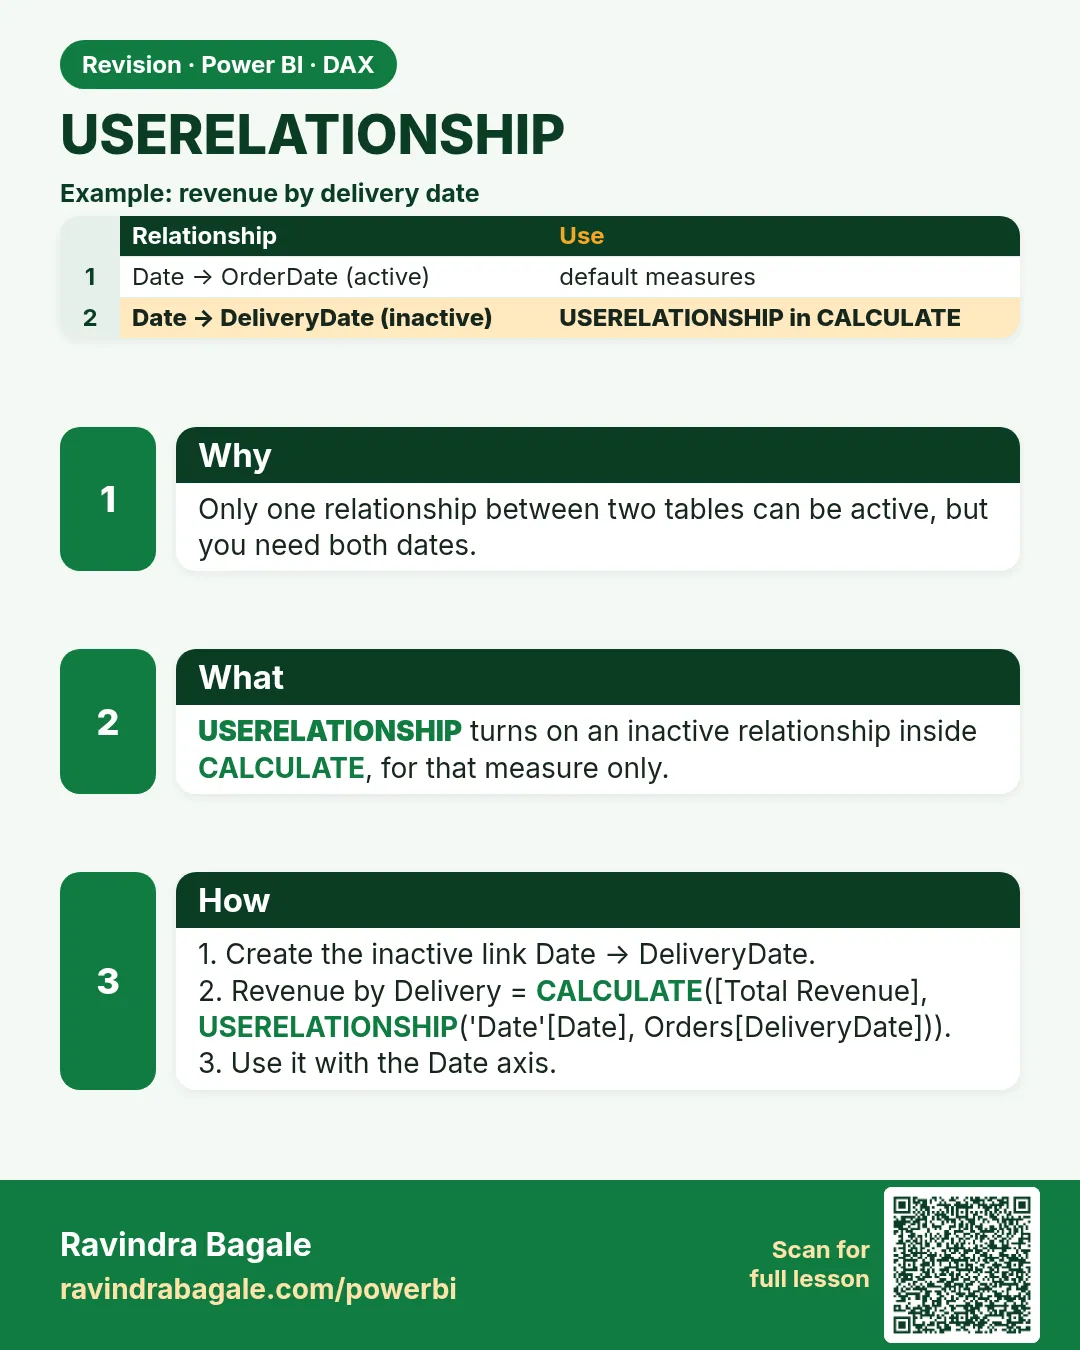
What: USERELATIONSHIP turns on an inactive (dotted) relationship for one measure.
Why: An order placed on 31 March at 11:55 pm may be delivered on 1 April. Finance books it by delivered date.
Tiny example: By order date, 31-Mar = ₹800. By delivered date, 31-Mar = ₹300 and 1-Apr = ₹500.
USERELATIONSHIP in Power BI with example — 30 सेकंदात
काय: USERELATIONSHIP एका measure साठी inactive (dotted) relationship चालू करतो.
का: 31 March ला रात्री 11:55 ला दिलेली order 1 April ला deliver होऊ शकते. Finance ती delivered date ने मोजतं.
छोटं उदाहरण: Order date ने 31-Mar = ₹800. Delivered date ने 31-Mar = ₹300 आणि 1-Apr = ₹500.
USERELATIONSHIP in Power BI with example — 30 सेकंड में
क्या: USERELATIONSHIP एक measure के लिए inactive (dotted) relationship चालू करता है.
क्यों: 31 March को रात 11:55 पर दी गई order 1 April को deliver हो सकती है. Finance उसे delivered date से गिनता है.
छोटा उदाहरण: Order date से 31-Mar = ₹800. Delivered date से 31-Mar = ₹300 और 1-Apr = ₹500.
First look at the data (before → after):
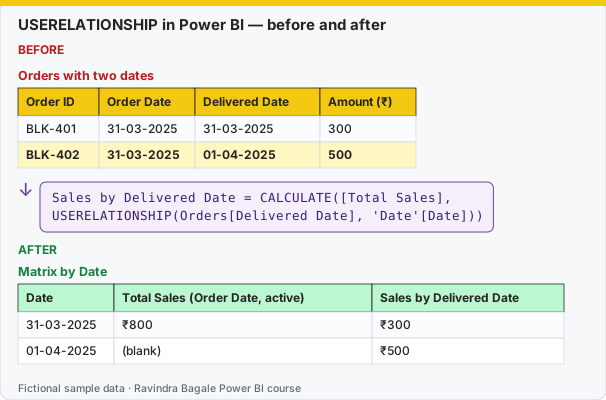
Same before / after tables as text
Before — Orders with two dates
| Order ID | Order Date | Delivered Date | Amount (₹) |
|---|---|---|---|
| BLK-401 | 31-03-2025 | 31-03-2025 | 300 |
| BLK-402 | 31-03-2025 | 01-04-2025 | 500 |
About this data: This table uses columns: Order ID, Order Date, Delivered Date, Amount (₹). This table uses columns: Date, Total Sales (Order Date, active), Sales by Delivered Date. Values shown are the lesson examples already on this page (not a new dataset).
Formula / click path
Sales by Delivered Date = CALCULATE([Total Sales],
    USERELATIONSHIP(Orders[Delivered Date], 'Date'[Date]))
After — Matrix by Date
| Date | Total Sales (Order Date, active) | Sales by Delivered Date |
|---|---|---|
| 31-03-2025 | ₹800 | ₹300 |
| 01-04-2025 | (blank) | ₹500 |
Do it step by step:
- In Model view, check Date[Date] → Orders[Order Date] is solid (active).
- Check Date[Date] → Orders[Delivered Date] is dotted (inactive).
- New measure: Sales by Delivered Date (formula above).
- Matrix: Rows = Date, Values = both measures. Check the table above.
- Notice: 1-Apr is the first day of FY 2025-26. ₹500 moves to the new financial year.
एक-एक step करून बघा:
- Model view मध्ये Date[Date] → Orders[Order Date] solid (active) आहे ना ते तपासा.
- Date[Date] → Orders[Delivered Date] dotted (inactive) आहे ना ते तपासा.
- New measure: Sales by Delivered Date (वरचा formula).
- Matrix: Rows = Date, Values = दोन्ही measures. वरचा table तपासा.
- लक्षात घ्या: 1-Apr हा FY 2025-26 चा पहिला दिवस. ₹500 नवीन financial year मध्ये जातात.
एक-एक step करके देखिए:
- Model view में Date[Date] → Orders[Order Date] solid (active) है या नहीं, जाँचिए.
- Date[Date] → Orders[Delivered Date] dotted (inactive) है या नहीं, जाँचिए.
- New measure: Sales by Delivered Date (ऊपर वाला formula).
- Matrix: Rows = Date, Values = दोनों measures. ऊपर की table जाँचिए.
- ध्यान दीजिए: 1-Apr FY 2025-26 का पहला दिन है. ₹500 नए financial year में चले जाते हैं.
Activates an inactive relationship for one calculation. It only works inside CALCULATE (or CALCULATETABLE).
Sales by Delivered Date =
CALCULATE([Total Sales], USERELATIONSHIP(Orders[Delivered Date], 'Date'[Date]))

Orders Delivered (by delivery date) =
CALCULATE([Delivered Orders], USERELATIONSHIP(Orders[Delivered Date], 'Date'[Date]))
Put Date on the axis and show [Delivered Orders] and [Orders Delivered (by delivery date)] side by side: the small differences come from orders placed just before midnight and delivered the next day.
Ravindra Bagale's Tip
Friends, many students create a second active relationship, Power BI makes it inactive, and then they think the relationship "doesn't work". That is by design: only one active path is allowed. Use USERELATIONSHIP inside CALCULATE for measures such as Sales by Delivered Date. Try it once more, then move on.
Ravindra Bagale's Tip – मराठी
मित्रांनो, बरेच students दुसरी active relationship बनवतात, Power BI ती inactive करतो, आणि मग त्यांना वाटतं relationship "चालत नाही". हे मुद्दाम तसंच आहे: फक्त एकच active path चालतो. Sales by Delivered Date सारख्या measures साठी CALCULATE मध्ये USERELATIONSHIP वापरा. पुन्हा एकदा करून बघा, मग पुढे जा.
Ravindra Bagale's Tip – हिंदी
दोस्तों, बहुत से students दूसरी active relationship बनाते हैं, Power BI उसे inactive कर देता है, और फिर उन्हें लगता है कि relationship "काम नहीं करती". यह जानबूझकर ऐसा है: सिर्फ़ एक active path चलता है. Sales by Delivered Date जैसे measures के लिए CALCULATE के अंदर USERELATIONSHIP इस्तेमाल करो. एक बार फिर करके देखो, फिर आगे बढ़ो.
Loading DAX practice tasks...
- Sales by order date (Easy): Shown per FY. Measure: Order Sales that simply reuses the Total Sales measure.
- Sales by delivery date (Easy): Shown per FY. Measure: Delivered Sales = [Total Sales] using the DeliveredDate relationship.
- Delivered units (Easy): Shown per FY. Measure: Delivered Qty = [Total Qty] using the delivery date.
- Delivered sales this FY (Medium): Slicer: FY 2025-26. Measure: Delivered Sales = [Total Sales] by delivery date.
- Delivered orders per quarter (Medium): Slicer: FY 2024-25. Shown per FYQuarter. Measure: Delivered Orders = [Total Orders] by delivery date.
- Average delivery minutes by delivery FY (Medium): Shown per FY. Measure: Delivered Avg Mins = average of DeliveryMins using the delivery date.
- Late deliveries (Medium): Measure: Next Day Deliveries = number of Orders rows where DeliveredDate is after OrderDate.
- Pune deliveries by FY (Hard): Shown per FY. Measure: Pune Delivered = [Total Sales] for City "Pune" using the delivery date.
- Delivered sales per city this FY (Hard): Slicer: FY 2025-26. Shown per Store City. Measure: Delivered Sales = [Total Sales] by delivery date.
- Delivered units in March (Hard): Slicers: FY 2024-25 and Month Mar. Measure: Delivered Qty = [Total Qty] by delivery date.
 Revision card