13. DAX: Data Analysis Expressions
13.3 Filter Context and Row Context in Power BI with Example
Quick answer: the short, self-contained version of this lesson is the guide DAX Row Context vs Filter Context.
Filter context in Power BI with example — in 30 seconds
What: Filter context is the set of filters on a visual cell: slicers, rows, columns, page filters and RLS.
Why: The same measure shows a different number in every cell. That is filter context at work.
Tiny example: [Total Sales] = ₹1,500 for all. In the Pune row it shows ₹1,200. In the Nashik row it shows ₹300.
Filter context in Power BI with example — 30 सेकंदात
काय: Filter context म्हणजे visual च्या एका cell वरचे सगळे filters: slicers, rows, columns, page filters आणि RLS.
का: तोच measure प्रत्येक cell मध्ये वेगळा number दाखवतो. हेच filter context चं काम.
छोटं उदाहरण: सगळ्यांसाठी [Total Sales] = ₹1,500. Pune row मध्ये ₹1,200 दिसतो. Nashik row मध्ये ₹300.
Filter context in Power BI with example — 30 सेकंड में
क्या: Filter context यानी visual के एक cell पर लगे सारे filters: slicers, rows, columns, page filters और RLS.
क्यों: वही measure हर cell में अलग number दिखाता है. यही filter context का काम है.
छोटा उदाहरण: सबके लिए [Total Sales] = ₹1,500. Pune row में ₹1,200 दिखता है. Nashik row में ₹300.
First look at the data (before → after):
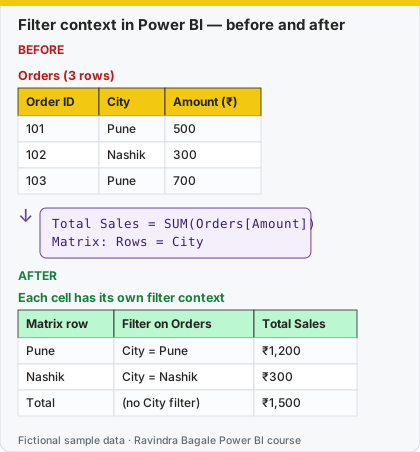
Same before / after tables as text
Before — Orders (3 rows)
| Order ID | City | Amount (₹) |
|---|---|---|
| 101 | Pune | 500 |
| 102 | Nashik | 300 |
| 103 | Pune | 700 |
About this data: This table uses columns: Order ID, City, Amount (₹). This table uses columns: Matrix row, Filter on Orders, Total Sales. This table uses columns: Wrong result, Reason, Correction. Values shown are the lesson examples already on this page (not a new dataset).
Formula / click path
Total Sales = SUM(Orders[Amount])
Matrix: Rows = City
After — Each cell has its own filter context
| Matrix row | Filter on Orders | Total Sales |
|---|---|---|
| Pune | City = Pune | ₹1,200 |
| Nashik | City = Nashik | ₹300 |
| Total | (no City filter) | ₹1,500 |
Do it step by step:
- Create the measure
Total Sales = SUM(Orders[Amount]). - Add a Matrix. Put City in Rows and Total Sales in Values.
- Read each row. Ask: which rows of Orders survive here?
- Add a City slicer. Select Pune. The total row now shows ₹1,200.
एक-एक step करून बघा:
- Measure बनवा:
Total Sales = SUM(Orders[Amount]). - एक Matrix टाका. Rows मध्ये City आणि Values मध्ये Total Sales.
- प्रत्येक row वाचा. स्वतःला विचारा: Orders च्या कोणत्या rows इथे उरल्या?
- एक City slicer टाका. Pune निवडा. Total row आता ₹1,200 दाखवते.
एक-एक step करके देखिए:
- Measure बनाइए:
Total Sales = SUM(Orders[Amount]). - एक Matrix लगाइए. Rows में City और Values में Total Sales.
- हर row पढ़िए. ख़ुद से पूछिए: Orders की कौन-सी rows यहाँ बचीं?
- एक City slicer लगाइए. Pune चुनिए. Total row अब ₹1,200 दिखाती है.
To master DAX you must understand context — the environment in which a formula is calculated. (Devanagari only for the abstract word: संदर्भ.)
Start with a problem
Shraddha manages fictional dark stores in Nashik. Ravindra manages Pune. Rani (operations) opens a report with three practice orders:
| Order ID | City | Amount (₹) |
|---|---|---|
| 101 | Pune | 500 |
| 102 | Nashik | 300 |
| 103 | Pune | 700 |
She asks: Why does the card show ₹1,500, the Pune bar ₹1,200, and the Nashik bar ₹300 — from the same measure? That difference is filter context. When a student puts SUM(Orders[Amount]) inside a calculated column and every row shows ₹1,500, that is missing row vs filter clarity. When [Total Sales] on the Customer table suddenly shows each customer's own sales, that is context transition.
Explain simply
- Row context: "Which row am I on?" Exists in calculated columns and inside iterators (
SUMX,FILTER, …). - Filter context: "Which filters are on?" Comes from visuals, slicers, Filters pane, RLS, and
CALCULATEarguments. - Context transition:
CALCULATE(and every measure call) can turn the current row into equivalent filters so aggregations see only related rows.
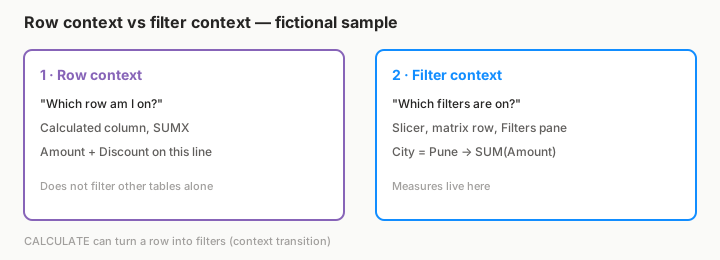
Show the data
Same three orders (fictional). Hand math:
- All → 500+300+700 = 1,500
- Pune → 500+700 = 1,200
- Nashik → 300
Practice file: src/practice/filter_context_orders.csv.
Demonstrate — user demo + visual filters
- Enter data or load
filter_context_orders.csvas Orders. - Create measure
Total Sales = SUM(Orders[Amount]). - Add a Card with Total Sales → expect ₹1,500.
- Add a Clustered bar chart: Axis = City, Values = Total Sales.
- Add a Slicer on City. Click Pune → card and Pune bar show ₹1,200; Nashik disappears or dims by highlight settings.
- Open Filters pane › drag City to Filters on this visual › set to Nashik on the bar only → that visual shows ₹300 while the card can stay on All if not filtered.
- Turn on Edit interactions (Format) and set slicer → card to Filter (not merely highlight) so students see intersecting filters clearly.
Intersecting filters
If the page slicer is Platform = Blinkit and the matrix row is City = Pune, the measure sees both filters (AND), unless a CALCULATE filter replaces the City or Platform filter (see 13.8).
Relationships
Filters flow from the one side to the many side along relationships. City on DarkStore filters Orders when DarkStore[Store ID] relates to Orders[Store ID]. No relationship → City slicer does nothing to Total Sales.
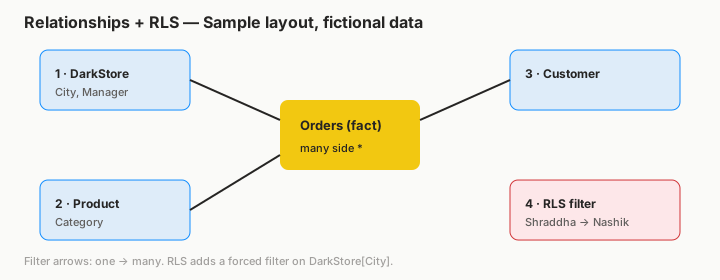
Show the result
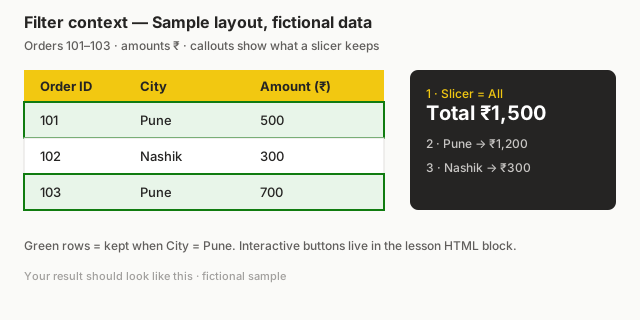
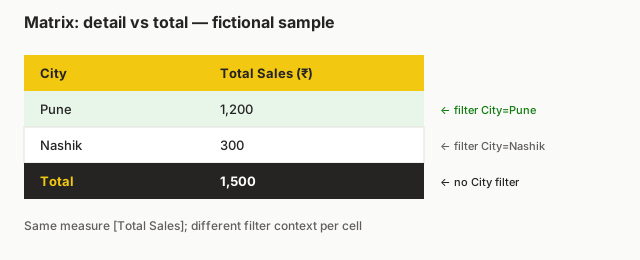
Your result should look like this: All ₹1,500 · Pune ₹1,200 · Nashik ₹300.
Interactive demo (buttons All / Pune / Nashik; Replay tour). Paste works in the site HTML output when the build preserves raw HTML:
Filter context demo — fictional sample
Orders: 101 Pune ₹500 · 102 Nashik ₹300 · 103 Pune ₹700.
All → ₹1,500 | Pune → ₹1,200 | Nashik → ₹300
Use the SVG above in class; click City slicer in Desktop for the live version. Full interactive HTML copy: img/ch13-filter-context-interactive.html.
Explain what happened
For each matrix cell, Power BI applies the row's City as a filter, then evaluates [Total Sales]. The total row has no City filter, so all three orders are included. That is filter context — not a different formula.
Row context
Row context means the current row. It exists automatically in calculated columns, and inside iterator functions like SUMX, AVERAGEX and FILTER, which go through a table row by row.
In Gross Line Value = Orders[Amount] + Orders[Discount], DAX knows which row's Amount to use because of row context.
Row context does not filter
Row context alone does not filter other tables or aggregations. In a calculated column, SUM(Orders[Amount]) returns the grand total on every row, not the row's value.
Filter context
Filter context is the set of filters applied when a measure is calculated. It comes from:
- rows / columns / axis of the visual (e.g. each bar for a City),
- slicers and cross-filtering from other visuals,
- visual, page and report filters in the Filters pane,
- row-level security (RLS),
- filter arguments inside
CALCULATE.
Example: in a matrix with City on rows, the cell for "Pune" computes [Total Sales] with filter City = "Pune". The total row computes it with no City filter.
Context transition
When CALCULATE runs where a row context exists (calculated column or iterator), it turns the current row into an equivalent filter context. Every measure reference is automatically wrapped in CALCULATE, which is why this works:
-- Calculated column in the Customer table
Customer Lifetime Sales = [Total Sales]
Each customer row gets only that customer's sales, because the row becomes a filter on Customer (and then to Orders through the relationship).
Explore further
- Test every measure in a matrix by City and Month, not only in a card.
- RLS is an extra forced filter — View as Shraddha should hide Pune rows.
KEEPFILTERSintersects instead of replacing (Module 13.21 / 13.8).
Fix common mistakes
| Wrong result | Reason | Correction |
|---|---|---|
| Same value on every matrix row | Missing relationship or wrong cross-filter direction | Fix model; check Manage relationships |
Column SUM(Amount) = grand total each row |
No filter context in a bare column | Use row fields, or CALCULATE([Total Sales]) for transition |
| Slicer does nothing | Field from disconnected table | Relate tables or use TREATAS (advanced) |
| Card ≠ sum of visible bars | Interactions set to highlight only / visual filter mismatch | Edit interactions → Filter; align Filters pane |
Practise independently
Practice task
Load src/practice/filter_context_orders.csv. Build card + City slicer + matrix. Write the three totals before looking at answers. Then add a page filter City = Pune and predict the card.
Hints
- Hand totals first: 1500 / 1200 / 300.
- Measure must be
SUM(Orders[Amount]), not a column of totals.
Solution
All = 1500, Pune = 1200, Nashik = 300. Page filter Pune → card 1200. See src/practice/ANSWERS.md.
Think like a professional
In interviews, draw the three-order table and show how one measure yields three numbers. For maintenance: document which dimension filters the fact. For performance: narrow filter columns (City, Date) beat filtering high-cardinality text on the fact. Context transition inside iterators on large tables can be expensive — prefer measures over heavy calculated columns on facts.
Ravindra Bagale's Tip
A common mistake is testing a measure only in a card, where the only filters are the slicers. Put it in a table by City and Month to see how it changes with each row's filter context. If every row shows the same value, a relationship or filter is missing. It's very simple – just make it a habit.
Ravindra Bagale's Tip – मराठी
एक common चूक म्हणजे measure फक्त card मध्ये test करणं, जिथे फक्त slicers चेच filters असतात. प्रत्येक row च्या filter context नुसार तो कसा बदलतो ते बघण्यासाठी तो City आणि Month नुसार table मध्ये टाका. प्रत्येक row वर सारखीच value दिसली तर एखादी relationship किंवा filter missing आहे. एकदम simple आहे, फक्त सवय लावून घ्या.
Ravindra Bagale's Tip – हिंदी
एक common गलती है measure को सिर्फ़ card में test करना, जहाँ सिर्फ़ slicers के filters होते हैं. हर row के filter context के साथ वह कैसे बदलता है यह देखने के लिए उसे City और Month के हिसाब से table में डालो. अगर हर row पर एक ही value दिखे तो कोई relationship या filter missing है. बहुत आसान है, बस आदत बना लो.
Loading DAX practice tasks...
- Units with a city slicer (Easy): A slicer is set to Store City = Pune (the box applies it). Write Total Qty = SUM of Orders[Qty].
- Units by city (Easy): The box shows a table with one row per Store City. Write Total Qty = SUM of Orders[Qty] and see each city get its own number.
- Order lines for Zepto (Easy): Slicer: Orders Platform = Zepto. Write Lines = COUNTROWS of Orders.
- Sales value by category (Medium): Table by Product Category. Measure Sales = SUMX over Orders of Qty × UnitPrice.
- Two slicers at once (Medium): Slicers: Store City = Mumbai and Platform = Blinkit. Measure Sales = SUMX over Orders of Qty × UnitPrice.
- Customers by segment (Medium): Table by Customer Segment. Measure Buyers = number of different CustomerID values in Orders.
- Average delivery by store city (Medium): Table by Store City. Measure Avg Delivery = average of Orders[DeliveryMins].
- City sales ignoring the slicer (Hard): Slicer: Store City = Nashik. Measure All City Sales = sales value (SUMX Qty × UnitPrice) for ALL cities, ignoring the slicer.
- Premium buyers by city (Hard): Table by Store City. Measure Premium Lines = number of Orders rows where Customer Segment is "Premium".
- Big lines with row context (Hard): Measure Big Lines = number of Orders rows where Qty × UnitPrice is more than 500.
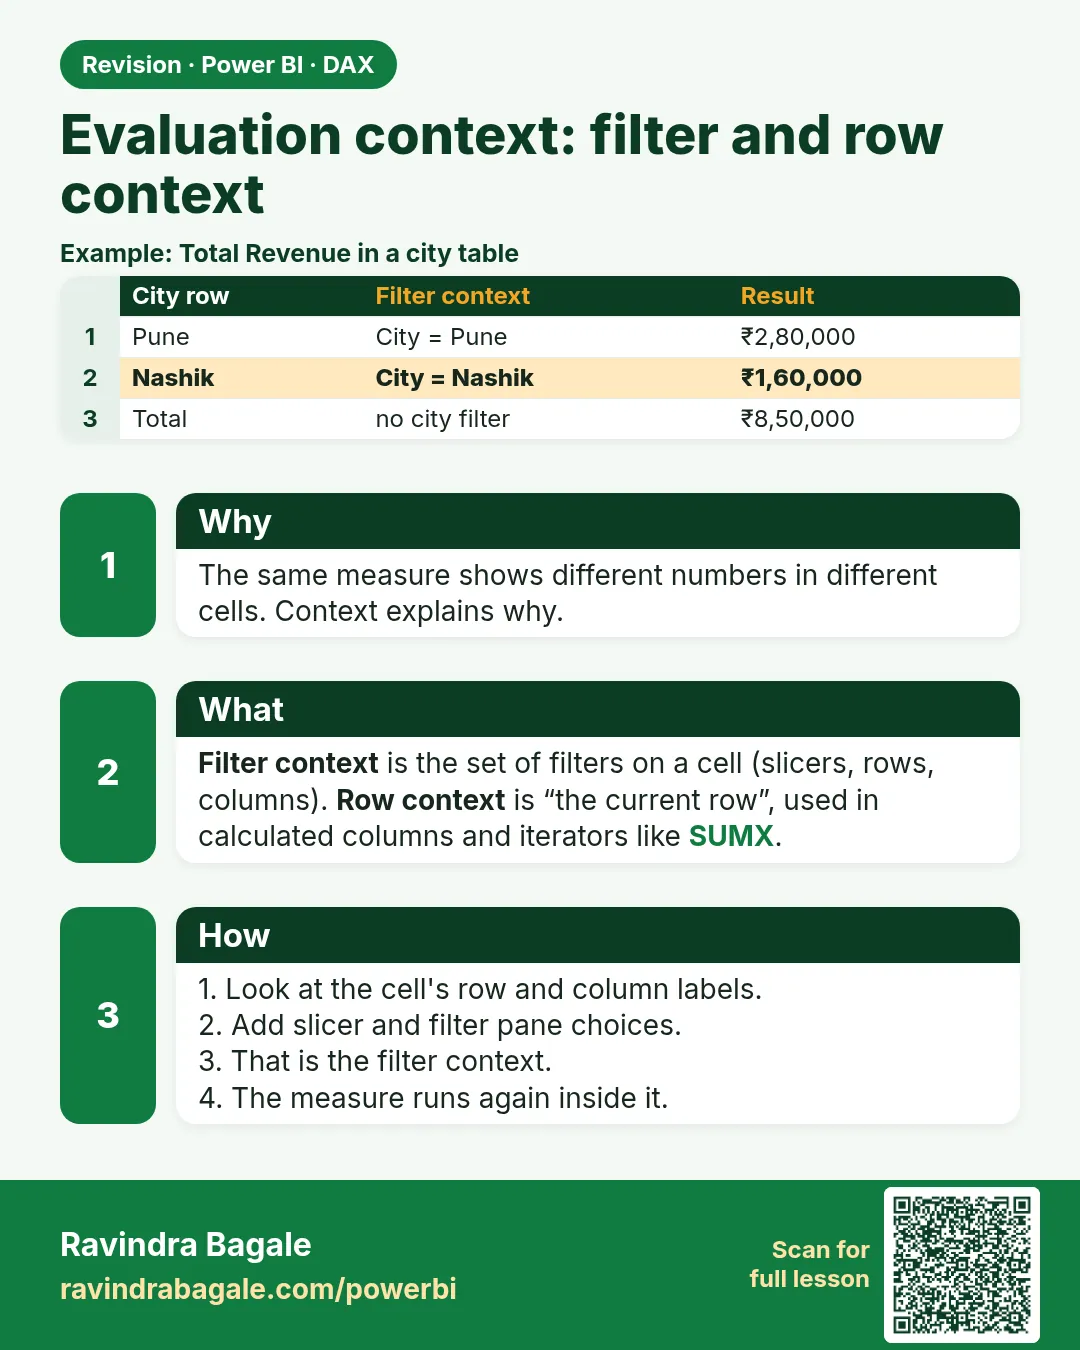 Revision card
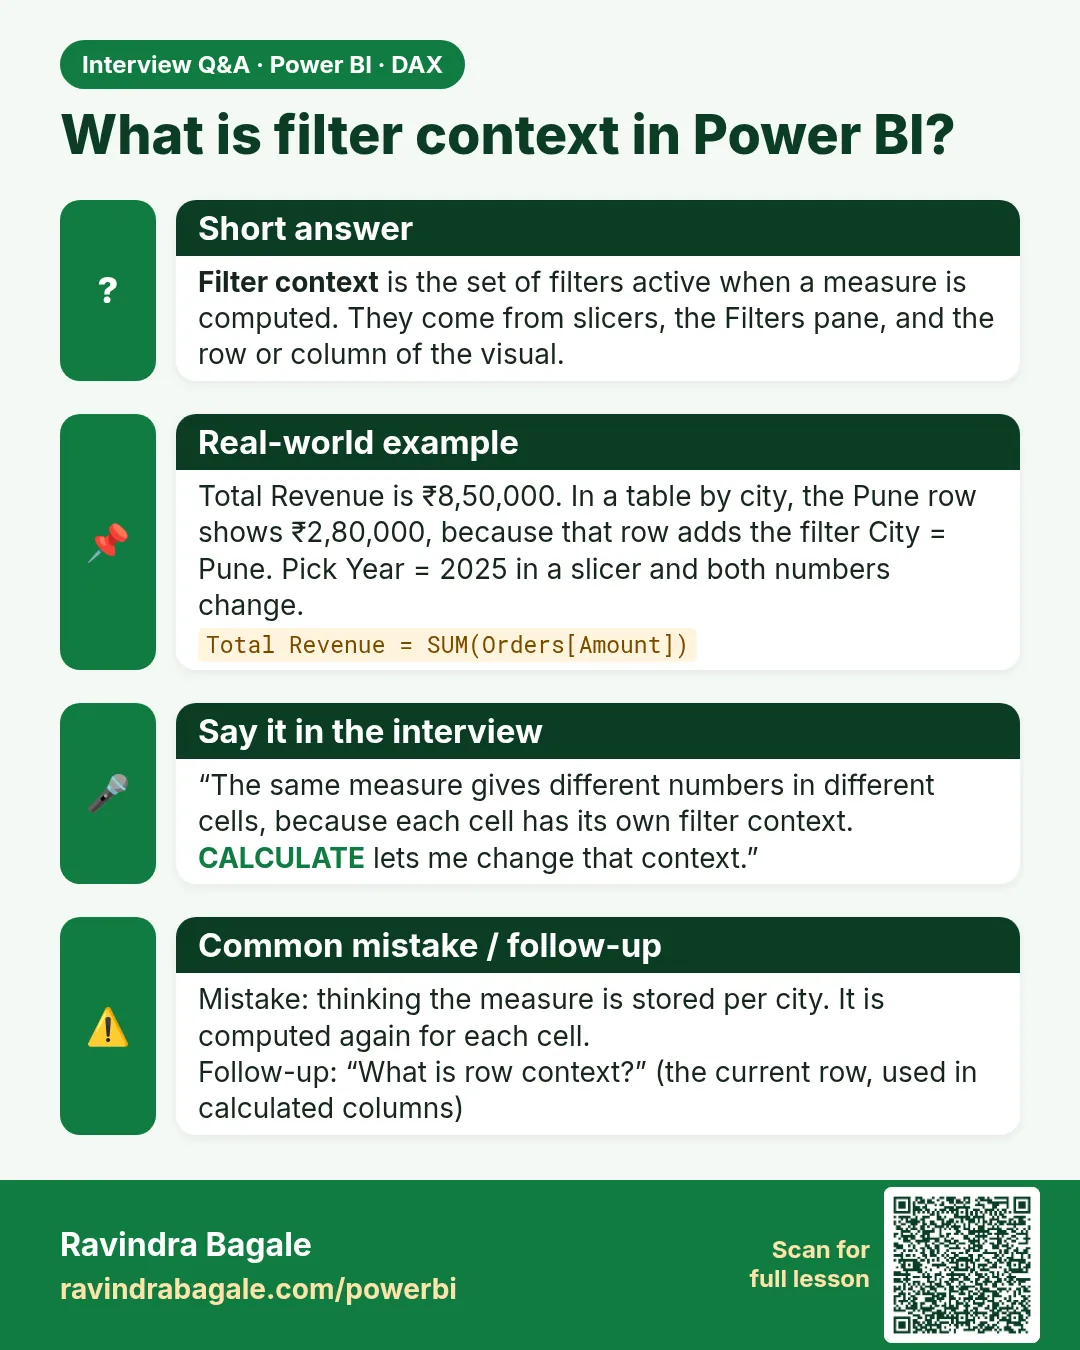 Interview card