25.4 Reports vs Dashboards
Start with a problem
Zoya hears report and dashboard used for the same thing and is confused.
Explain simply
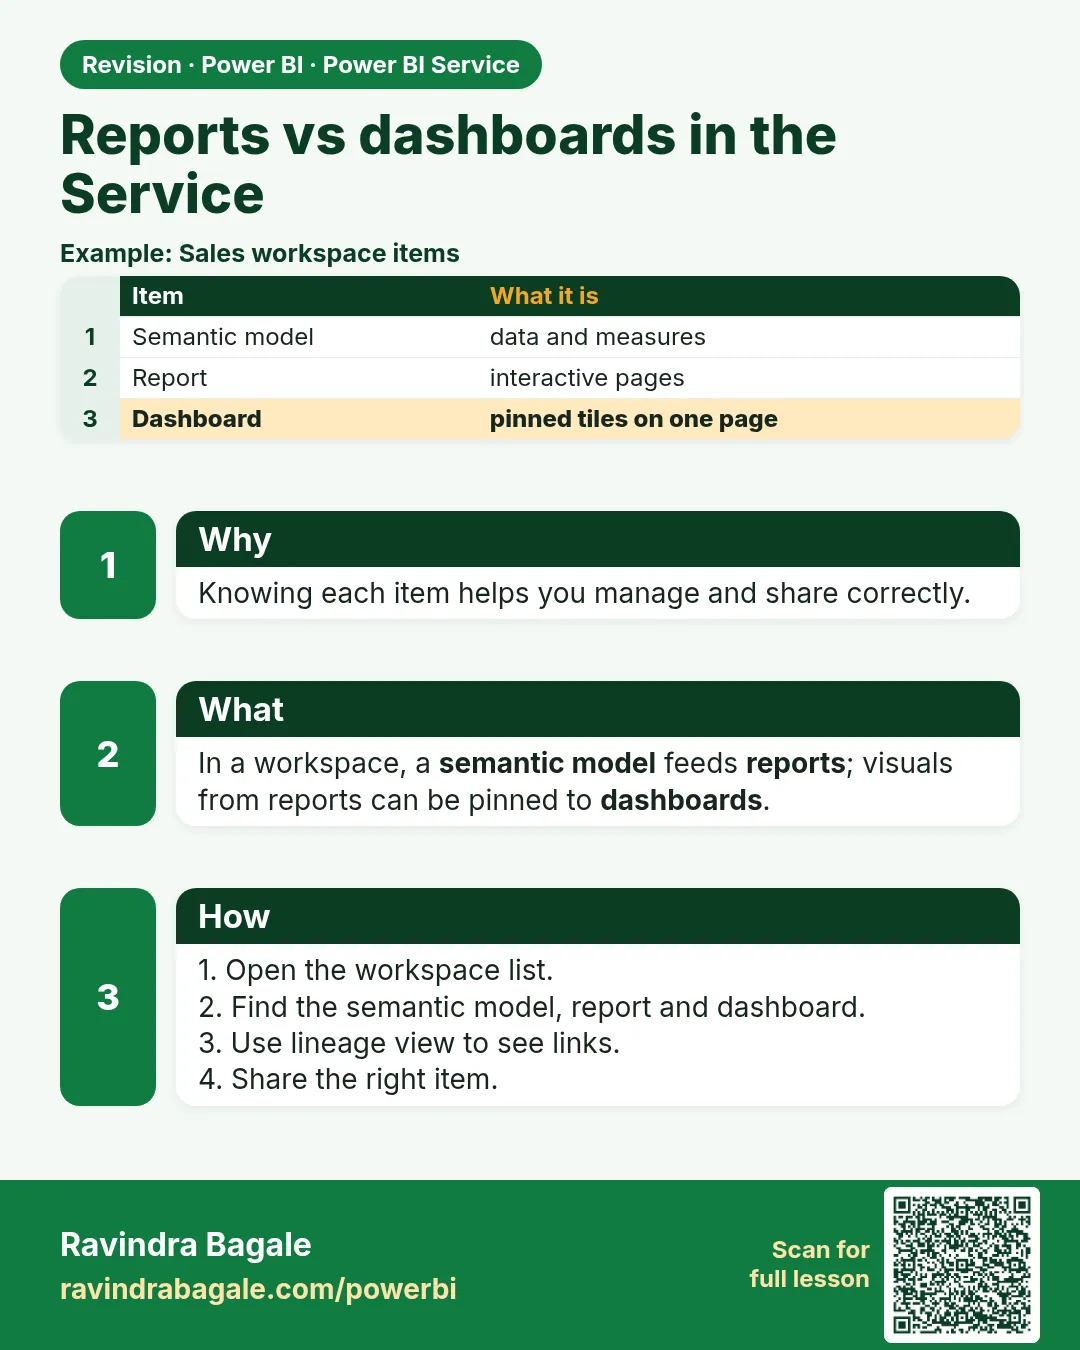
A report has one or more pages of interactive visuals from one semantic model. A dashboard (Service only) is one canvas of pinned tiles that can come from many reports.
Show the data
| Feature | Report | Dashboard |
|---|---|---|
| Pages | Many | One |
| Slicers | Yes | No |
| Sources | One model | Many reports |
| Alerts on cards | No | Yes |
About this data: This table uses columns: Feature, Report, Dashboard. This table uses columns: Item, Shows. This table uses columns: Wrong result, Reason, Correction. Values shown are the lesson examples already on this page (not a new dataset).
Fictional sample data. Practice file: visuals_orders_apr_may_2026.csv (source: src/practice/).
Demonstrate
- Open the report, hover the ₹2,100 card.
- Click the pin icon › New dashboard Daily KPIs.
- Open the dashboard and click the tile.
Show the result
Your result should look like this (fictional sample):
| Item | Shows |
|---|---|
| Dashboard tile | ₹2,100 Total Sales |
| Click tile | Opens the report page |
Explain what happened
Pinning copies a visual as a tile linked back to the report.
Explore further
- Data alerts need dashboard tiles (25.8).
Detailed reference for this lesson:
Module 24 covers reports vs dashboards in full: the comparison table, pinning visuals and live pages, Q&A tiles, tile details, alerts and mobile layouts.
Ravindra Bagale's Tip
Friends, many students confuse reports and dashboards in the Service. The full comparison is in Module 24.1. Remember that reports are interactive and multi-page, while dashboards are single-page tile collections pinned from reports. Keep this in mind!
Ravindra Bagale's Tip – मराठी
मित्रांनो, बरेच students Service मध्ये reports आणि dashboards मध्ये गल्लत करतात. पूर्ण तुलना Module 24.1 मध्ये आहे. लक्षात ठेवा, reports interactive आणि अनेक pages चे असतात, तर dashboards म्हणजे reports मधून pin केलेल्या tiles चं एकच page. लक्षात ठेवा!
Ravindra Bagale's Tip – हिंदी
दोस्तों, बहुत से students Service में reports और dashboards को आपस में मिला देते हैं. पूरी तुलना Module 24.1 में है. याद रखो, reports interactive और कई pages वाली होती हैं, जबकि dashboards reports से pin की गई tiles का एक page होते हैं. ध्यान रखना!
Fix common mistakes
| Wrong result | Reason | Correction |
|---|---|---|
| Looking for slicers on a dashboard | Dashboards do not have slicers | Use the report |
| Tile not updated | Tile cache | Refresh dashboard tiles |
| Calling a report a dashboard in an interview | Terms mixed | Use the right term |
Practise independently
Practice task
Where can you set a data alert?
Hints
- Tile.
Solution
On a dashboard card/KPI/gauge tile.
Think like a professional
Use precise terms; it signals experience.
Deepen this topic (Why / What / How)
Fictional Maharashtra example. Numbers and workspace names below are practice data only.
Why: Teams pin everything to a dashboard and lose drill-through and bookmarks.
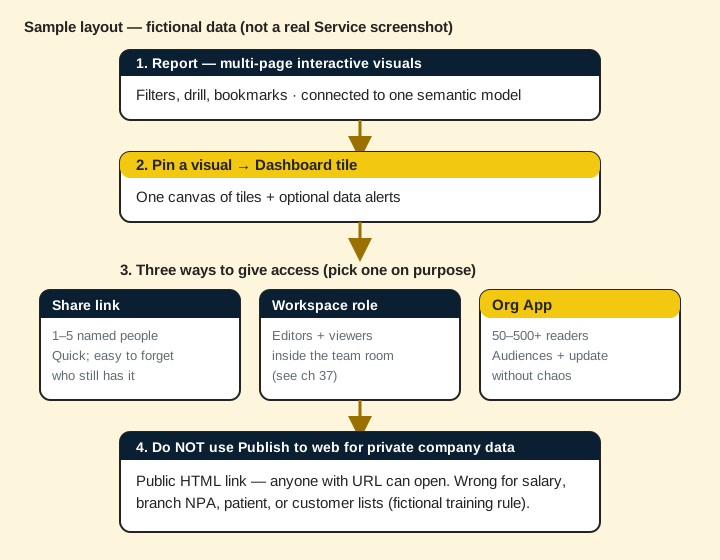
What: Reports are multi-page interactive; dashboards are a canvas of pinned tiles (often with alerts).
How — choose the right canvas:
Vertical steps (one under another)
- Use a report for analysis (filters, drill-through, bookmarks).
- Pin only KPI tiles that need a glance or data alert.
- Prefer an App for packaged distribution (Ch 38).
- Do not rebuild the whole report as one giant dashboard.
- Read Ch 38 for sharing paths and Apps.
Tiny example: Fictional: Page 1 report for standup; one dashboard tile for Cancel % alert.
Ravindra Bagale's Tip
Friends, dashboards are for glance + alert; reports are for thinking.
Ravindra Bagale's Tip – मराठी
मित्रांनो, dashboard = झटपट नजर + alert; report = विचार.
Ravindra Bagale's Tip – हिंदी
दोस्तों, dashboard = झटपट नज़र + alert; report = सोच।
Go deeper next
This Chapter 25 page is the overview. For the full Service deep lesson, open Ch 38 · Reports vs Dashboards, Sharing and Apps. Chapters 37–44 are the deep Service series; Chapter 44 is the publish–secure–refresh–share capstone.
Quiz (5 questions)
1. Interactive multi-page analysis belongs in a:
2. Classic data alerts need:
3. Apps are mainly for:
4. Pin every visual to a dashboard:
5. Deep sharing/Apps chapter:
Practice tasks (12) — hints only, no full answers
- Task. Write the business question this 25 4 reports vs dashboards page answers in one sentence.
Hint: Name the user and the decision. - Task. List three mistakes learners make with 25 4 reports vs dashboards.
Hint: Use Fix common mistakes as a seed. - Task. Draw a 5-box flow on paper for 25 4 reports vs dashboards (fictional MH Ops).
Hint: Photo counts as artefact. - Task. Explain 25 4 reports vs dashboards to a friend in 60 seconds using Why/What/How.
Hint: Record voice memo if you can. - Task. Open the linked deep chapter and write three new facts not on this overview page.
Hint: Cite section titles only. - Task. Create a checklist of 7 ticks before you call 25 4 reports vs dashboards “done”.
Hint: Include a verify step. - Task. Invent fictional refresh/share/role data that fits 25 4 reports vs dashboards.
Hint: Keep IST times. - Task. Map who is Admin / Member / Contributor / Viewer for a fictional workspace using 25 4 reports vs dashboards.
Hint: Least privilege. - Task. Write an interview STAR story that uses 25 4 reports vs dashboards.
Hint: 45–60 seconds. - Task. Find one unused habit you will stop (e.g. My workspace for team content) related to 25 4 reports vs dashboards.
Hint: Be specific. - Task. Link 25 4 reports vs dashboards forward to the correct Ch 37–44 lesson and say why.
Hint: One sentence why. - Task. Teach 25 4 reports vs dashboards back using Marathi or Hindi tip language once.
Hint: Keep English terms for product UI.
 Revision card