14. Visuals and Their Formatting
14.1 Creating a Visual Step by Step
Start with a problem
Rani runs operations for a fictional quick-commerce brand in Pune, Nashik and Kolhapur. On Monday at 9:00 IST she asks Shahrukh one question: which city sold the most last week? He has the order export, but nothing on the report canvas yet.
Explain simply
A visual is a chart, table or card built from fields. You choose the visual type first, then drop fields into its field wells – the boxes in the Build pane called X-axis, Y-axis, Legend, Values and so on. A field in Y-axis is summed (aggregated – many rows combined into one number) for each item on the X-axis.
Show the data
| Order ID | Order Date | City | Store | Platform | Category | Amount (₹) | Delivery mins | Status |
|---|---|---|---|---|---|---|---|---|
| 301 | 06-Apr-2026 | Pune | Kothrud | Blinkit | Dairy | 400 | 8 | Delivered |
| 302 | 06-Apr-2026 | Pune | Baner | Amazon Now | Snacks | 200 | 12 | Delivered |
| 303 | 07-Apr-2026 | Nashik | Gangapur | Blinkit | Dairy | 300 | 14 | Delivered |
| 304 | 04-May-2026 | Nashik | College Road | Blinkit | Fruits | 150 | 9 | Delivered |
| 305 | 04-May-2026 | Kolhapur | Rajarampuri | Amazon Now | Snacks | 450 | 7 | Delivered |
| 306 | 05-May-2026 | Pune | Kothrud | Blinkit | Fruits | 250 | 16 | Delivered |
| 307 | 05-May-2026 | Nashik | College Road | Amazon Now | Dairy | 350 | 11 | Delivered |
| 308 | 05-May-2026 | Kolhapur | Rajarampuri | Blinkit | Dairy | 0 | Cancelled |
About this data: This table uses columns: Order ID, Order Date, City, Store, Platform, Category, Amount (₹), Delivery mins, Status. This table uses columns: City, Total Sales (₹). This table uses columns: Wrong result, Reason, Correction. Values shown are the lesson examples already on this page (not a new dataset).
Fictional sample data. Practice file: visuals_orders_apr_may_2026.csv (source: src/practice/).
Demonstrate
- Open Power BI Desktop › Home › Get data › Text/CSV › choose the practice file › Load.
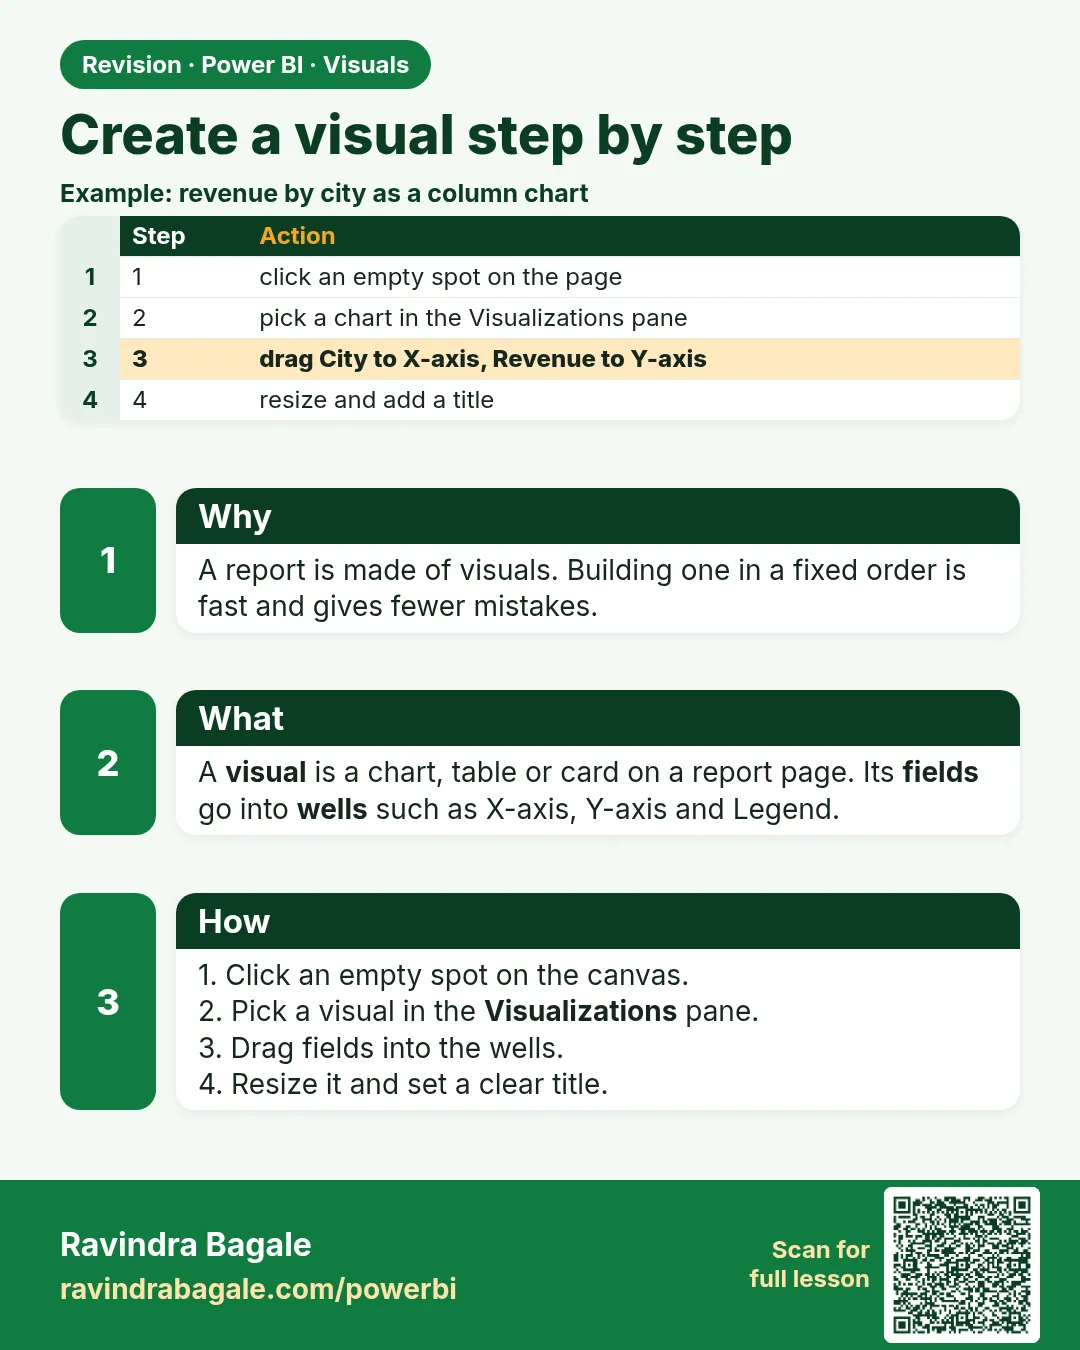
- In the Visualizations pane, click Clustered bar chart. An empty placeholder appears on the canvas.
- From the Data pane, drag
Cityinto Y-axis. Why: one bar per city. - Drag
Amountinto X-axis. Power BI shows Sum of Amount. - Better: Home › New measure ›
Total Sales = SUM(Orders[Amount])› Enter, then replace Sum of Amount withTotal Sales. - Resize the visual by dragging its corner; give it a title in Format visual › General › Title: Total Sales by City.
Show the result
Your result should look like this (fictional sample):
| City | Total Sales (₹) |
|---|---|
| Pune | 850 |
| Nashik | 800 |
| Kolhapur | 450 |
| Total | 2,100 |
Explain what happened
For each bar, Power BI filters the Orders rows to that city, then evaluates Total Sales on only those rows: Pune = 400 + 200 + 250 = 850. The bar order is by value (descending) because the visual sorts by the measure by default.
Explore further
- Swap to a Clustered column chart with one click – the field wells keep your fields.
- Add
Platformto Legend to split each bar (section 14.4).
Detailed reference for this lesson:
Steps in Power BI
- In Report view, click an empty area of the canvas (so no visual is selected).
- In the Visualizations pane, open Build visual (the first icon) and click a visual type, e.g. Clustered column chart. An empty placeholder appears.
- Drag fields from the Data pane into the field wells (for example X-axis =
DarkStore[City], Y-axis =[Total Orders]). Or tick a field in the Data pane and Power BI places it for you. - Resize with the handles and move it by dragging its border. Hold Shift while resizing to keep proportions. Use View › Gridlines / Snap to grid for alignment.
- Open Format visual (the paintbrush icon) to format it (14.2).
- Use More options (…) on the visual header to Sort axis (for example Total Orders, Descending), Show as a table, Export data and Spotlight.
- To change the visual type, select it and click a different icon. Fields are kept where possible.
Ravindra Bagale's Tip
Friends, many students drag fields onto an empty canvas and accept whatever chart Power BI picks. Choose the visual type first, then drop fields into the right wells (X-axis, Y-axis, Legend). Also use your measures, not raw numeric columns, so you don't end up with an implicit "Sum of Amount". Don't worry – after doing it two or three times, it becomes a habit.
Ravindra Bagale's Tip – मराठी
मित्रांनो, बरेच students रिकाम्या canvas वर fields ओढतात आणि Power BI जो chart निवडेल तो स्वीकारतात. आधी visual type निवडा, मग fields योग्य wells मध्ये टाका (X-axis, Y-axis, Legend). आणि raw numeric columns ऐवजी तुमचे measures वापरा, म्हणजे implicit "Sum of Amount" येणार नाही. घाबरू नका, दोन-तीन वेळा केलं की सवय होते.
Ravindra Bagale's Tip – हिंदी
दोस्तों, बहुत से students ख़ाली canvas पर fields खींचते हैं और Power BI जो chart चुने वही मान लेते हैं. पहले visual type चुनो, फिर fields को सही wells में डालो (X-axis, Y-axis, Legend). और raw numeric columns की जगह अपने measures इस्तेमाल करो, ताकि implicit "Sum of Amount" न बने. घबराओ मत, दो-तीन बार करने पर आदत हो जाती है.
Fix common mistakes
| Wrong result | Reason | Correction |
|---|---|---|
| Bars show Count of Amount | The field was set to Count in the well | Click the arrow next to the field in the well › Sum, or use the Total Sales measure |
| All bars are the same length | City came from a table with no relationship to Orders |
Use City from the related table, or fix the relationship in Model view |
| Order ID appears as a huge number | Power BI summed the ID column | Column tools › Summarization › Don't summarize on ID columns |
Practise independently
Practice task
Build a Clustered column chart of Total Sales by Category from the practice file. Write the three values on paper first.
Hints
- Category is on the X-axis for a column chart.
- Dairy has four rows, one of them is ₹0.
Solution
Dairy ₹1,050 (400 + 300 + 350 + 0), Snacks ₹650 (200 + 450), Fruits ₹400 (150 + 250). Total ₹2,100.
Think like a professional
In a job, the first visual you build should answer the manager's sentence, not show off the gallery. Interview tip: say I always create an explicit measure before building visuals, so every chart uses the same definition.
 Revision card