14. Visuals and Their Formatting
14.21 R and Python Visuals, and Custom Visuals from AppSource
Start with a problem
Shahrukh found a custom visual on AppSource and also wants a Python plot for a data science colleague.
Explain simply
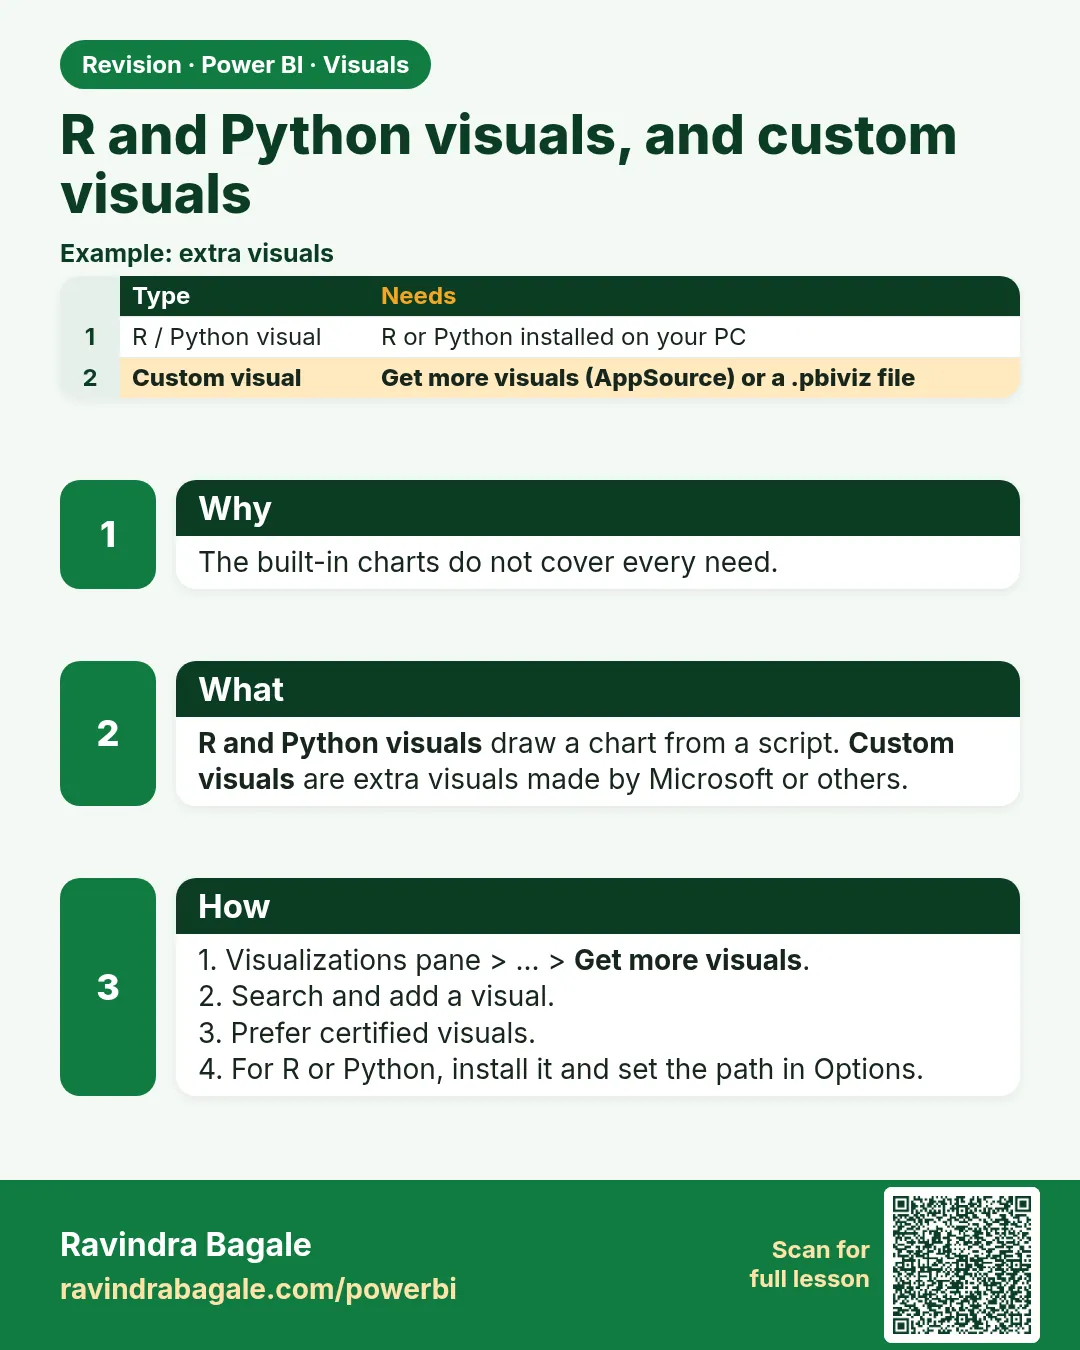
R and Python visuals run a script on a data frame of the fields you add (R/Python must be installed locally). Custom visuals come from AppSource or a file; your organisation may restrict them.
Show the data
| Option | Needs | Note |
|---|---|---|
| Python visual | Python + pandas/matplotlib installed | Script receives dataset |
| R visual | R installed | Script receives dataset |
| AppSource visual | Admin allows it | Check certification |
About this data: This table uses columns: Option, Needs, Note. This table uses columns: City, Bar height. This table uses columns: Wrong result, Reason, Correction. Values shown are the lesson examples already on this page (not a new dataset).
Fictional sample data. Practice file: visuals_orders_apr_may_2026.csv (source: src/practice/).
Demonstrate
- File › Options and settings › Options › Python scripting › set the Python home folder.
- Insert Python visual › enable script visuals when asked.
- Add
CityandAmountto Values. - In the script editor, below the generated lines, type:
dataset.groupby('City')['Amount'].sum().plot(kind='bar')thenimport matplotlib.pyplot as plt; plt.show(). - Click Run script.
Show the result
Your result should look like this (fictional sample):
| City | Bar height |
|---|---|
| Kolhapur | 450 |
| Nashik | 800 |
| Pune | 850 |
Explain what happened
Power BI passes the visual's fields as a pandas DataFrame named dataset (with duplicate rows removed), runs the script, and shows the image it creates.
Explore further
- Script visuals are images – no cross-filtering out of them.
- Prefer certified custom visuals for company reports.
Detailed reference for this lesson:
- R script visual / Python visual (in the Visualizations pane): you write R or Python code that draws a chart (e.g. a violin plot of delivery times). They require R/Python installed locally (File › Options › R scripting / Python scripting), render as images (limited interactivity), and have limits in the Service. Use them only when no built-in visual fits.
- Custom visuals (AppSource): Visualizations pane › … (Get more visuals) › Get more visuals › search (for example "Box and whisker", "Gantt", "Sankey") › Add. Or Import a visual from a file (.pbiviz). In organisations, prefer certified visuals and follow your admin's policy. Some visuals send data outside or need a licence.
Ravindra Bagale's Tip
Friends, many students add custom visuals from unknown publishers without checking them, and some organisations block them in the Service. Prefer certified visuals from AppSource, check your organisation's policy, and remember that R and Python visuals need supported runtimes in the Service. Don't worry – after doing it two or three times, it becomes a habit.
Ravindra Bagale's Tip – मराठी
मित्रांनो, बरेच students अनोळखी publishers चे custom visuals चेक न करता जोडतात, आणि काही organisations Service मध्ये ते block करतात. AppSource वरचे certified visuals वापरा, तुमच्या organisation ची policy चेक करा, आणि लक्षात ठेवा की R आणि Python visuals ना Service मध्ये supported runtimes लागतात. घाबरू नका, दोन-तीन वेळा केलं की सवय होते.
Ravindra Bagale's Tip – हिंदी
दोस्तों, बहुत से students अनजान publishers के custom visuals बिना check किए जोड़ देते हैं, और कुछ organisations Service में उन्हें block करती हैं. AppSource के certified visuals चुनो, अपनी organisation की policy check करो, और याद रखो कि R और Python visuals को Service में supported runtimes चाहिए. घबराओ मत, दो-तीन बार करने पर आदत हो जाती है.
Fix common mistakes
| Wrong result | Reason | Correction |
|---|---|---|
| Error: Python not found | Python home not set | Set it in Options › Python scripting |
| Totals smaller than expected | Duplicate rows removed in dataset |
Add Order ID to keep rows unique |
| Visual blocked in the Service | Tenant settings | Ask the admin; use a native visual |
Practise independently
Practice task
Without running Python, predict the bar for Pune if Order ID is not added and two Pune rows had identical City and Amount.
Hints
- Power BI removes duplicate rows before passing
dataset.
Solution
Identical rows would be counted once, so the total would be too small. Adding Order ID keeps every row. (In this file Pune rows have different amounts, so Pune shows ₹850.)
Think like a professional
Use script visuals for special analysis, not core KPIs; they are harder to maintain and to secure. Interviewers like hearing that you know the deduplication trap.
 Revision card