14. Visuals and Their Formatting
14.17 Table
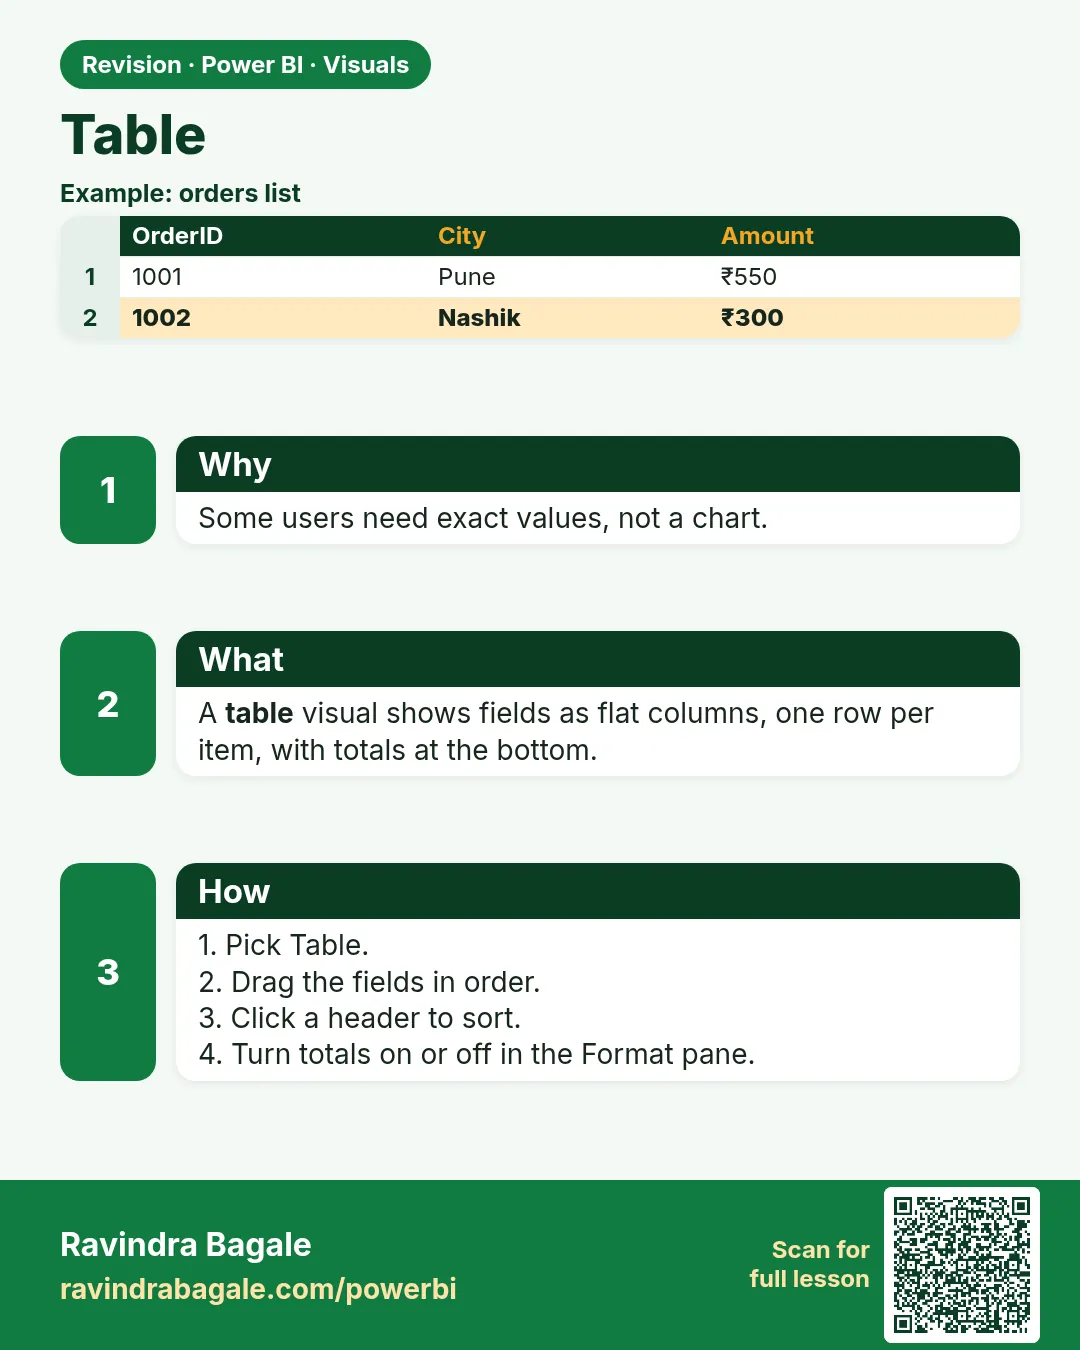
In short: A table visual shows rows and columns of values, like a list.
Start with a problem
Ravina, a store auditor, needs the exact order list for Kolhapur – including the cancelled order.
Explain simply
A table visual shows rows and columns of values, like a list. Use it when people must read exact values.
Show the data
| Order ID | Order Date | City | Store | Platform | Category | Amount (₹) | Delivery mins | Status |
|---|---|---|---|---|---|---|---|---|
| 301 | 06-Apr-2026 | Pune | Kothrud | Blinkit | Dairy | 400 | 8 | Delivered |
| 302 | 06-Apr-2026 | Pune | Baner | Amazon Now | Snacks | 200 | 12 | Delivered |
| 303 | 07-Apr-2026 | Nashik | Gangapur | Blinkit | Dairy | 300 | 14 | Delivered |
| 304 | 04-May-2026 | Nashik | College Road | Blinkit | Fruits | 150 | 9 | Delivered |
| 305 | 04-May-2026 | Kolhapur | Rajarampuri | Amazon Now | Snacks | 450 | 7 | Delivered |
| 306 | 05-May-2026 | Pune | Kothrud | Blinkit | Fruits | 250 | 16 | Delivered |
| 307 | 05-May-2026 | Nashik | College Road | Amazon Now | Dairy | 350 | 11 | Delivered |
| 308 | 05-May-2026 | Kolhapur | Rajarampuri | Blinkit | Dairy | 0 | Cancelled |
About this data: This table uses columns: Order ID, Order Date, City, Store, Platform, Category, Amount (₹), Delivery mins, Status. This table uses columns: Order ID, Store, Status, Amount (₹). This table uses columns: Wrong result, Reason, Correction. Values shown are the lesson examples already on this page (not a new dataset).
Fictional sample data. Practice file: visuals_orders_apr_may_2026.csv (source: src/practice/).
Demonstrate
- Insert Table.
- Add
Order ID,City,Store,Status,Amount. - Set
Order IDto Don't summarize so each order shows. - Add a City slicer and select Kolhapur.
Show the result
Your result should look like this (fictional sample):
| Order ID | Store | Status | Amount (₹) |
|---|---|---|---|
| 305 | Rajarampuri | Delivered | 450 |
| 308 | Rajarampuri | Cancelled | 0 |
| Total | 450 |
Explain what happened
Each unique combination of the non-summarised columns becomes a row. Amount is summed per row and in the total.
Explore further
- Turn on Show items with no data to see combinations with no rows.
- Conditional formatting (Module 20.6) can flag cancelled rows.
Detailed reference for this lesson:
Shows detailed rows and exact numbers.
- Field wells: Columns.
- Example: Order ID, Order DateTime, Customer Name, Store Name, Amount, Delivery Time Mins, Order Status. It is used on a drill-through page (Module 17).
- Avoid as the main visual of an executive page.
- Formatting: Style presets (Minimal, Bold header, Alternating rows …), Grid (horizontal/vertical gridlines, row padding), Values (font, alternate background), Column headers (text wrap, alignment), Totals, Specific column (format one column), Cell elements (background/font colour, data bars, icons, web URL, Module 20), URL icon, Image size (for image URLs).
Ravindra Bagale's Tip
A common mistake is dumping a 50,000-row table visual on the overview page. Tables are for detail pages. Limit the rows with a Top N filter or drill-through, and apply conditional formatting so the important rows stand out. Practise, and it will feel very easy.
Ravindra Bagale's Tip – मराठी
एक common चूक म्हणजे overview page वर 50,000-row चा table visual टाकणं. Tables हे detail pages साठी असतात. Top N filter किंवा drill-through ने rows मर्यादित करा, आणि महत्त्वाच्या rows उठून दिसाव्यात म्हणून conditional formatting लावा. Practice करा, मग एकदम सोपं वाटेल.
Ravindra Bagale's Tip – हिंदी
एक common गलती है overview page पर 50,000-row का table visual डाल देना. Tables detail pages के लिए होती हैं. Top N filter या drill-through से rows सीमित करो, और ज़रूरी rows उभरकर दिखें इसलिए conditional formatting लगाओ. Practice करो, फिर बहुत आसान लगेगा.
Fix common mistakes
| Wrong result | Reason | Correction |
|---|---|---|
| Two orders merged into one row | Order ID summarised or missing | Add Order ID and set Don't summarize |
| Total row shows the wrong % | Percent column summed | Use a ratio measure, not a summed column |
| Thousands of rows slow the page | Table on a large fact | Filter the table or use drill-through |
Practise independently
Practice task
Show all Blinkit orders under ₹300 in a table.
Hints
- Filter Platform = Blinkit and Amount < 300.
Solution
304 ₹150, 306 ₹250, 308 ₹0. Total ₹400.
Think like a professional
Tables are for audit and action lists. Put them on a detail page reached by drill-through, not on the executive overview.
 Revision card