14. Visuals and Their Formatting
14.18 Matrix
In short: A matrix is Power BI's pivot table: Rows, Columns and Values wells, with subtotals and grand totals.
Quick answer: the short, self-contained version of this lesson is the guide Power BI Matrix Visual.
Start with a problem
Rani wants the Excel-pivot view: cities in rows, categories in columns, sales in the cells, with totals.
Explain simply
A matrix is Power BI's pivot table: Rows, Columns and Values wells, with subtotals and grand totals. It supports drill-down and expand/collapse.
Show the data
| City | Dairy | Fruits | Snacks | Total |
|---|---|---|---|---|
| Pune | 400 | 250 | 200 | 850 |
| Nashik | 650 | 150 | — | 800 |
| Kolhapur | 0 | — | 450 | 450 |
| Total | 1,050 | 400 | 650 | 2,100 |
About this data: This table uses columns: City, Dairy, Fruits, Snacks, Total. This table uses columns: City, Platform, Amount (₹). This table uses columns: City, Amazon Now, Blinkit, Total. Values shown are the lesson examples already on this page (not a new dataset).
Fictional sample data. Practice file: visuals_orders_apr_may_2026.csv (source: src/practice/).
Demonstrate
- Insert Matrix.
- Rows
City, ColumnsCategory, ValuesTotal Sales. - Format › Visual › Row subtotals and Column subtotals › On.
- Add
StoreunderCityin Rows, then use the + icons (Module 16.4) to expand Pune.
Show the result
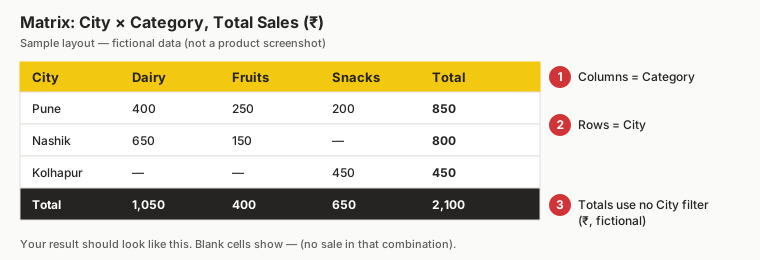
Your result should look like this (fictional sample):
| City | Dairy | Fruits | Snacks | Total |
|---|---|---|---|---|
| Pune | 400 | 250 | 200 | 850 |
| Nashik | 650 | 150 | — | 800 |
| Kolhapur | 0 | — | 450 | 450 |
| Total | 1,050 | 400 | 650 | 2,100 |
Explain what happened
Each cell evaluates Total Sales with two filters: its City and its Category. The totals remove one of the filters; the grand total removes both.
Explore further
- Swap a field from Rows to Columns to pivot.
- Turn on Show items with no data to display blank combinations (e.g. Nashik Snacks).
Detailed reference for this lesson:
Matrix visual in Power BI with example — in 30 seconds
What: A matrix groups numbers by rows and columns, like a pivot table in Excel, with totals.
Why: The state head wants cities down the side and platforms across the top, with totals.
Tiny example: Rows = City, Columns = Platform, Values = Total Sales. Grand total = ₹2,400.
Matrix visual in Power BI with example — 30 सेकंदात
काय: Matrix rows आणि columns नुसार आकडे group करतो, Excel मधल्या pivot table सारखा, totals सकट.
का: State head ना बाजूला खाली शहरं आणि वर आडवे platforms, totals सकट हवेत.
छोटं उदाहरण: Rows = City, Columns = Platform, Values = Total Sales. Grand total = ₹2,400.
Matrix visual in Power BI with example — 30 सेकंड में
क्या: Matrix rows और columns के हिसाब से आँकड़े group करता है, Excel की pivot table की तरह, totals के साथ.
क्यों: State head को साइड में नीचे शहर और ऊपर आड़े platforms, totals के साथ चाहिए.
छोटा उदाहरण: Rows = City, Columns = Platform, Values = Total Sales. Grand total = ₹2,400.
First look at the data (before → after):
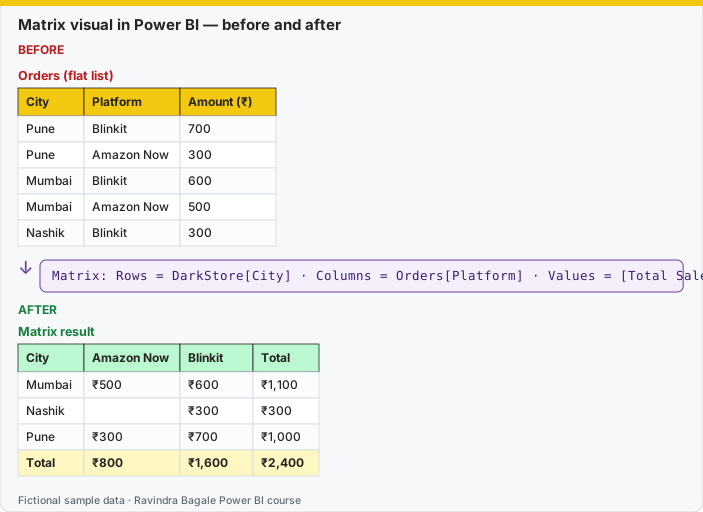
Same before / after tables as text
Before — Orders (flat list)
| City | Platform | Amount (₹) |
|---|---|---|
| Pune | Blinkit | 700 |
| Pune | Amazon Now | 300 |
| Mumbai | Blinkit | 600 |
| Mumbai | Amazon Now | 500 |
| Nashik | Blinkit | 300 |
Formula / click path
Matrix: Rows = DarkStore[City] · Columns = Orders[Platform] · Values = [Total Sales]
After — Matrix result
| City | Amazon Now | Blinkit | Total |
|---|---|---|---|
| Mumbai | ₹500 | ₹600 | ₹1,100 |
| Nashik | — | ₹300 | ₹300 |
| Pune | ₹300 | ₹700 | ₹1,000 |
| Total | ₹800 | ₹1,600 | ₹2,400 |
Do it step by step:
- Click Matrix in Visualizations.
- Drag City to Rows.
- Drag Platform to Columns.
- Drag [Total Sales] to Values.
- Check the totals: Pune ₹1,000 and grand total ₹2,400.
- Turn totals on or off in Format › Visual › Row subtotals and Column subtotals.
एक-एक step करून बघा:
- Visualizations मध्ये Matrix वर click करा.
- City ओढून Rows वर टाका.
- Platform ओढून Columns वर टाका.
- [Total Sales] ओढून Values वर टाका.
- Totals तपासा: Pune ₹1,000 आणि grand total ₹2,400.
- Format › Visual › Row subtotals आणि Column subtotals मध्ये totals चालू-बंद करा.
एक-एक step करके देखिए:
- Visualizations में Matrix पर click कीजिए.
- City को खींचकर Rows पर डालिए.
- Platform को खींचकर Columns पर डालिए.
- [Total Sales] को खींचकर Values पर डालिए.
- Totals जाँचिए: Pune ₹1,000 और grand total ₹2,400.
- Format › Visual › Row subtotals और Column subtotals में totals चालू-बंद कीजिए.
A cross-tab like an Excel PivotTable, with row/column groups, subtotals and drill.
- Field wells: Rows, Columns, Values (plus Drill through fields at page level).
- Example: Rows = Location hierarchy (City › Store Name), Columns = Month Name, Values = Total Orders and Avg Delivery Time (mins).
- Formatting: Layout and style presets, Grid, Values (Switch values to rows to show measures as rows), Row headers (+/- icons, stepped layout and indent), Column headers, Row subtotals / Column subtotals (per level on/off, position top/bottom), Row grand total / Column grand total, Cell elements (conditional formatting), Specific column.
Tip
Turn Stepped layout off to show each level in its own column, like a classic PivotTable. Turn on +/- icons so users can expand a single city (Module 16.4).
Matrix ha Excel pivot table sarkhach aahe. Excel yet asel tar he ekdum sope vatel.
Ravindra Bagale's Tip
Friends, many students turn on every subtotal and grand total in a matrix, including totals that make no sense, like a sum of percentages. Check each total: ratios need measures that calculate correctly at the total level. Turn off subtotals that don't help, and use the stepped layout for hierarchies. Never forget this.
Ravindra Bagale's Tip – मराठी
मित्रांनो, बरेच students matrix मधले सगळे subtotals आणि grand totals चालू ठेवतात, ज्यात percentages ची बेरीज सारखे निरर्थक totals पण असतात. प्रत्येक total चेक करा: ratios साठी total level ला बरोबर calculate होणारे measures लागतात. उपयोग नसलेले subtotals बंद करा, आणि hierarchies साठी stepped layout वापरा. हे अजिबात विसरू नका.
Ravindra Bagale's Tip – हिंदी
दोस्तों, बहुत से students matrix में हर subtotal और grand total चालू कर देते हैं, जिनमें percentages का जोड़ जैसे बेमतलब totals भी होते हैं. हर total check करो: ratios को ऐसे measures चाहिए जो total level पर सही calculate हों. जो subtotals काम के नहीं उन्हें बंद करो, और hierarchies के लिए stepped layout इस्तेमाल करो. यह बिल्कुल मत भूलना.
Fix common mistakes
| Wrong result | Reason | Correction |
|---|---|---|
| Column total is not the sum of cells | Measure that does not add up (e.g. average, distinct count) | Expected for non-additive measures – explain or use SUMX over the rows |
| Subtotals missing | Turned off in format | Row/Column subtotals On |
| Kolhapur Dairy shows 0, Nashik Snacks shows blank | 308 is a real row with ₹0; Nashik has no Snacks rows | Explain the difference: zero = row exists, blank = no row |
Practise independently
Practice task
Make a matrix of City × Platform. Give the Nashik row and the grand total.
Hints
- Nashik: 303 Blinkit 300, 304 Blinkit 150, 307 Amazon Now 350.
Solution
Nashik: Blinkit ₹450, Amazon Now ₹350, total ₹800. Grand total ₹2,100 (Blinkit 1,100, Amazon Now 1,000).
Think like a professional
Matrices are where totals get questioned. Know why a total can differ from the sum of rows (non-additive measures) – it is a common interview question.
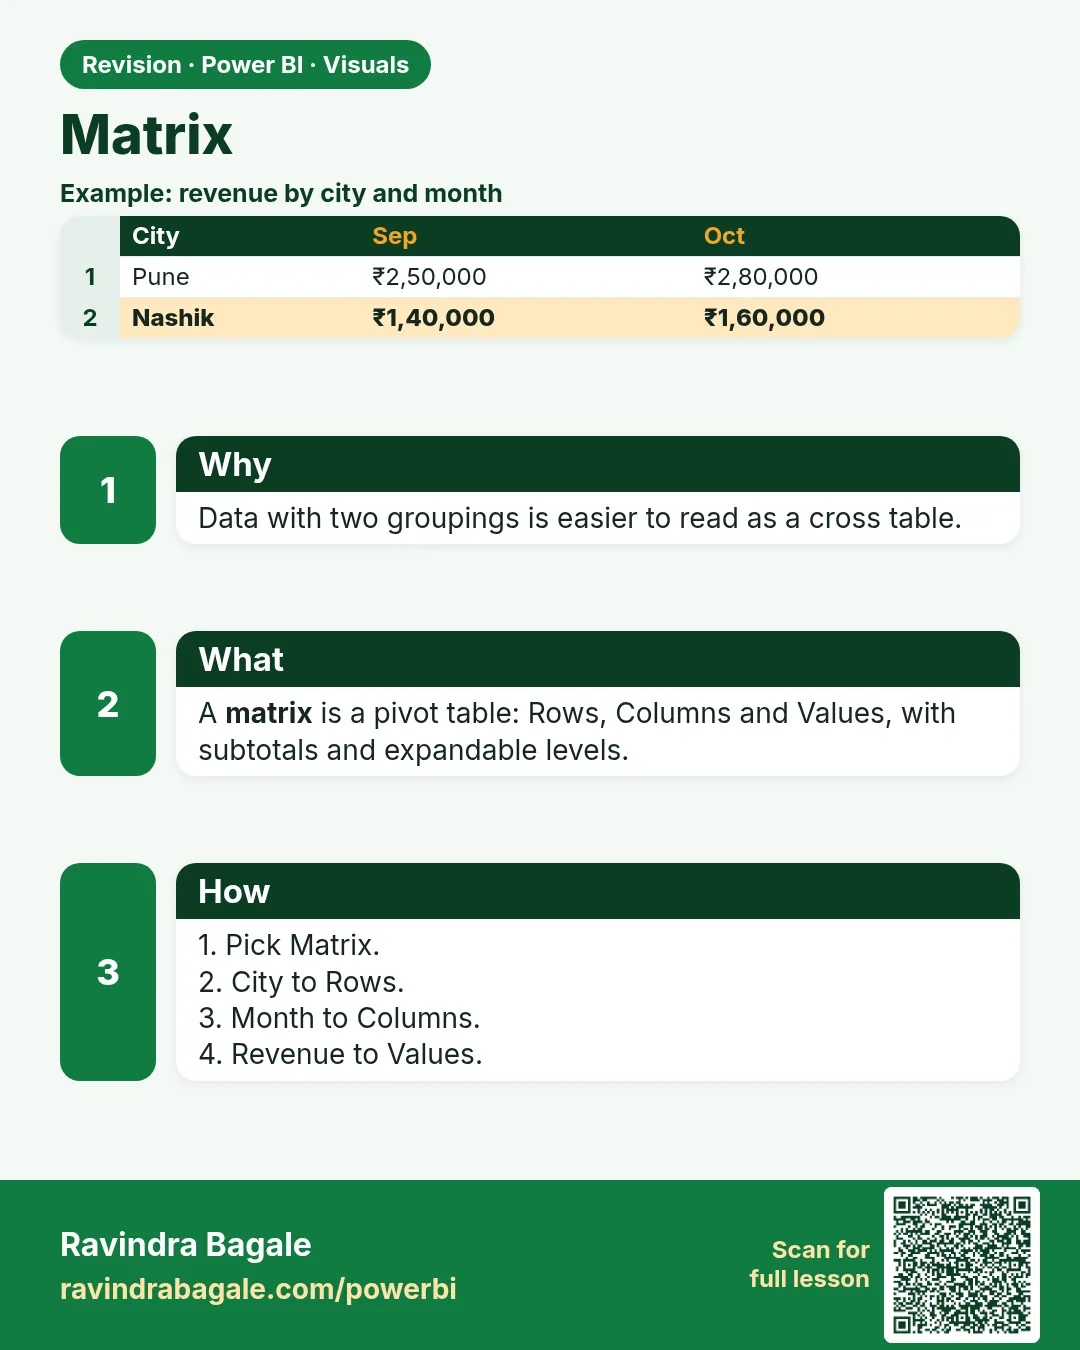 Revision card
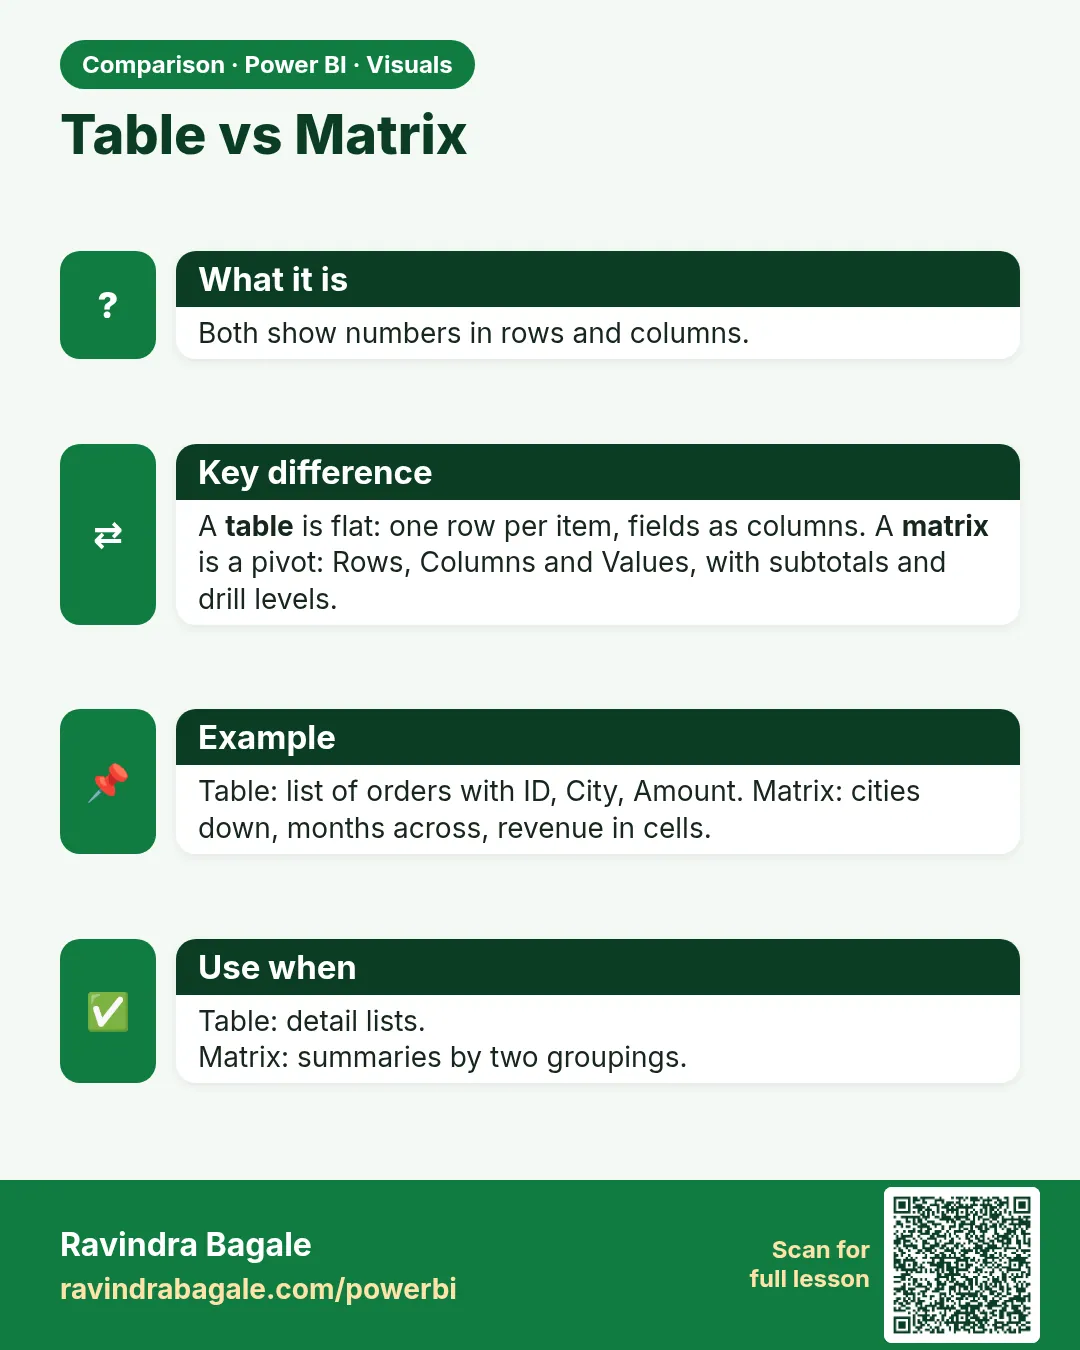 Comparison card