Ravindra BagaleCourses & study guides मराठी Track your progress

Ravi Sir's Cards › Power BI

11. Data Modelling: Cards

मराठी cards · Open the chapter

Revision cards
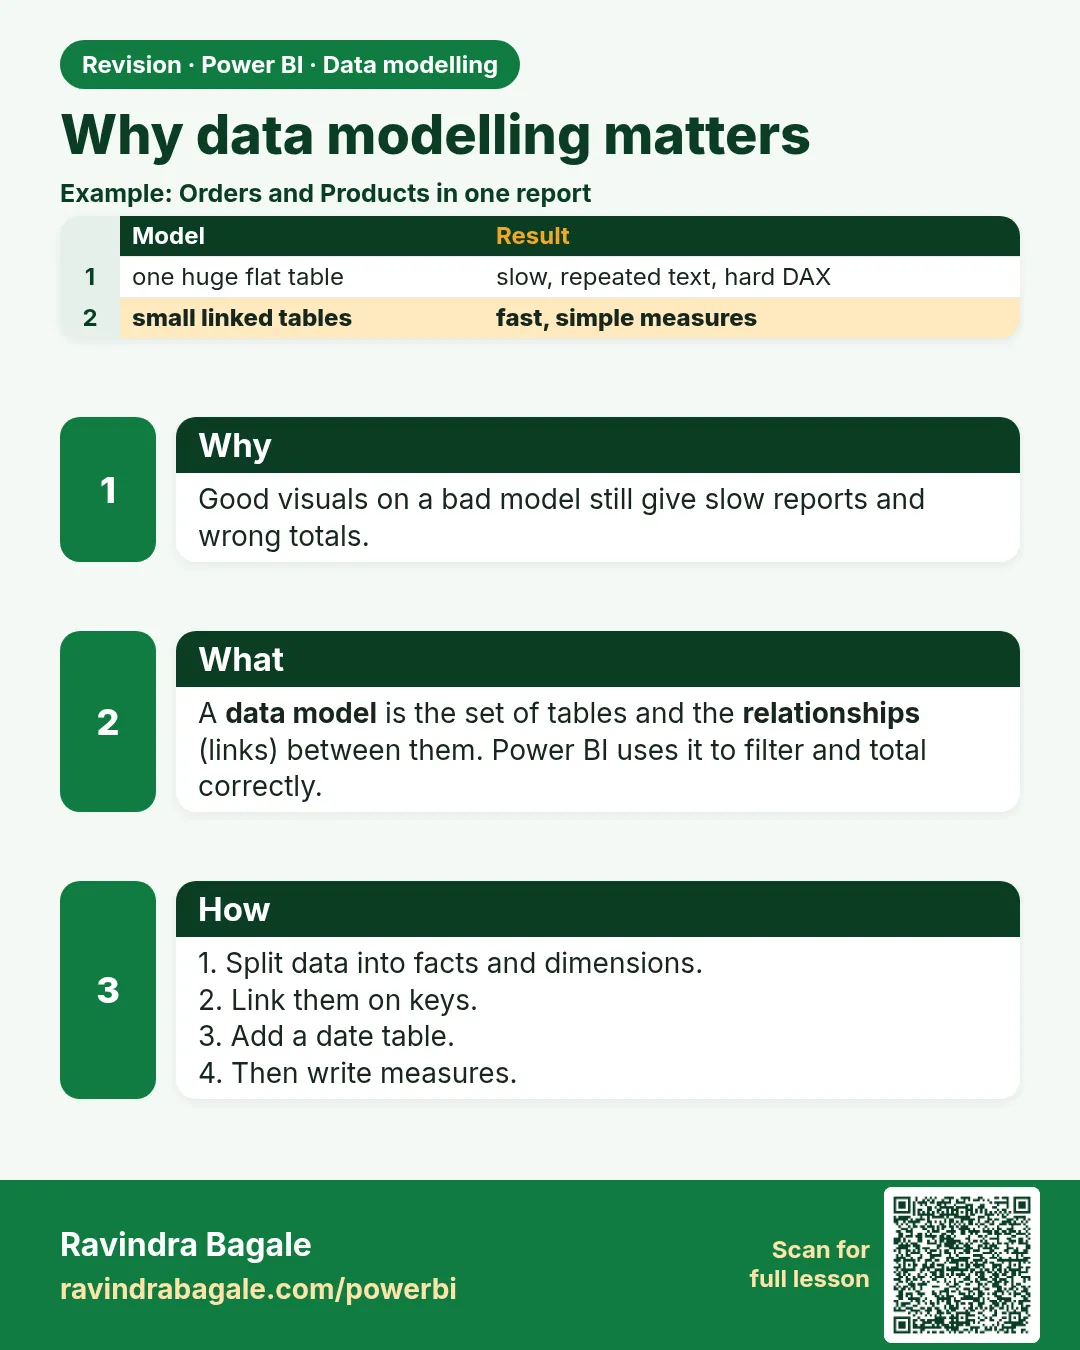
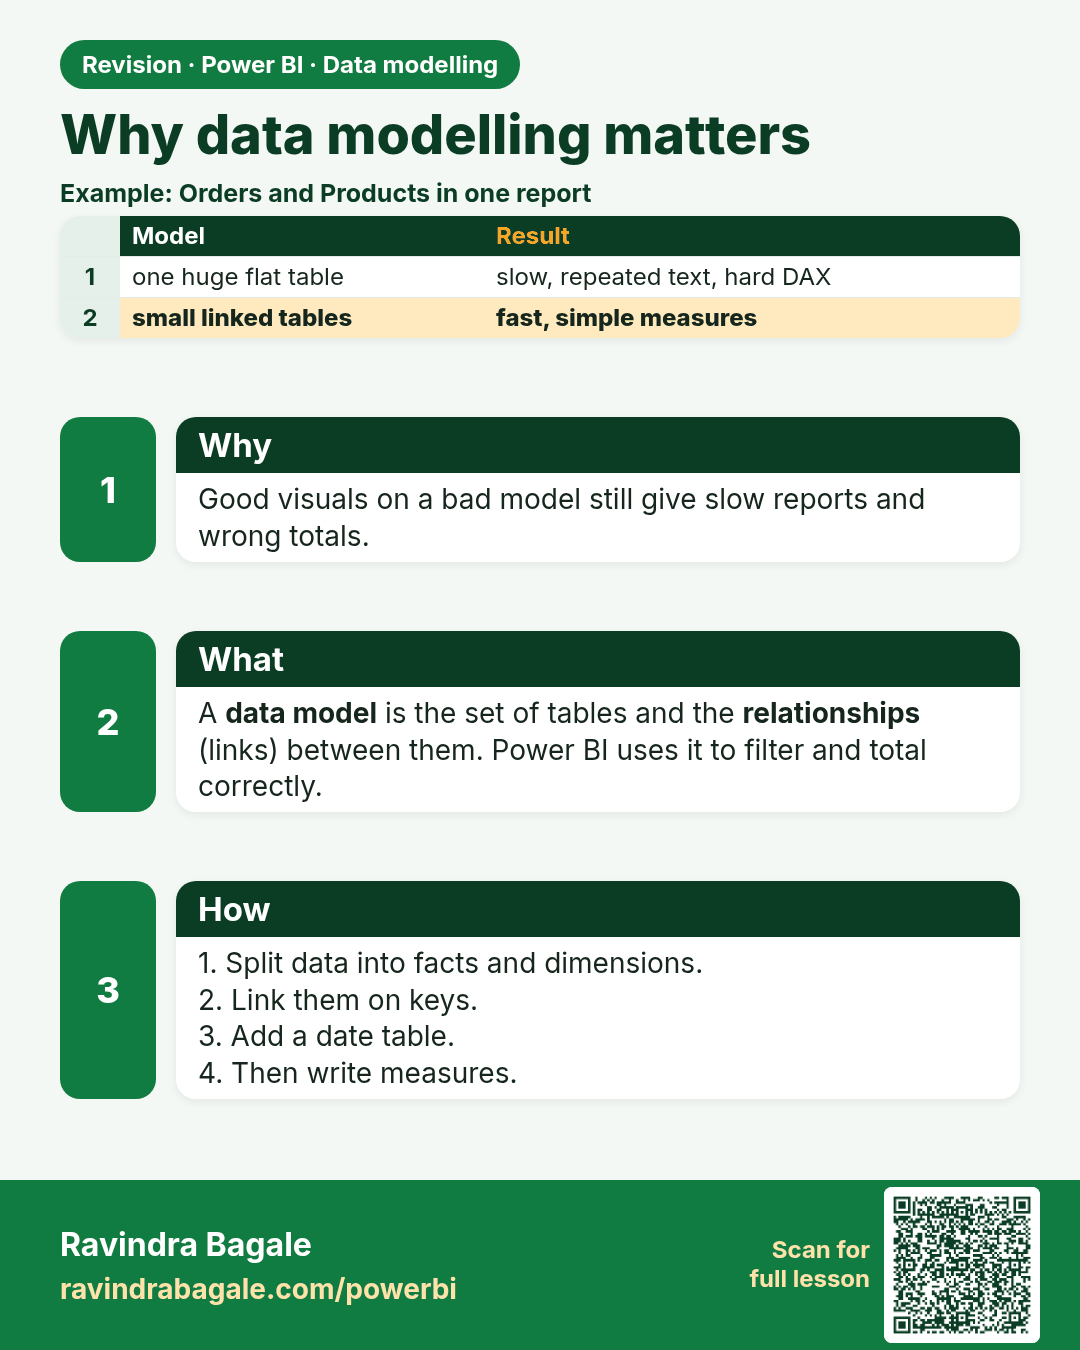
Why data modelling matters. Good visuals on a bad model still give slow reports and wrong totals.
Revision card 1 of 11: Why data modelling matters · Download PNG · Open card page

Lesson: 11.1 Why Data Modelling Matters
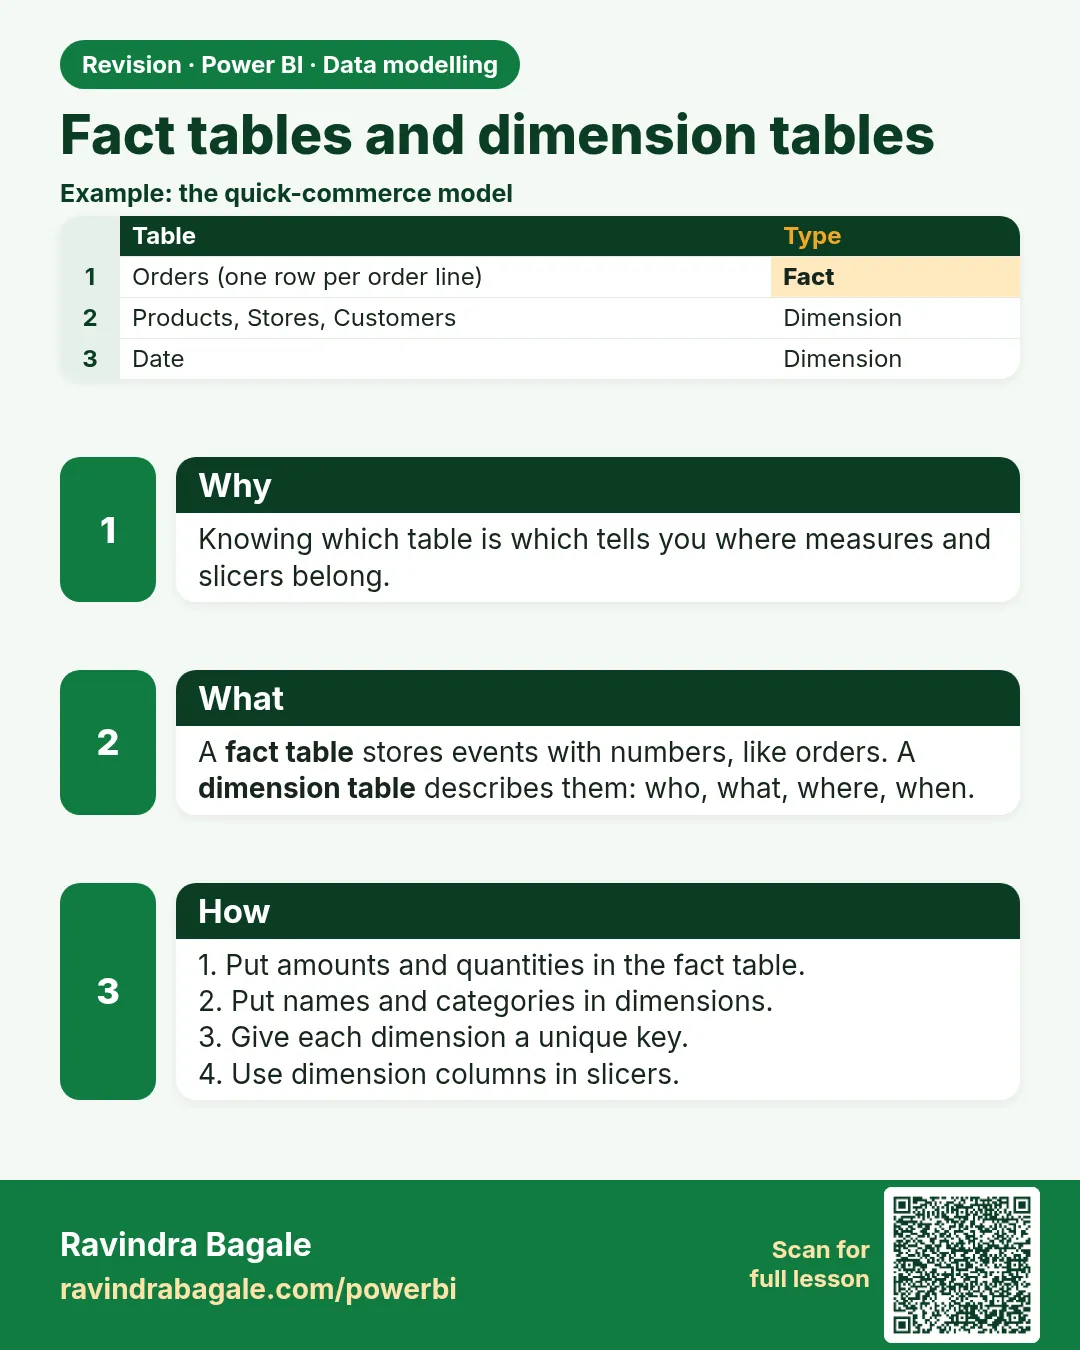
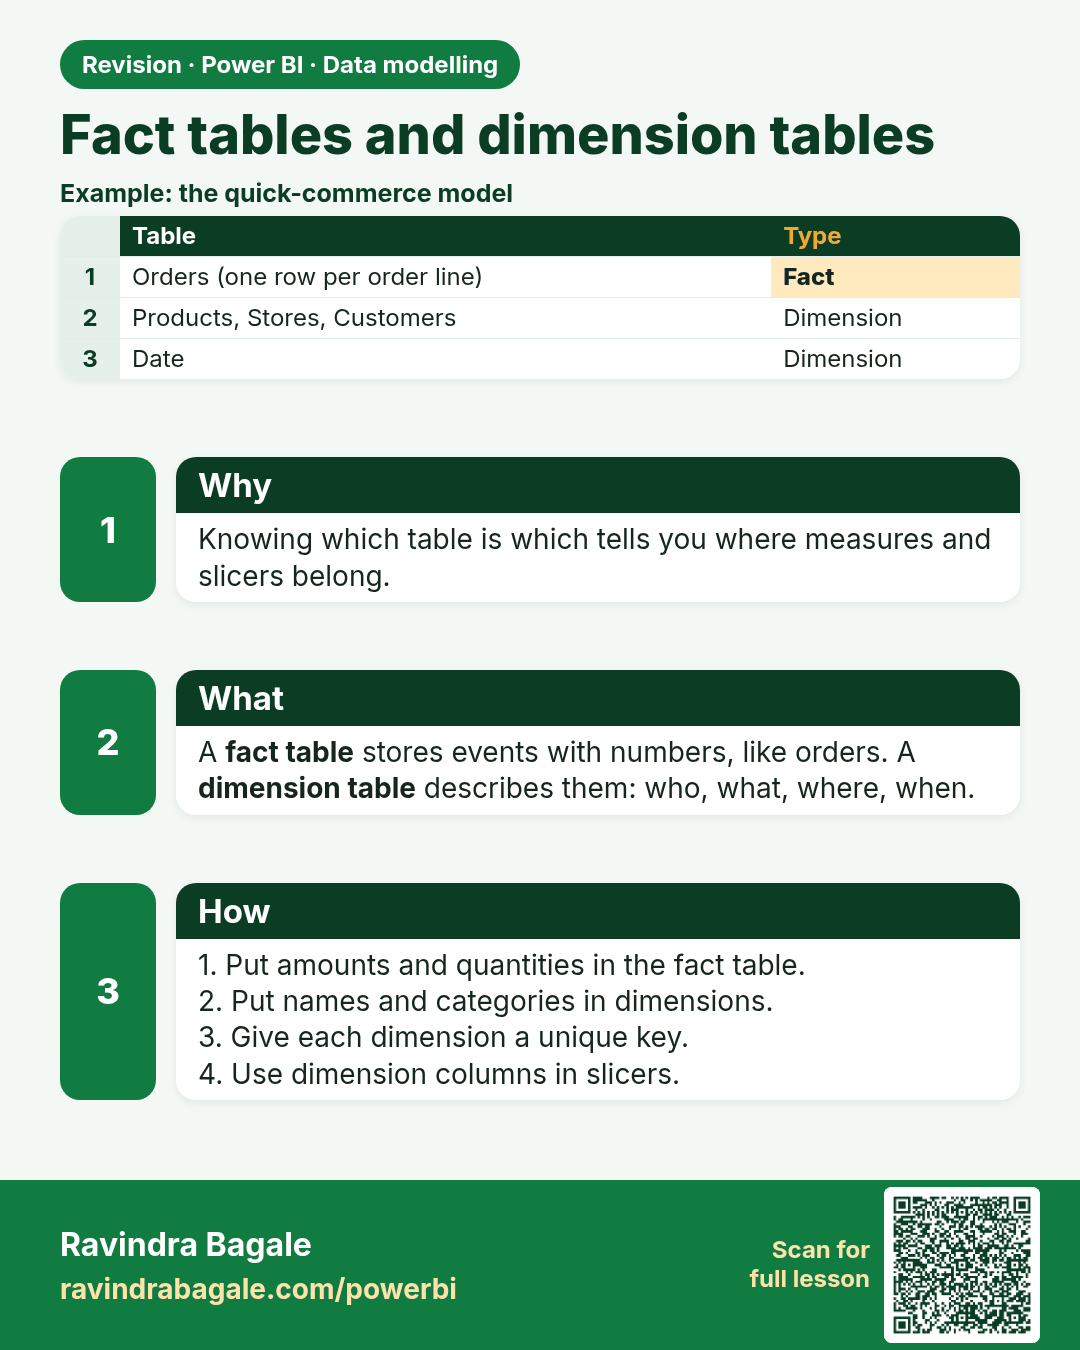
Fact tables and dimension tables. Knowing which table is which tells you where measures and slicers belong.
Revision card 2 of 11: Fact tables and dimension tables · Download PNG · Open card page

Lesson: 11.2 Fact Tables and Dimension Tables in Power BI with Example
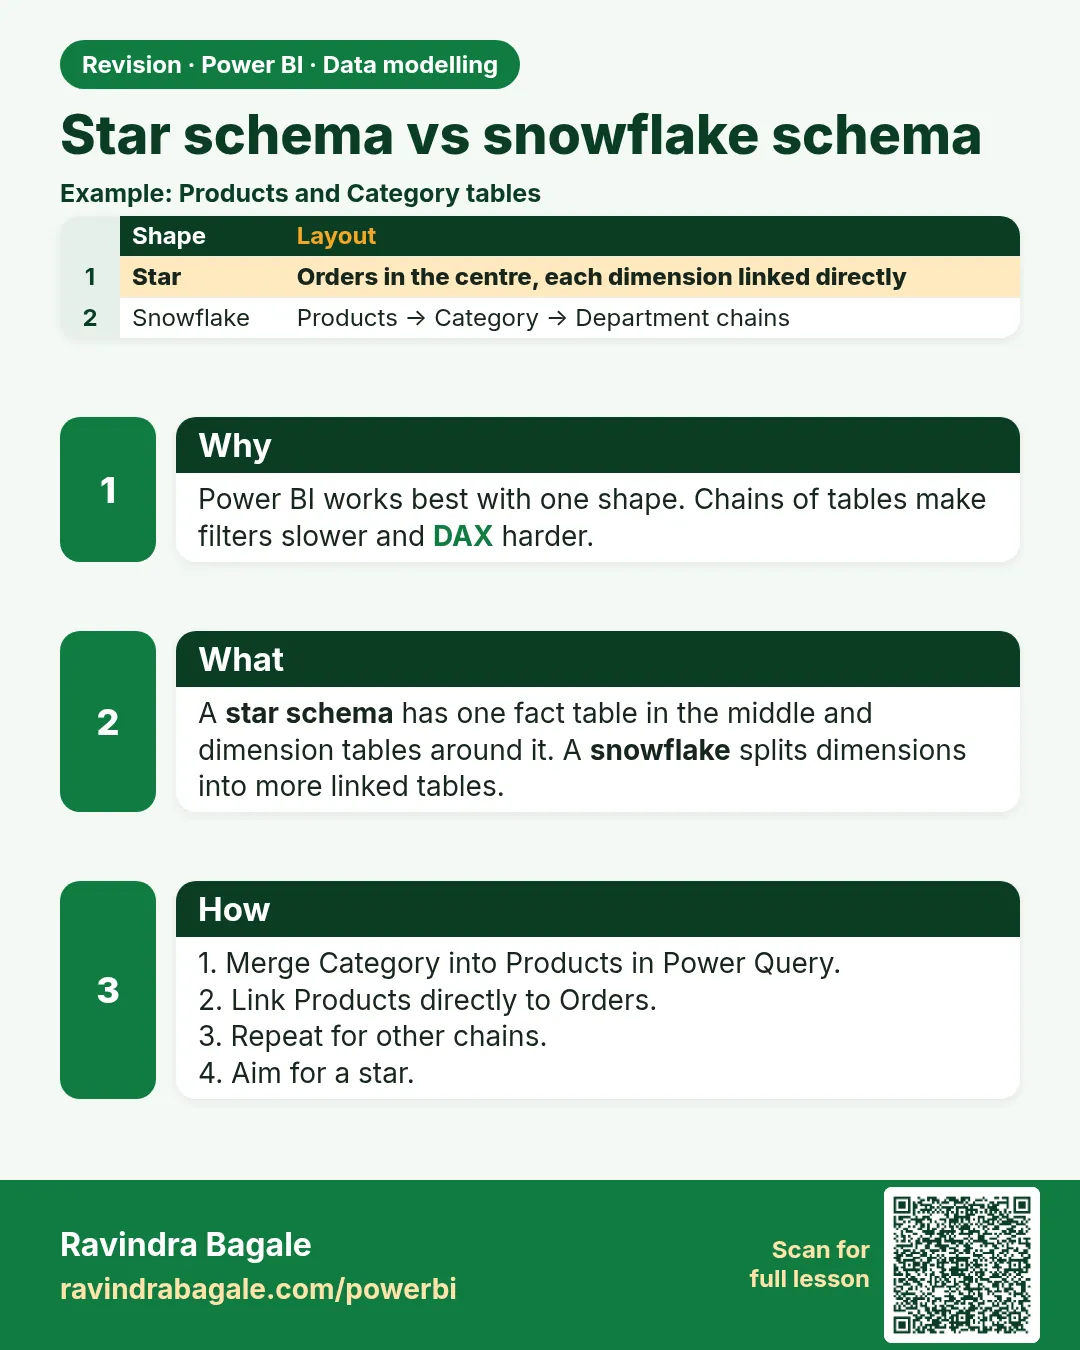
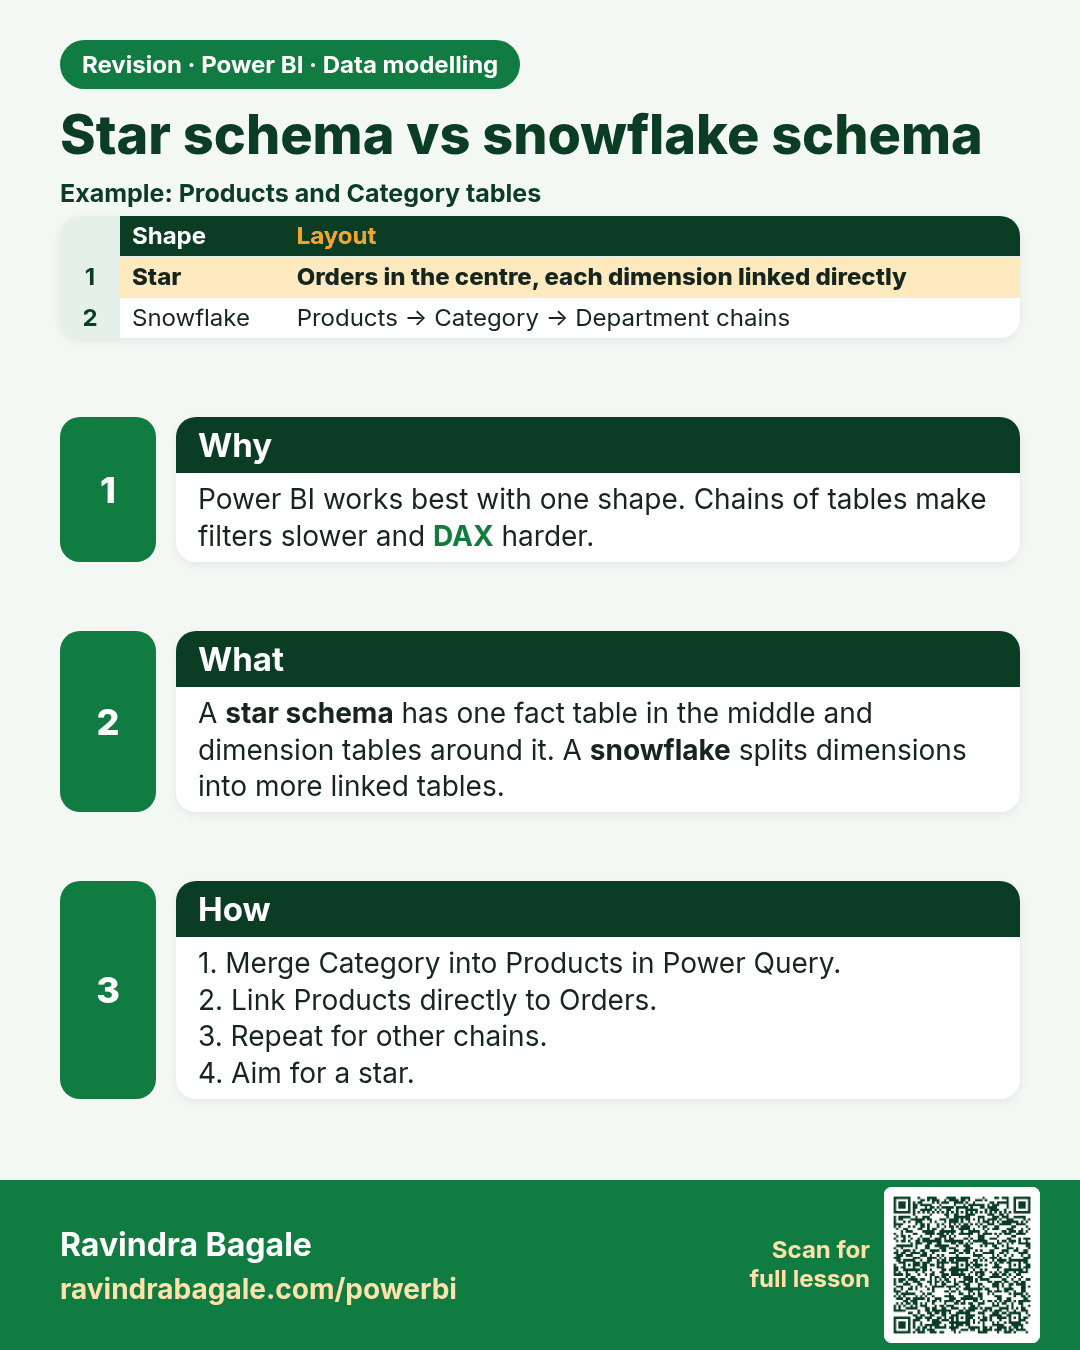
Star schema vs snowflake schema. Power BI works best with one shape. Chains of tables make filters slower and DAX harder.
Revision card 3 of 11: Star schema vs snowflake schema · Download PNG · Open card page

Lesson: 11.3 Star Schema vs Snowflake Schema in Power BI with Example
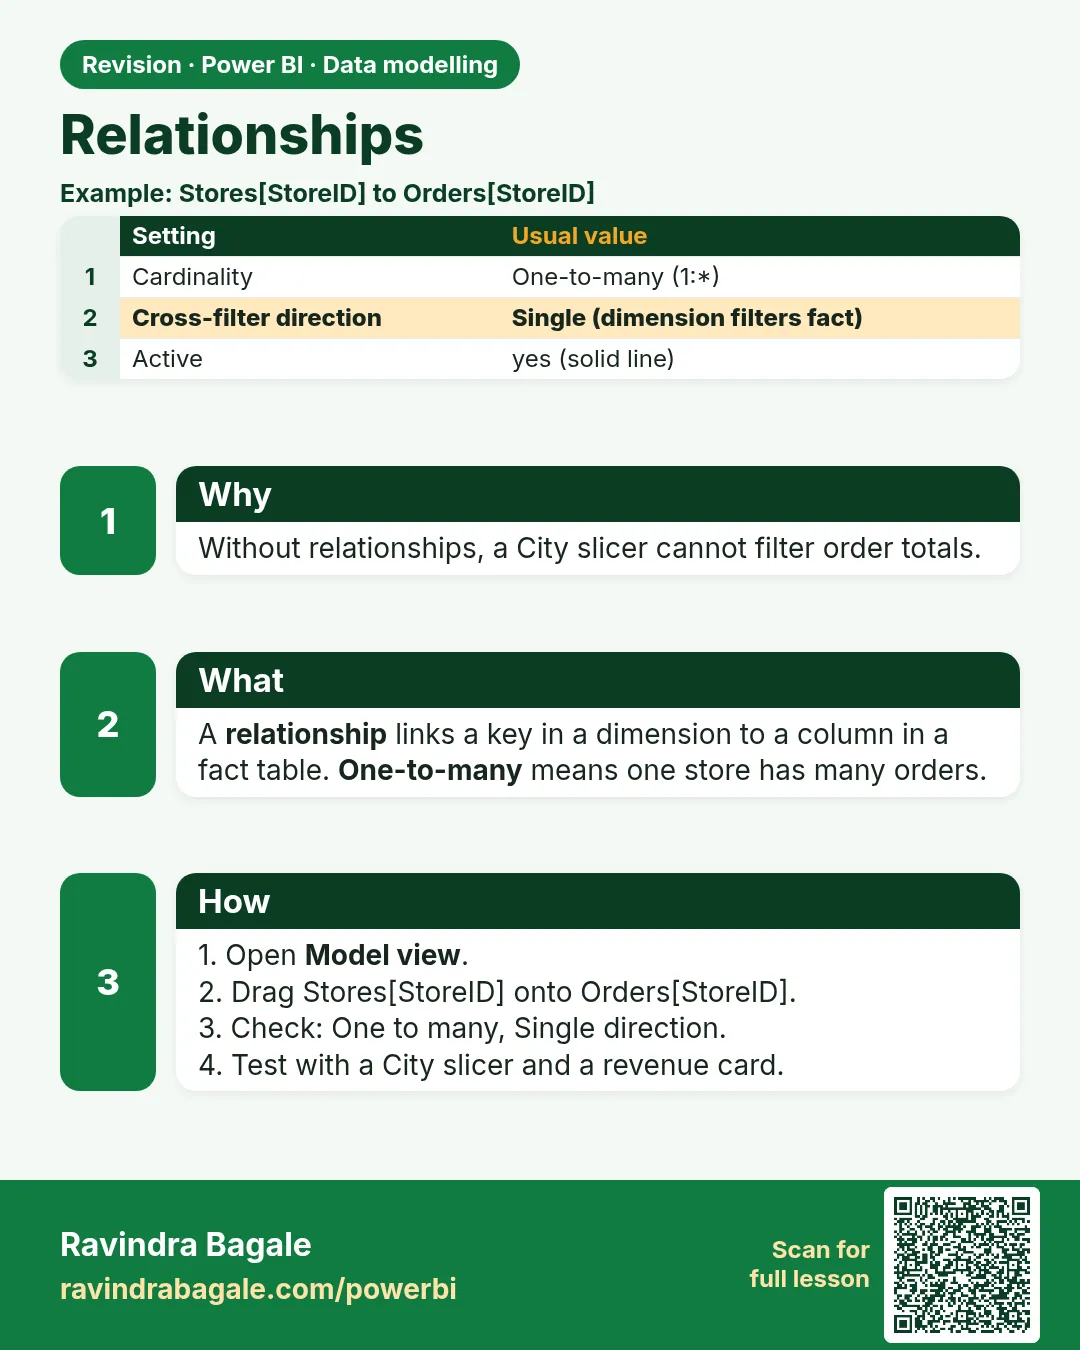
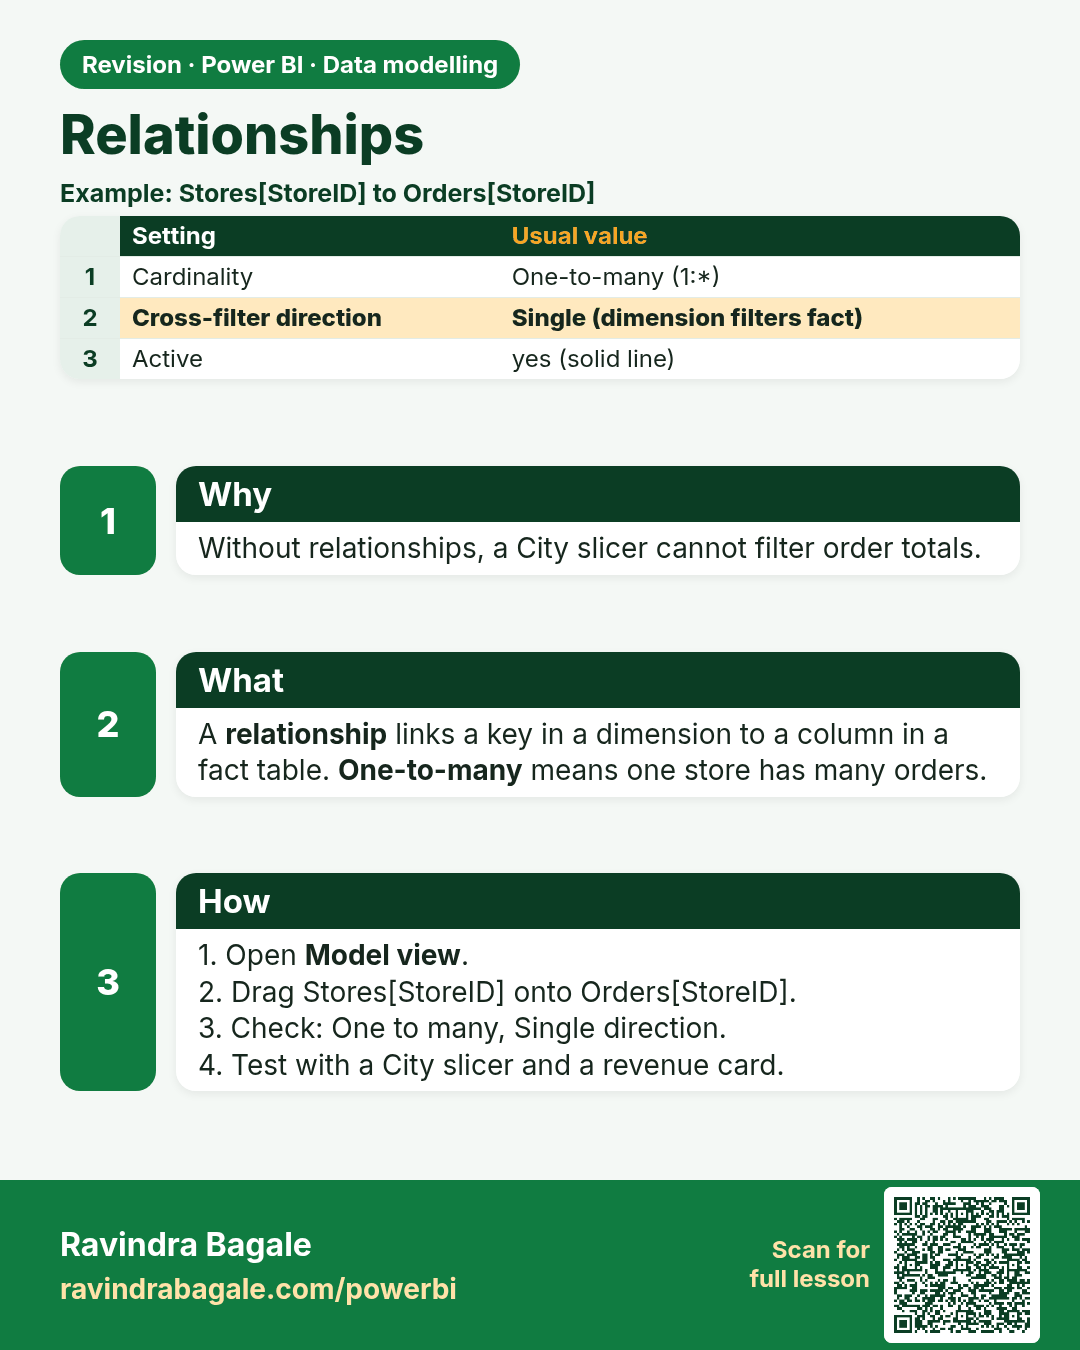
Relationships. Without relationships, a City slicer cannot filter order totals.
Revision card 4 of 11: Relationships · Download PNG · Open card page

Lesson: 11.4 Relationships in Power BI with Example: Cardinality and Direction

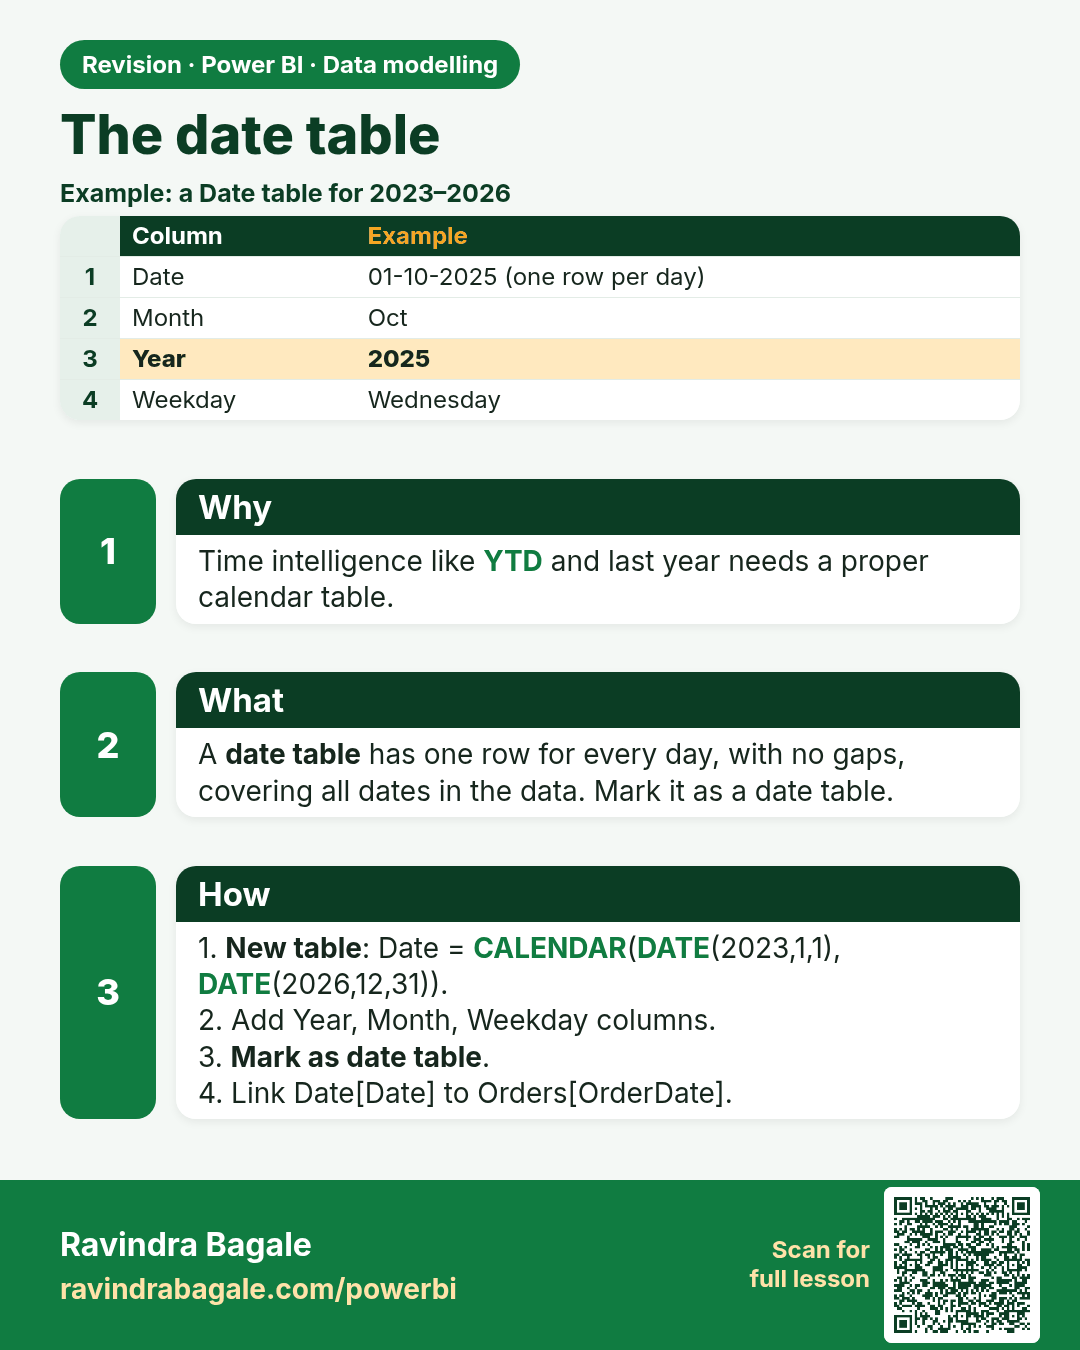
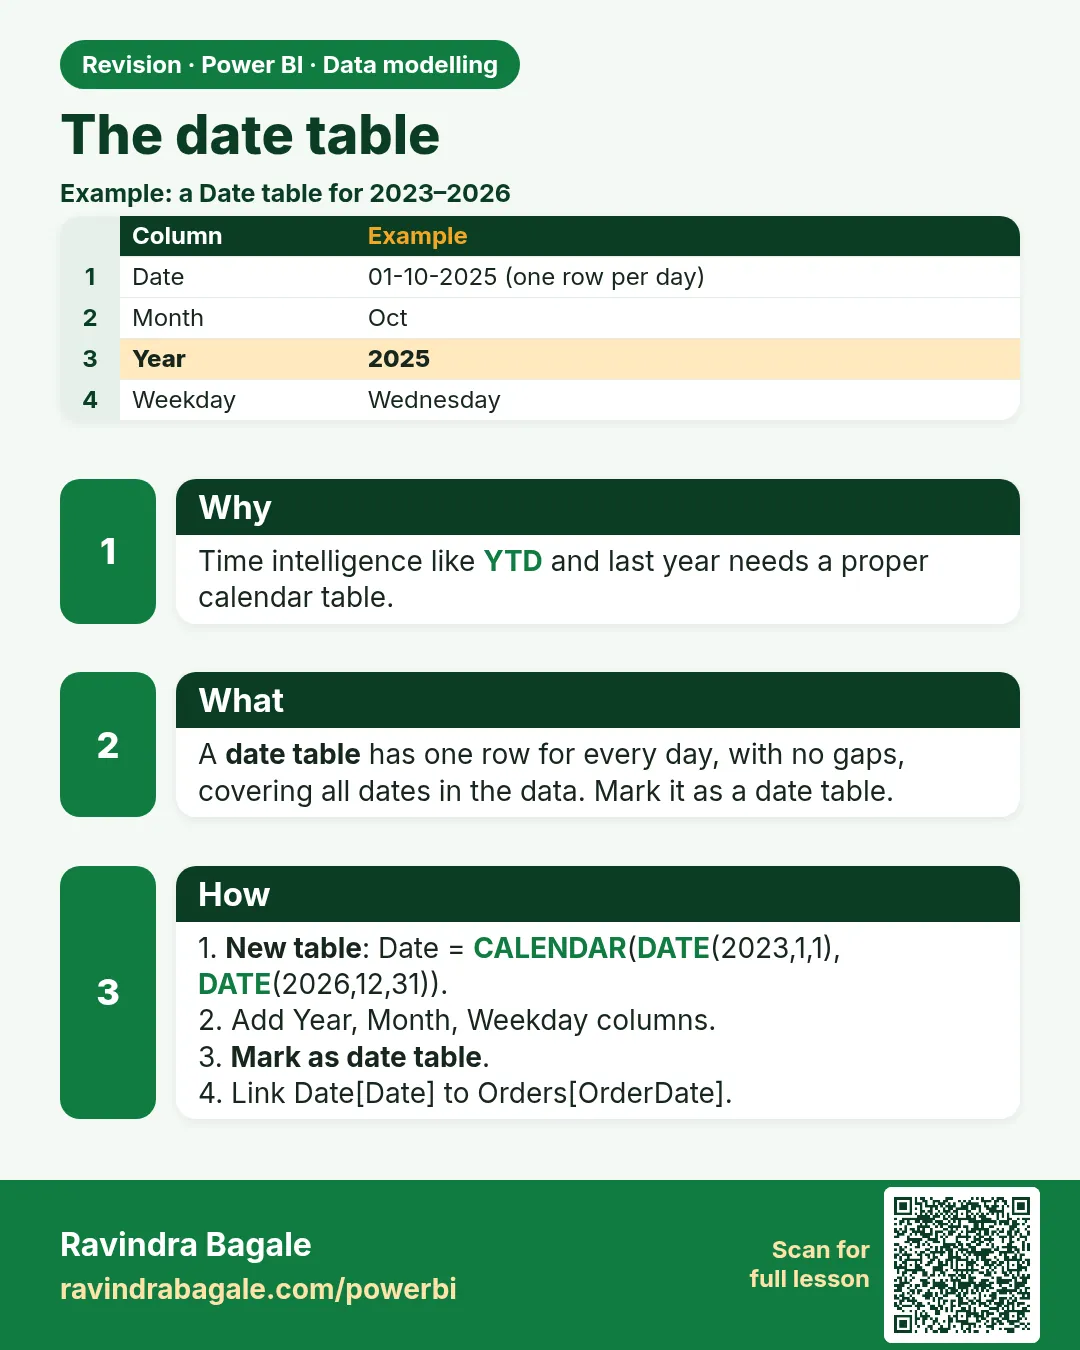
The date table. Time intelligence like YTD and last year needs a proper calendar table.
Revision card 5 of 11: The date table · Download PNG · Open card page

Lesson: 11.5 Date Table in Power BI with Example (April–March FY)

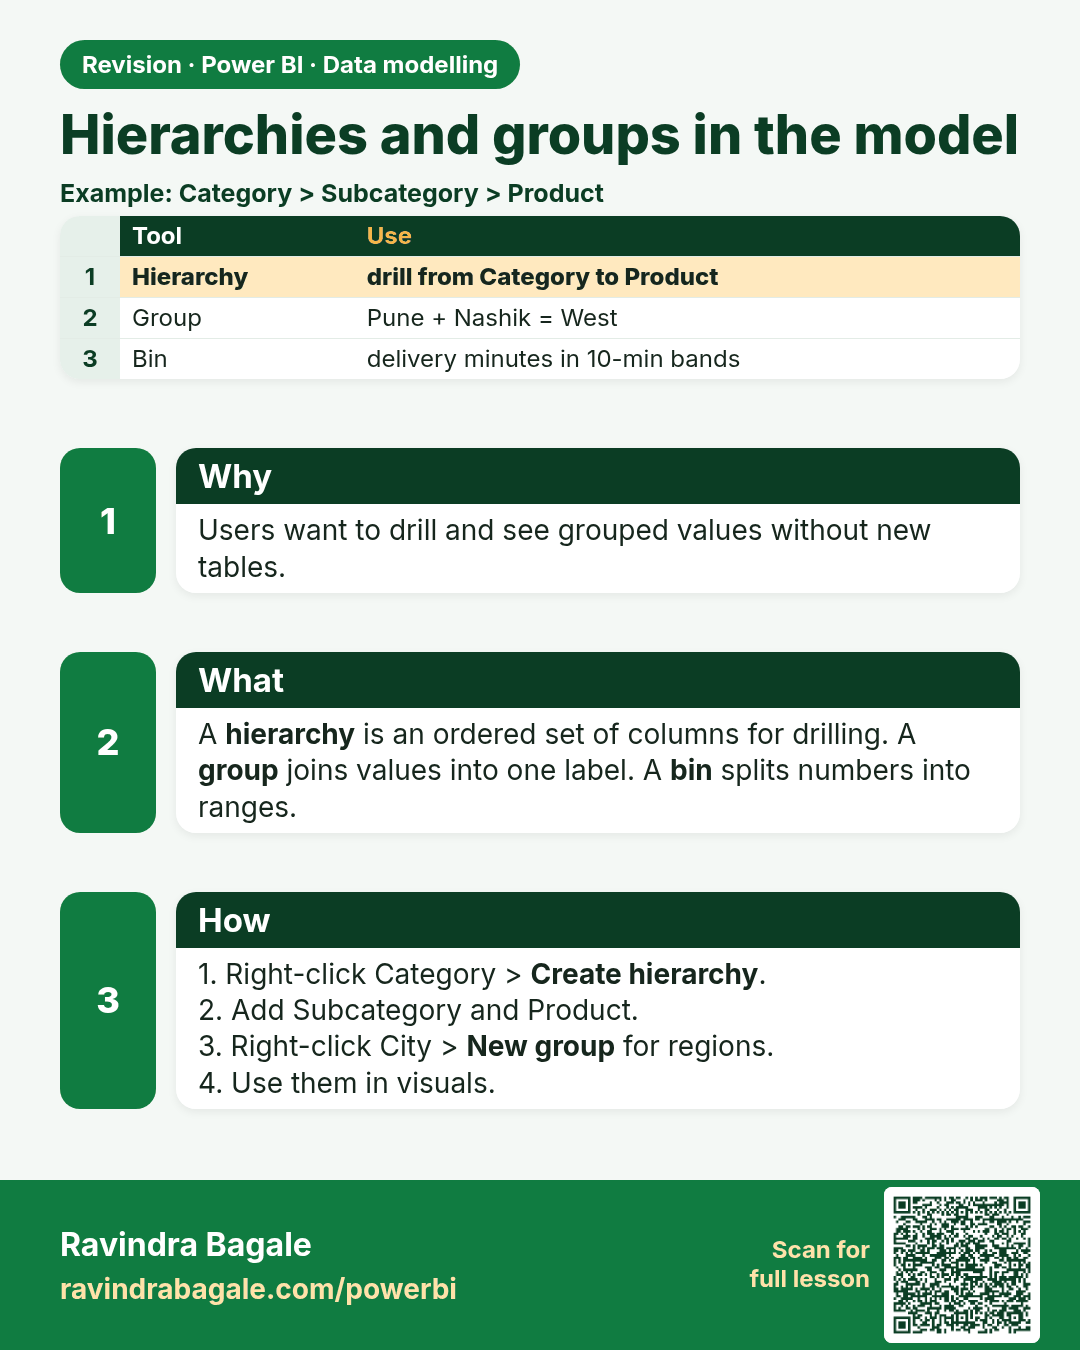
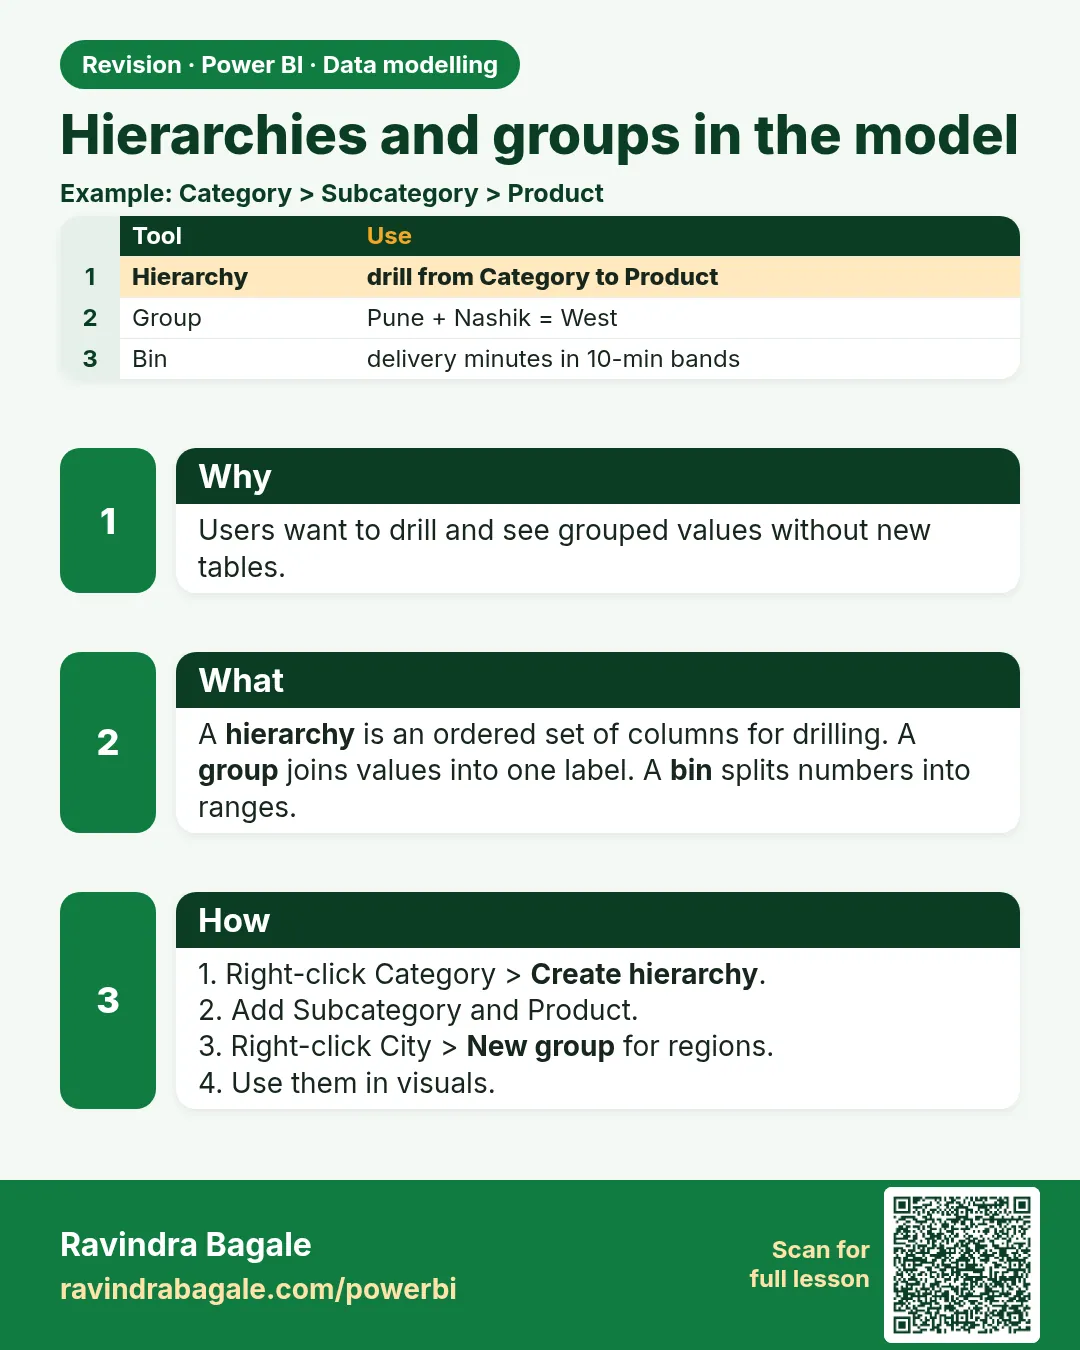
Hierarchies and groups in the model. Users want to drill and see grouped values without new tables.
Revision card 6 of 11: Hierarchies and groups in the model · Download PNG · Open card page

Lesson: 11.6 Hierarchies and Groups

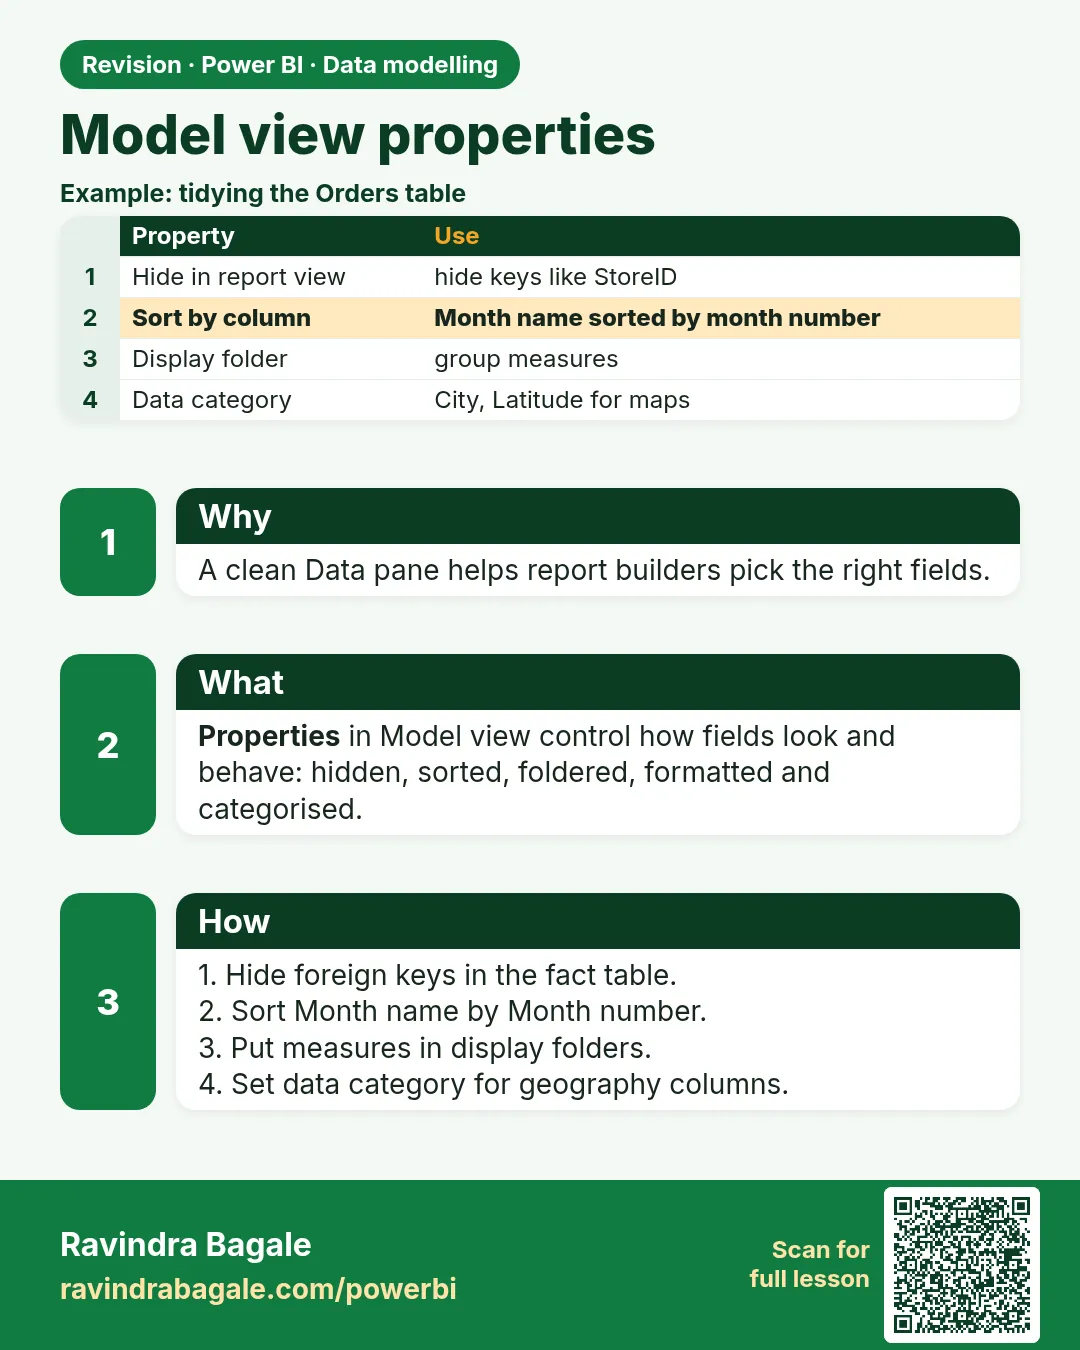
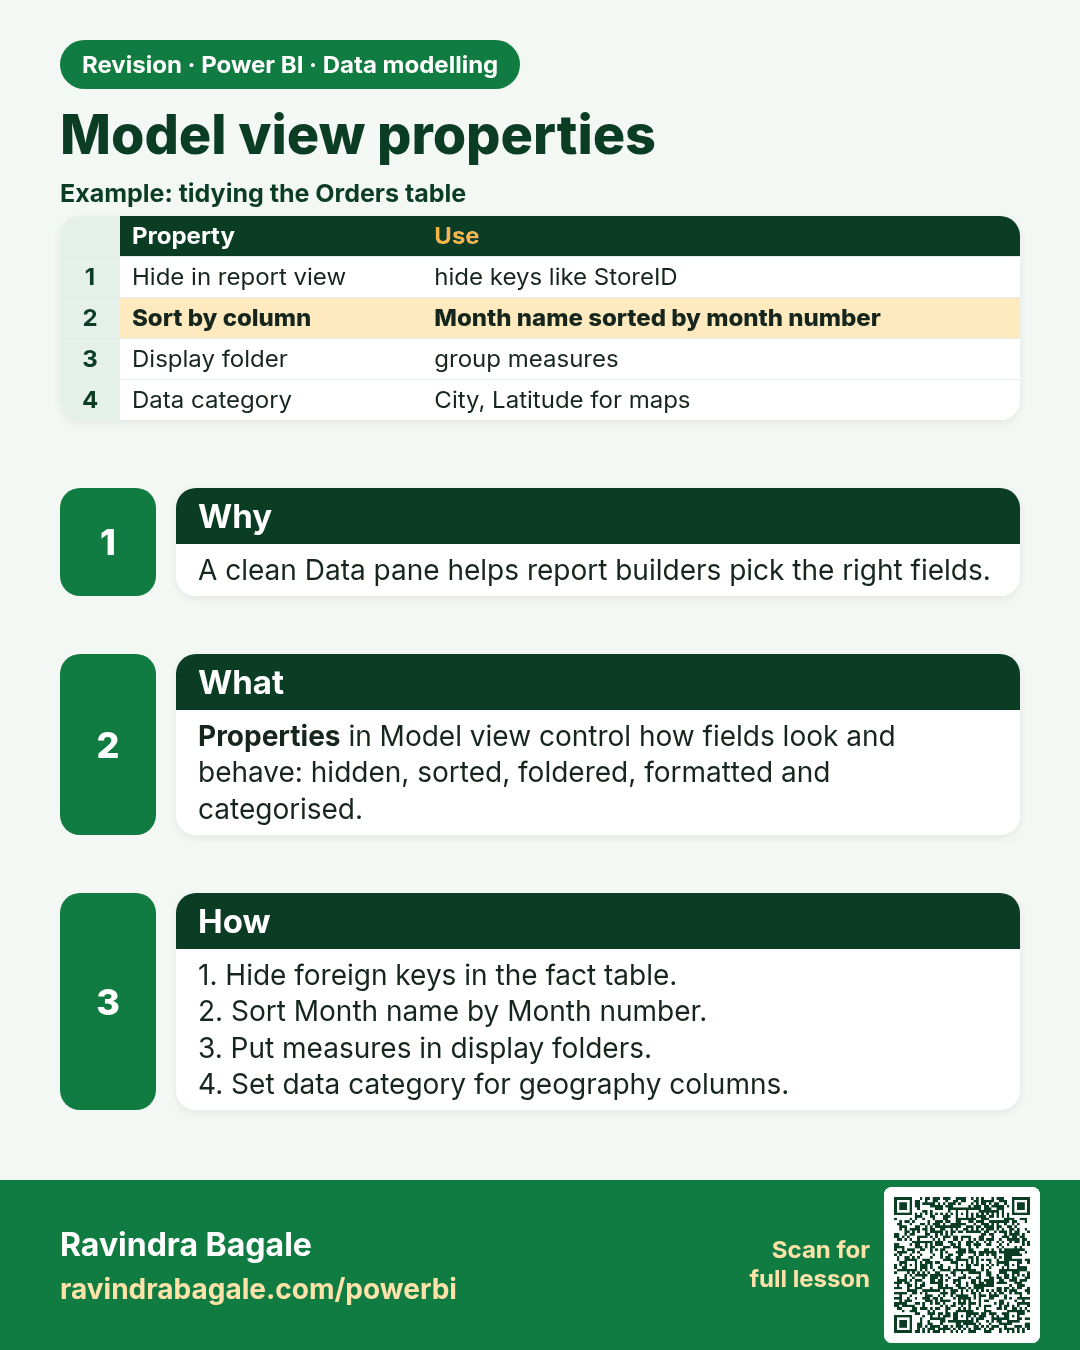
Model view properties. A clean Data pane helps report builders pick the right fields.
Revision card 7 of 11: Model view properties · Download PNG · Open card page

Lesson: 11.7 Model View Properties

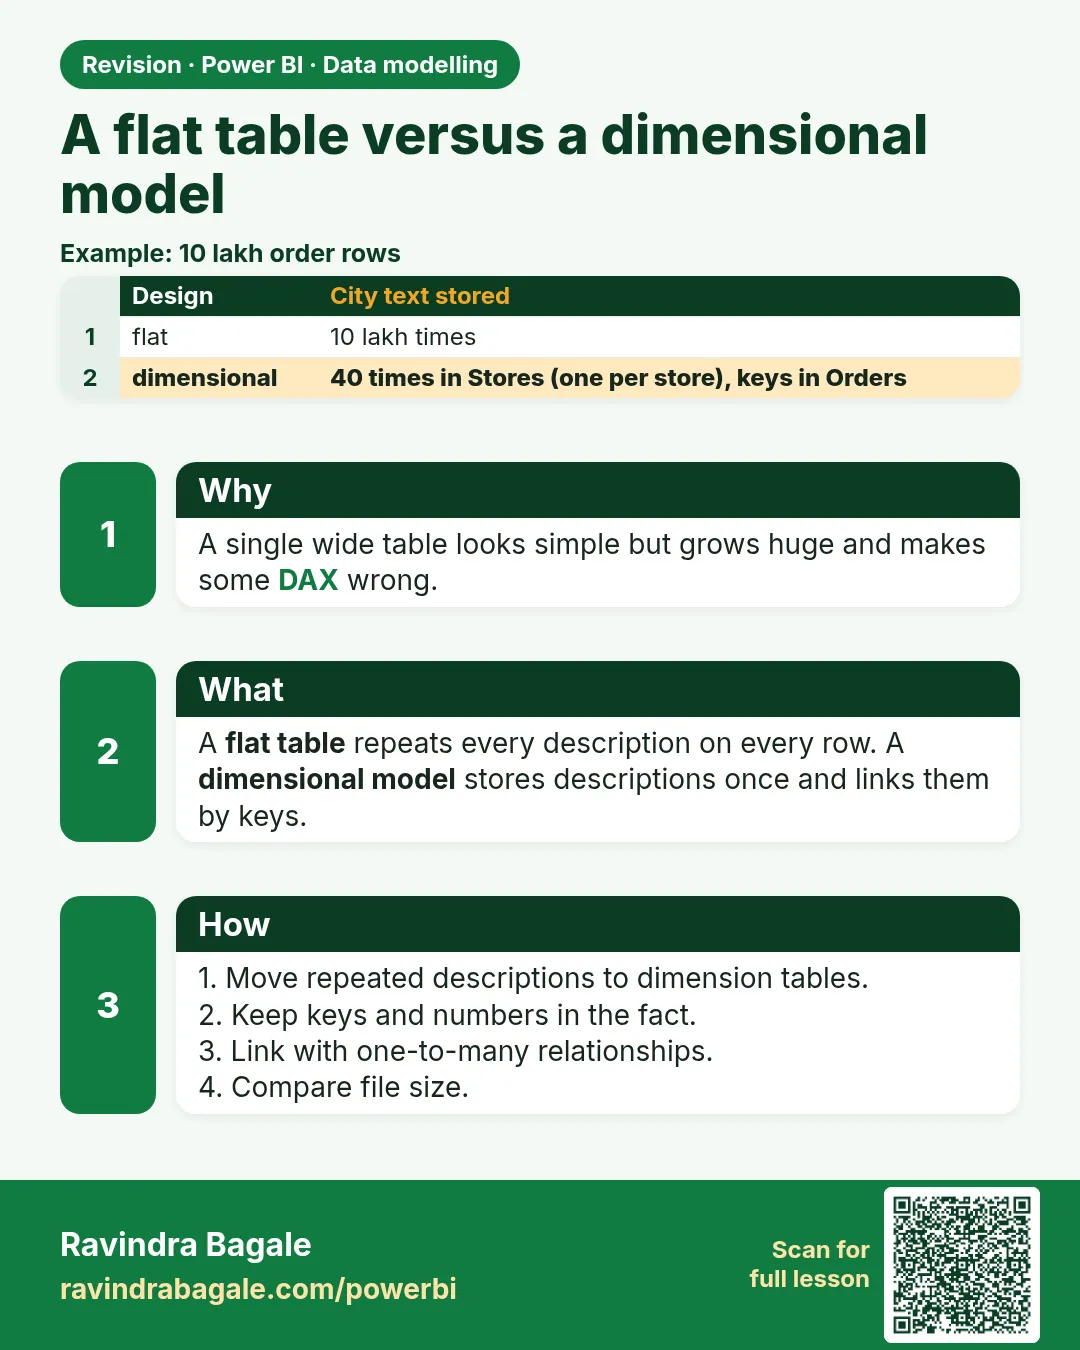
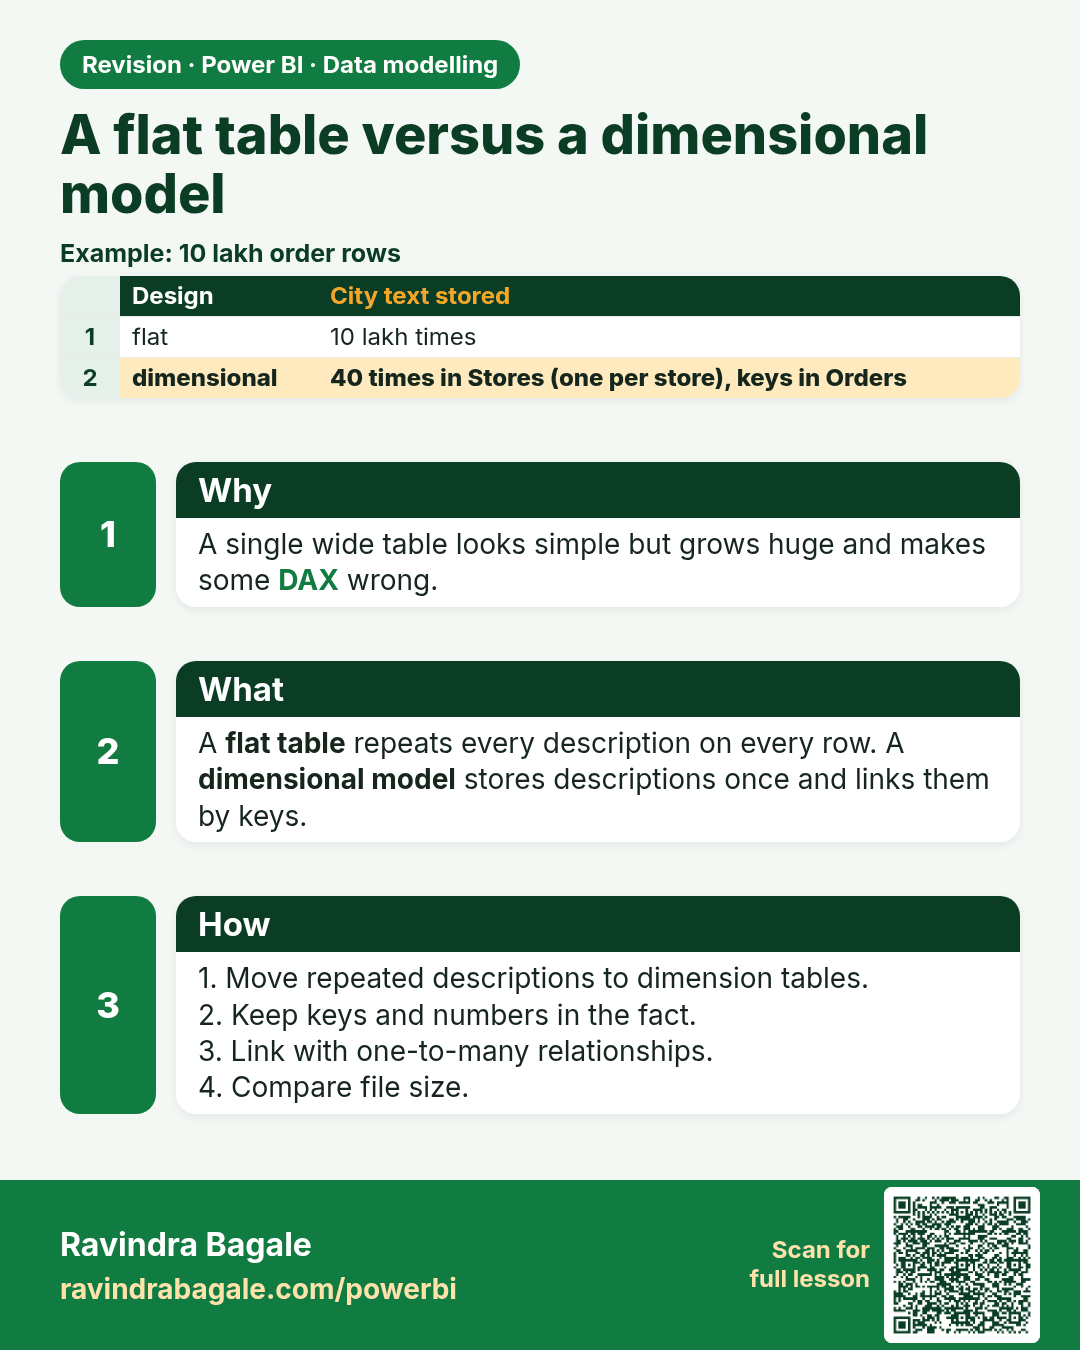
A flat table versus a dimensional model. A single wide table looks simple but grows huge and makes some DAX wrong.
Revision card 8 of 11: A flat table versus a dimensional model · Download PNG · Open card page

Lesson: 11.9 A Flat Table versus a Dimensional Model

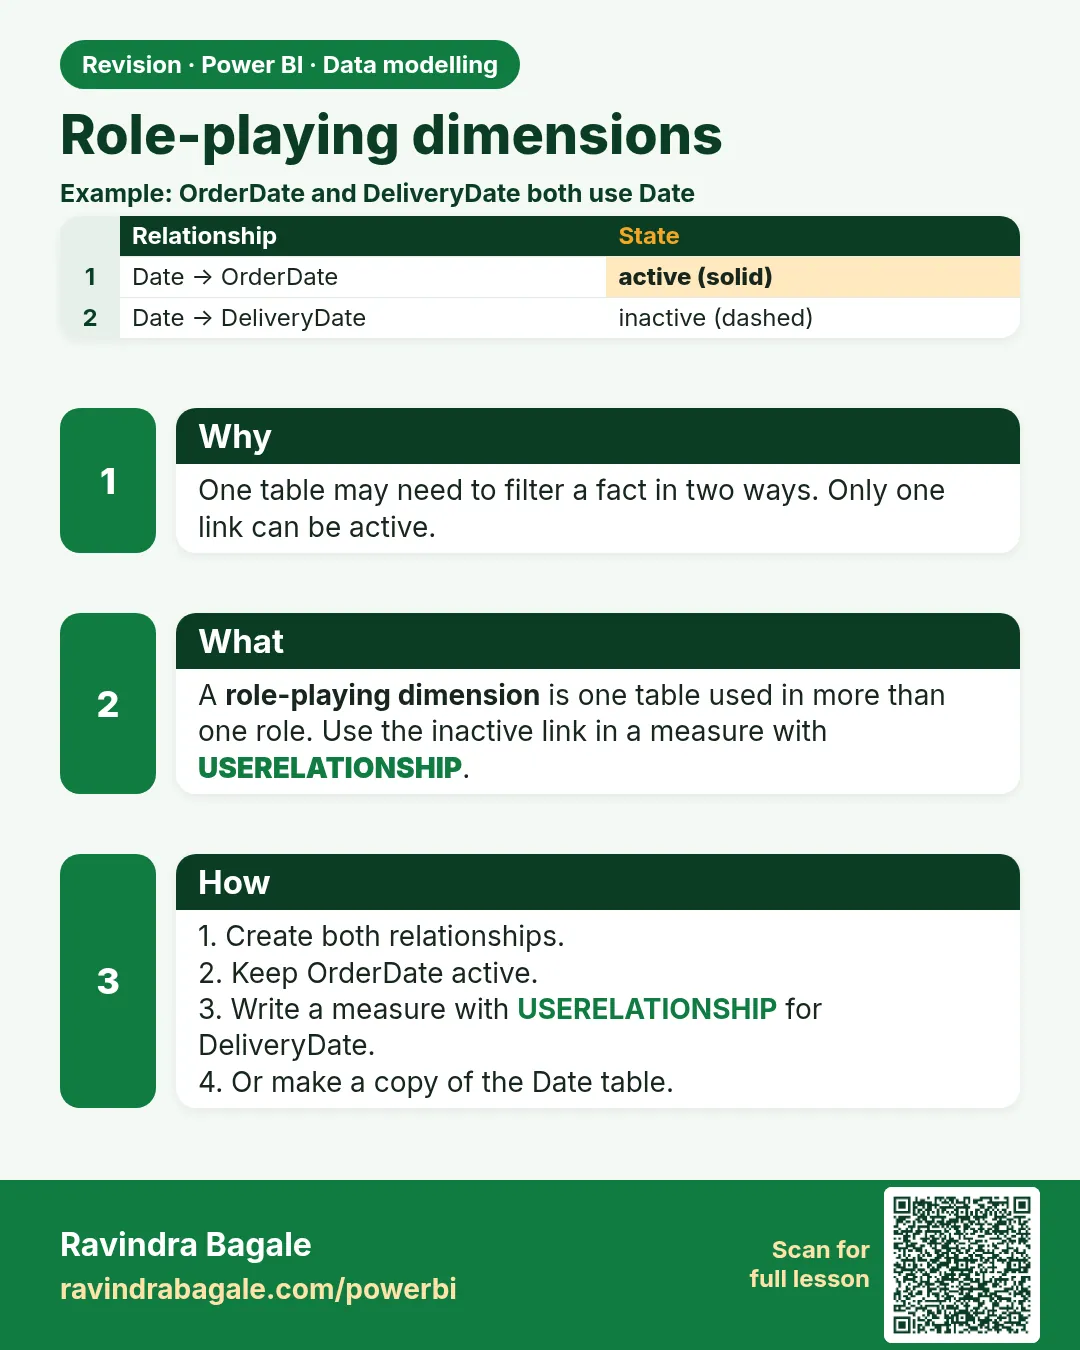
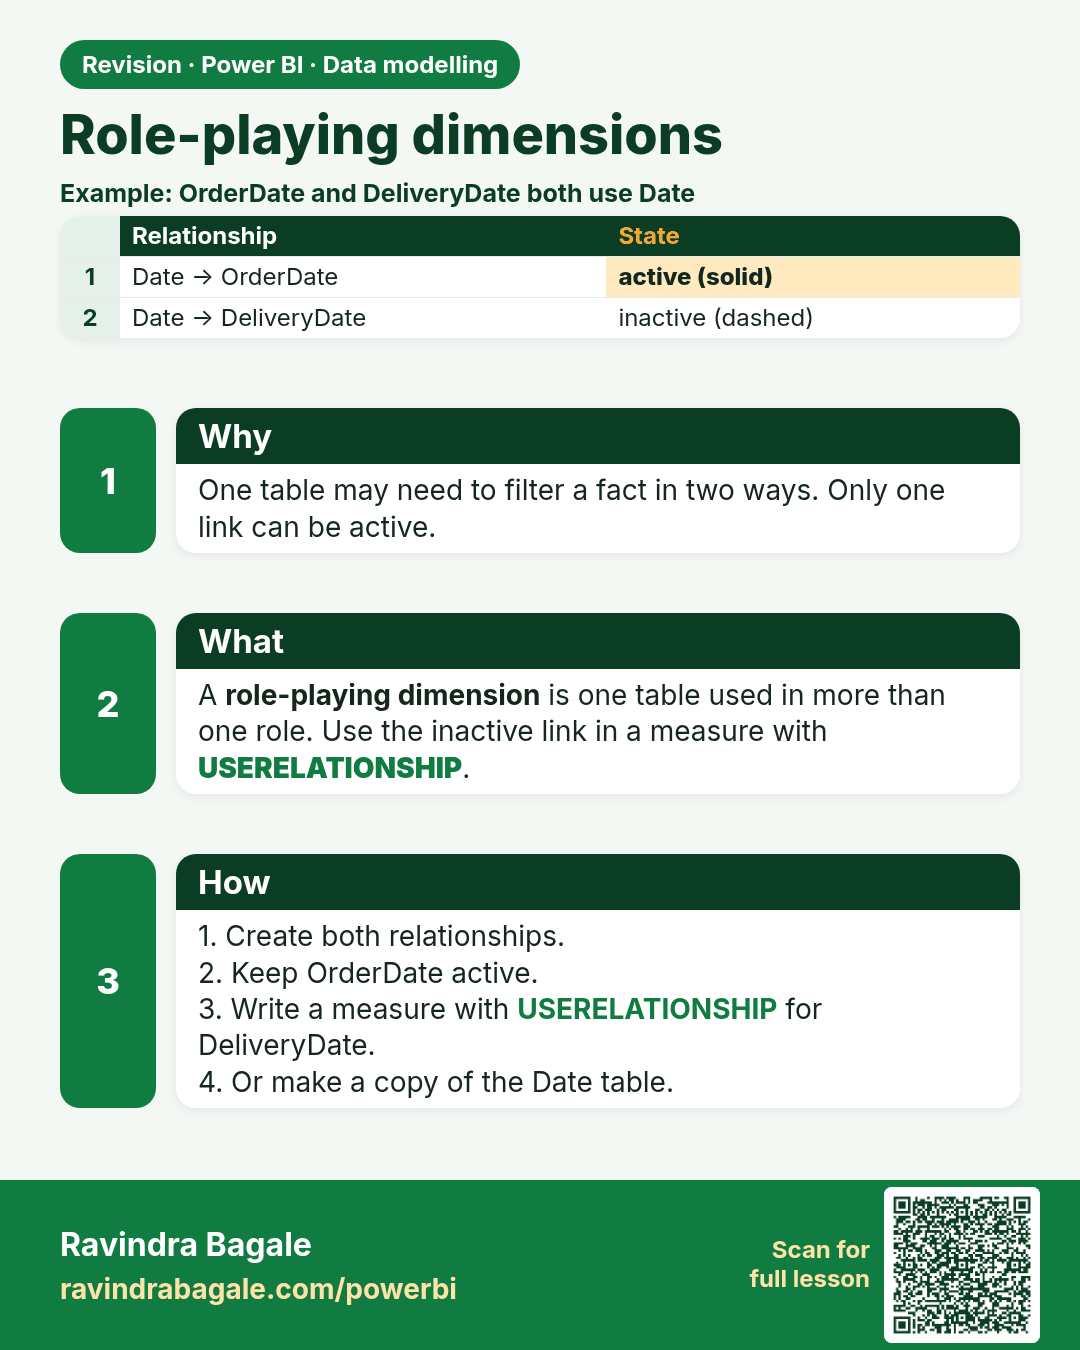
Role-playing dimensions. One table may need to filter a fact in two ways. Only one link can be active.
Revision card 9 of 11: Role-playing dimensions · Download PNG · Open card page

Lesson: 11.10 Role-Playing Dimensions

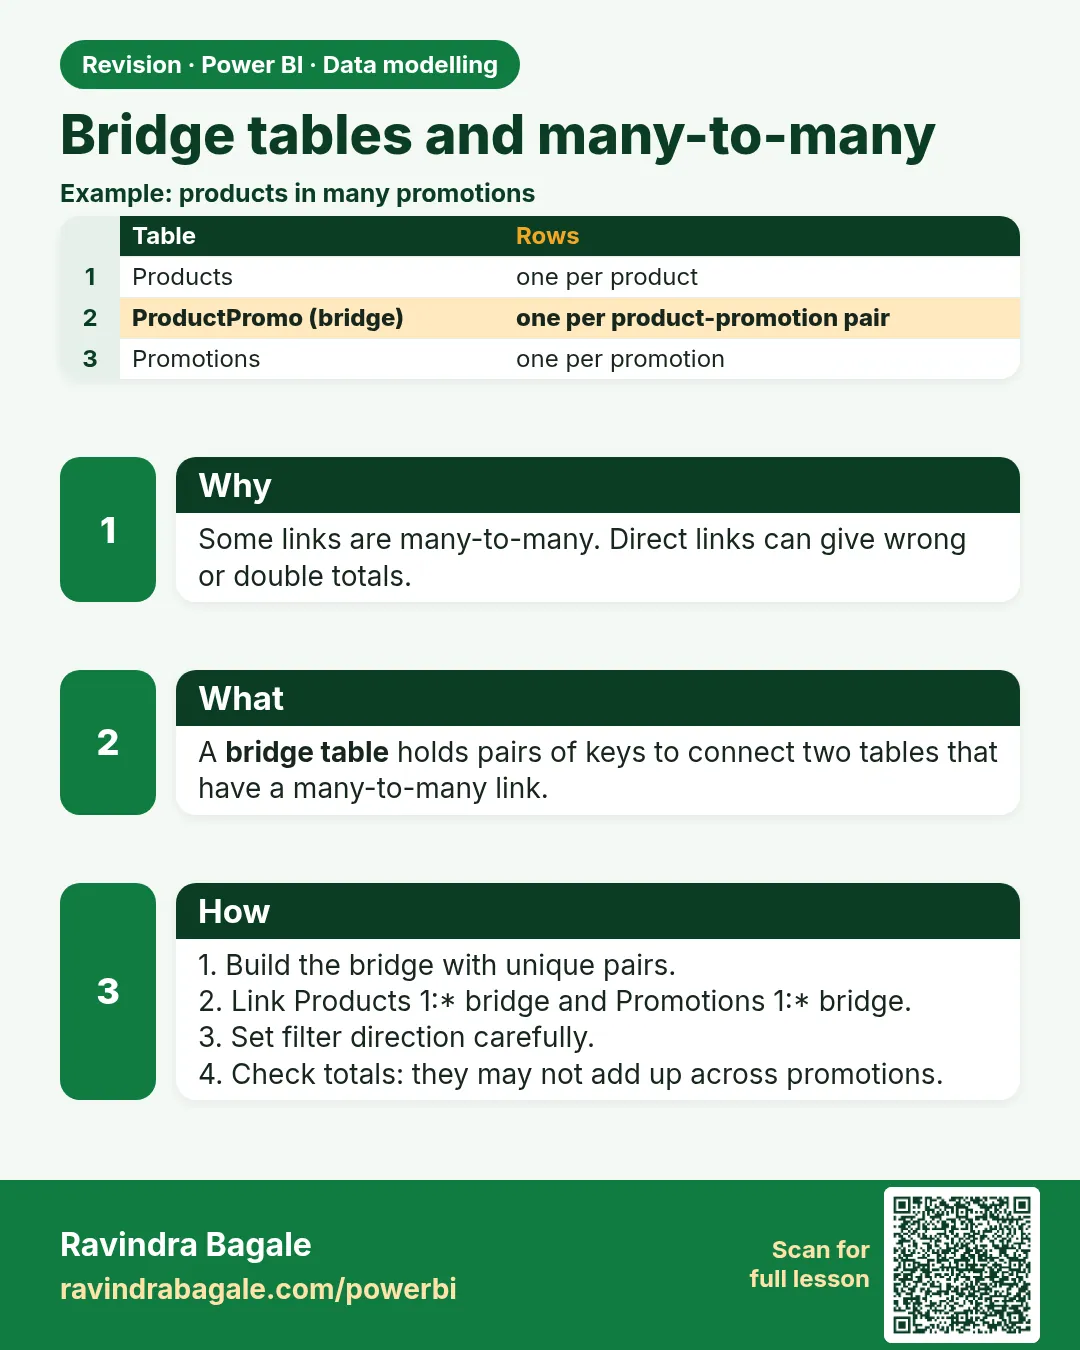
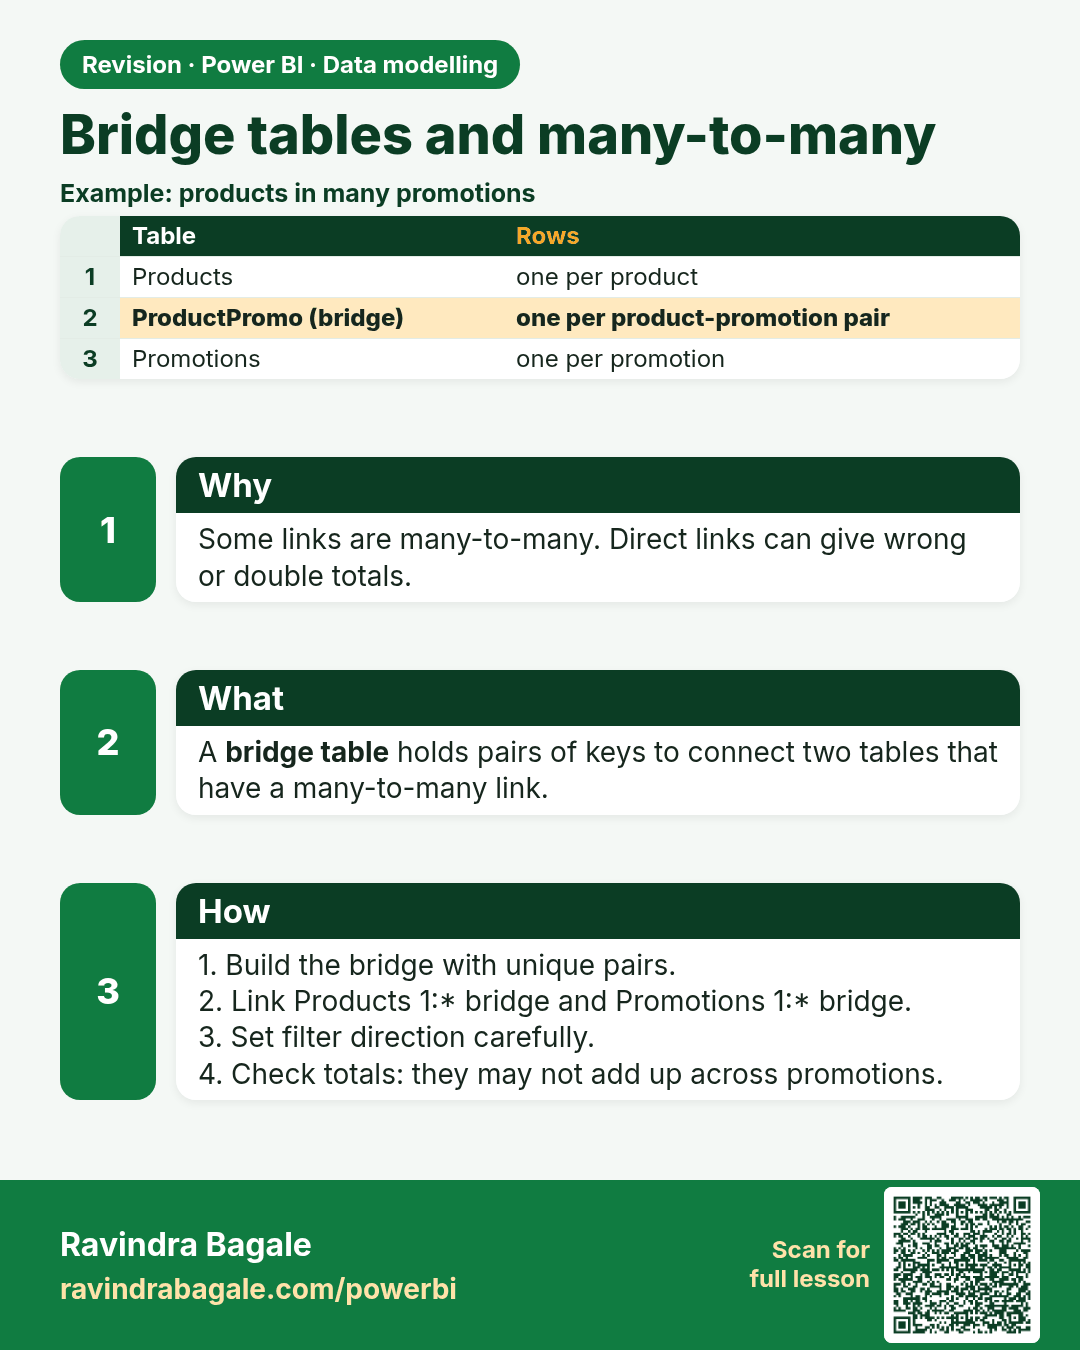
Bridge tables and many-to-many. Some links are many-to-many. Direct links can give wrong or double totals.
Revision card 10 of 11: Bridge tables and many-to-many · Download PNG · Open card page

Lesson: 11.11 Bridge Tables and Many-to-Many

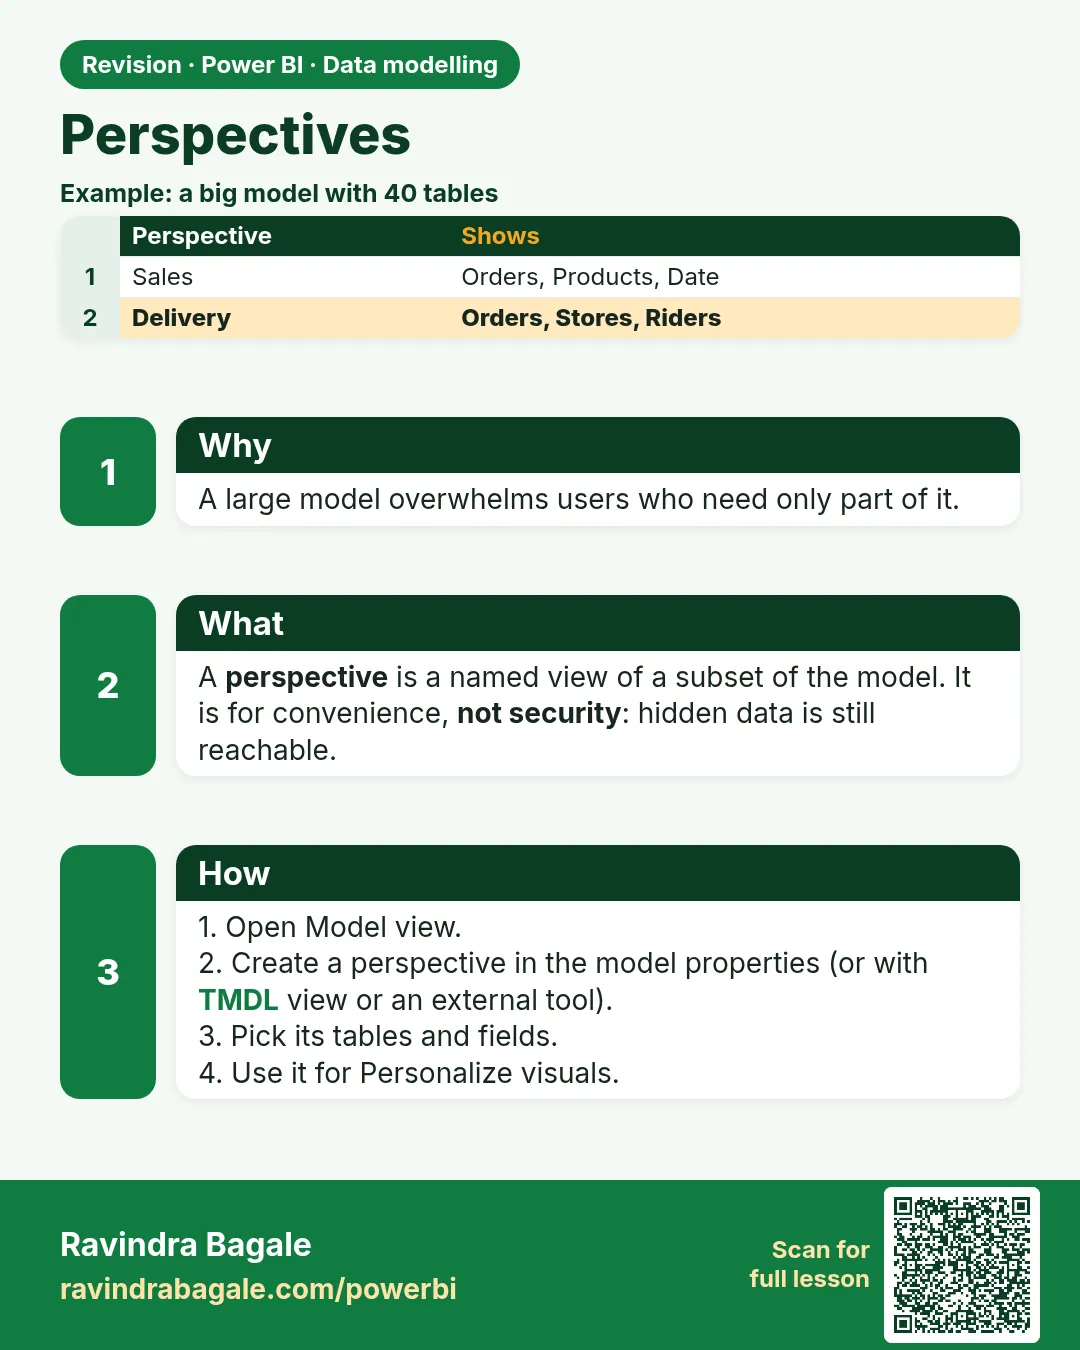
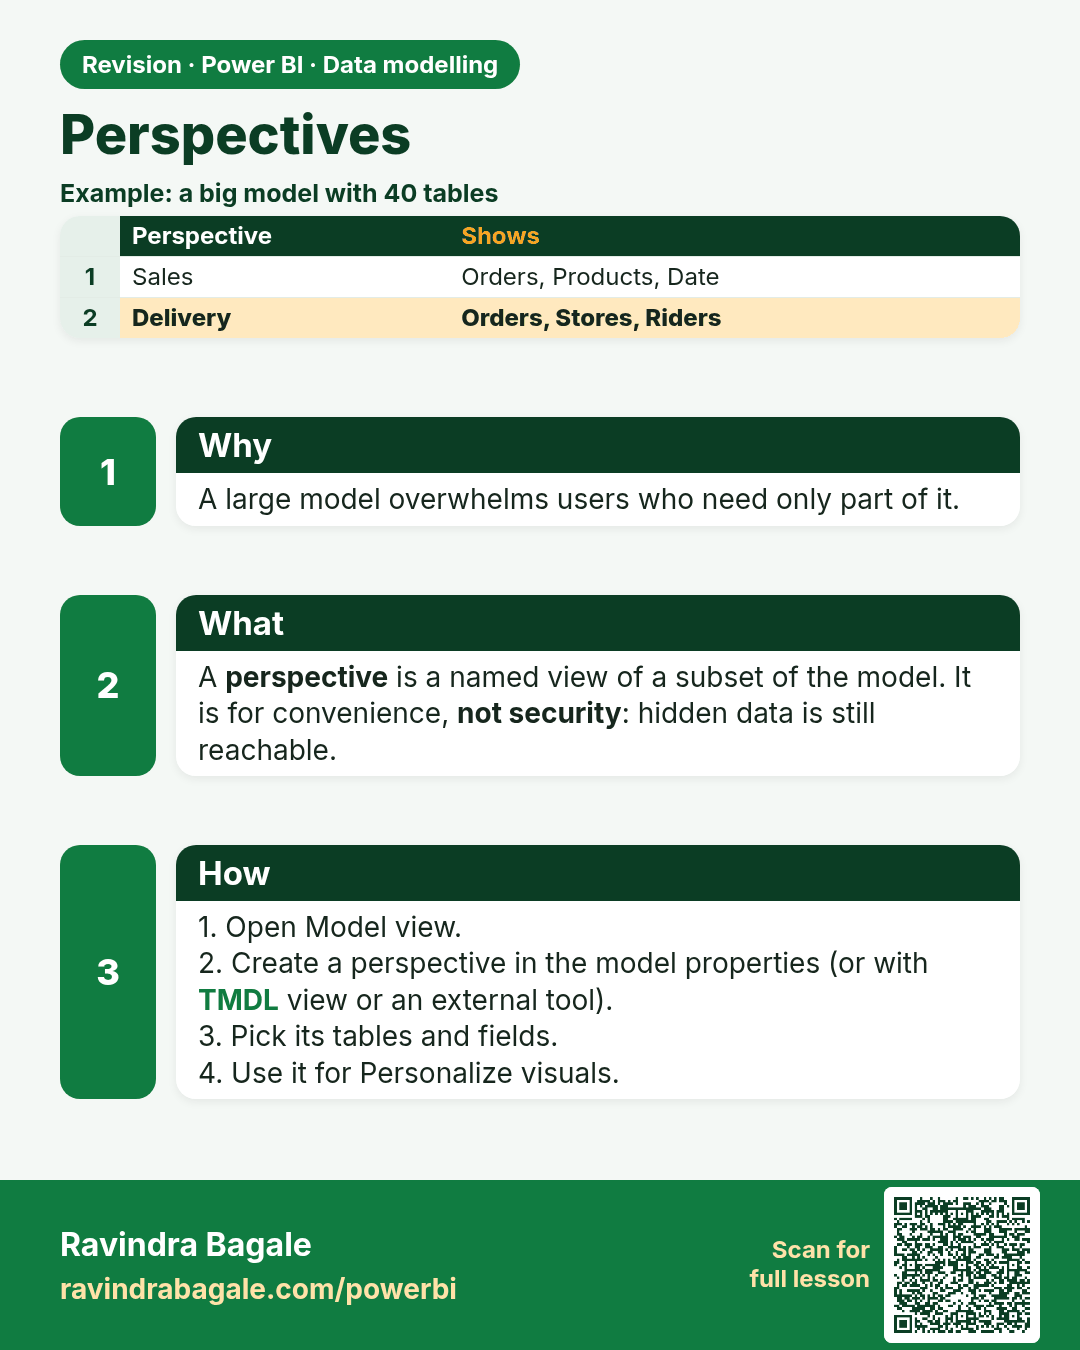
Perspectives. A large model overwhelms users who need only part of it.
Revision card 11 of 11: Perspectives · Download PNG · Open card page

Lesson: 11.12 Perspectives

Interview cards

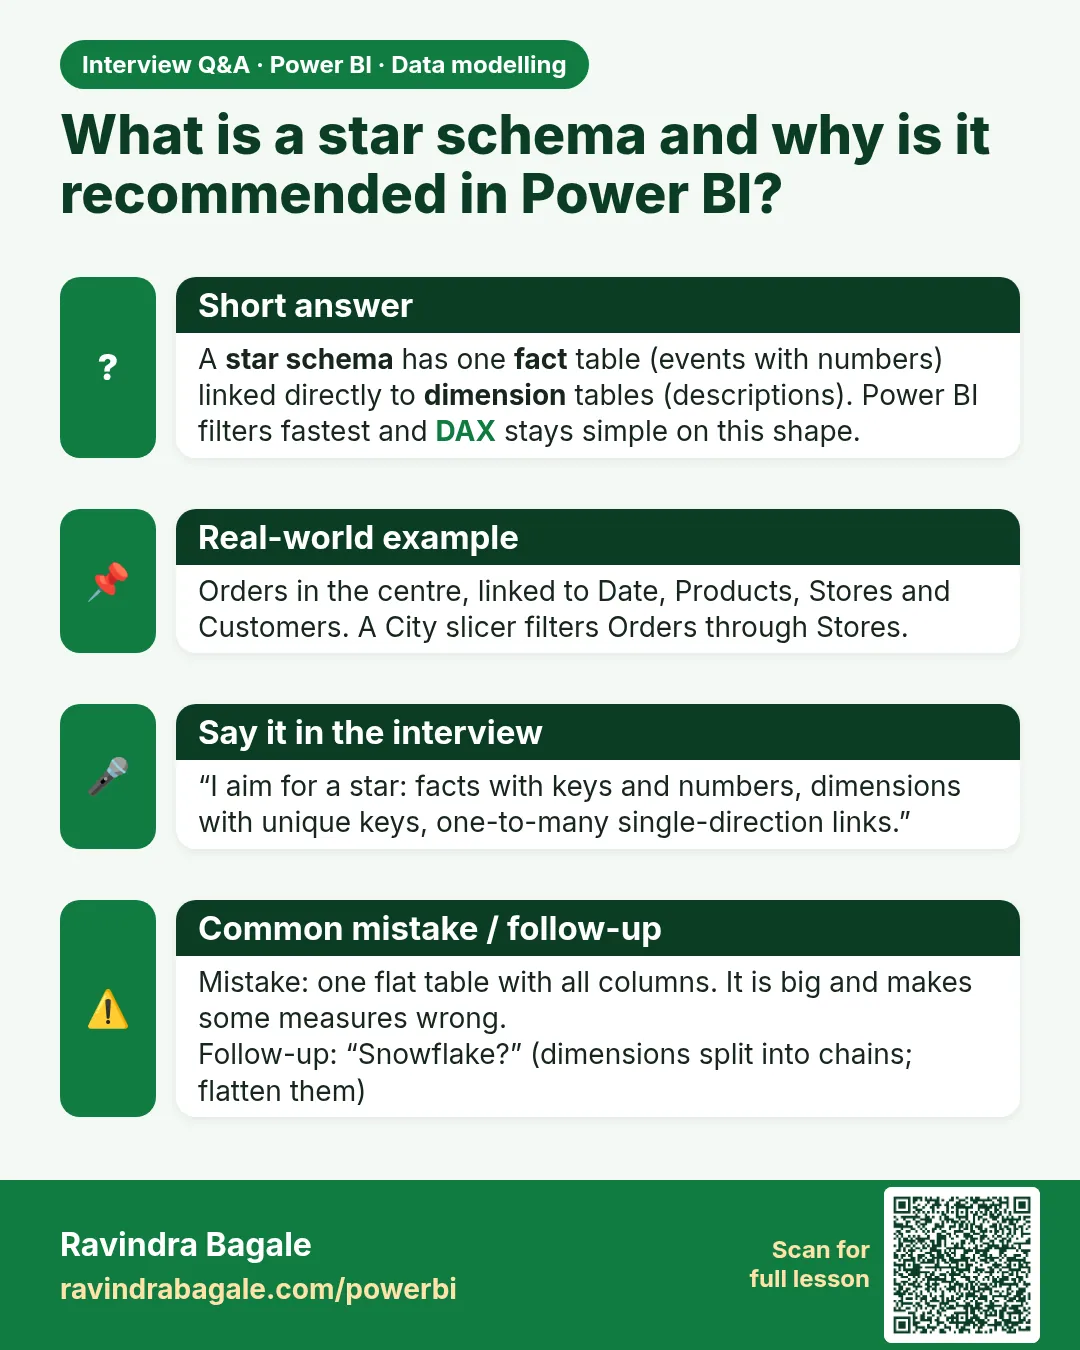
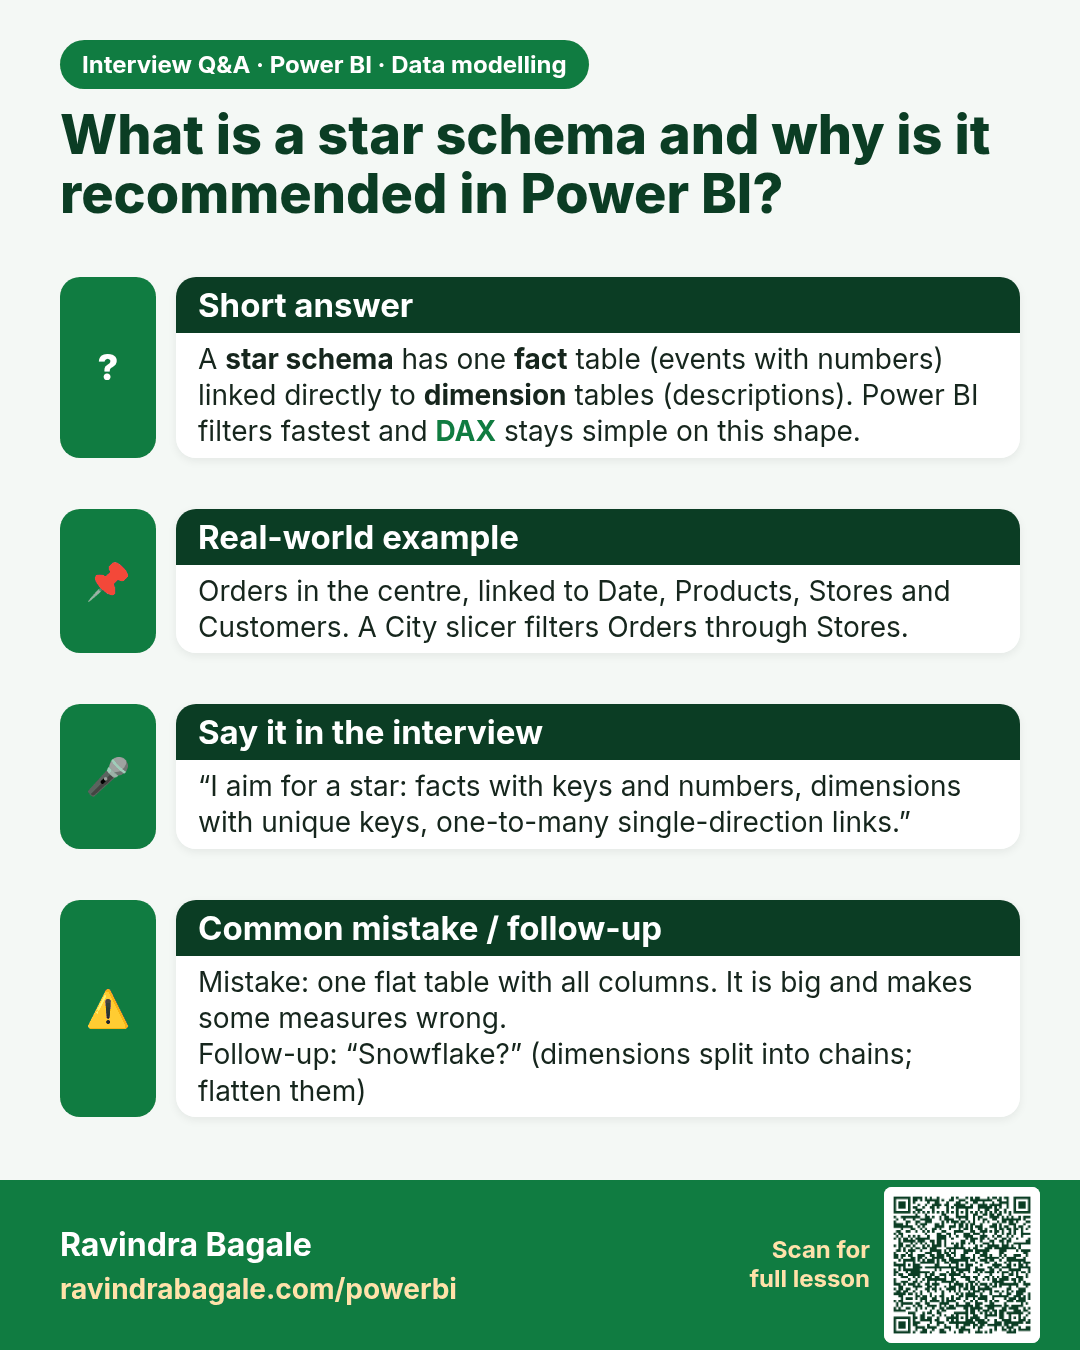
What is a star schema and why is it recommended in Power BI? A star schema has one fact table (events with numbers) linked directly to dimension tables (descriptions). Power BI filters fastest and DAX stays simple on this shape.
Interview card 1 of 3: What is a star schema and why is it recommended in Power BI? · Download PNG · Open card page

Lesson: 11.3 Star Schema vs Snowflake Schema in Power BI with Example
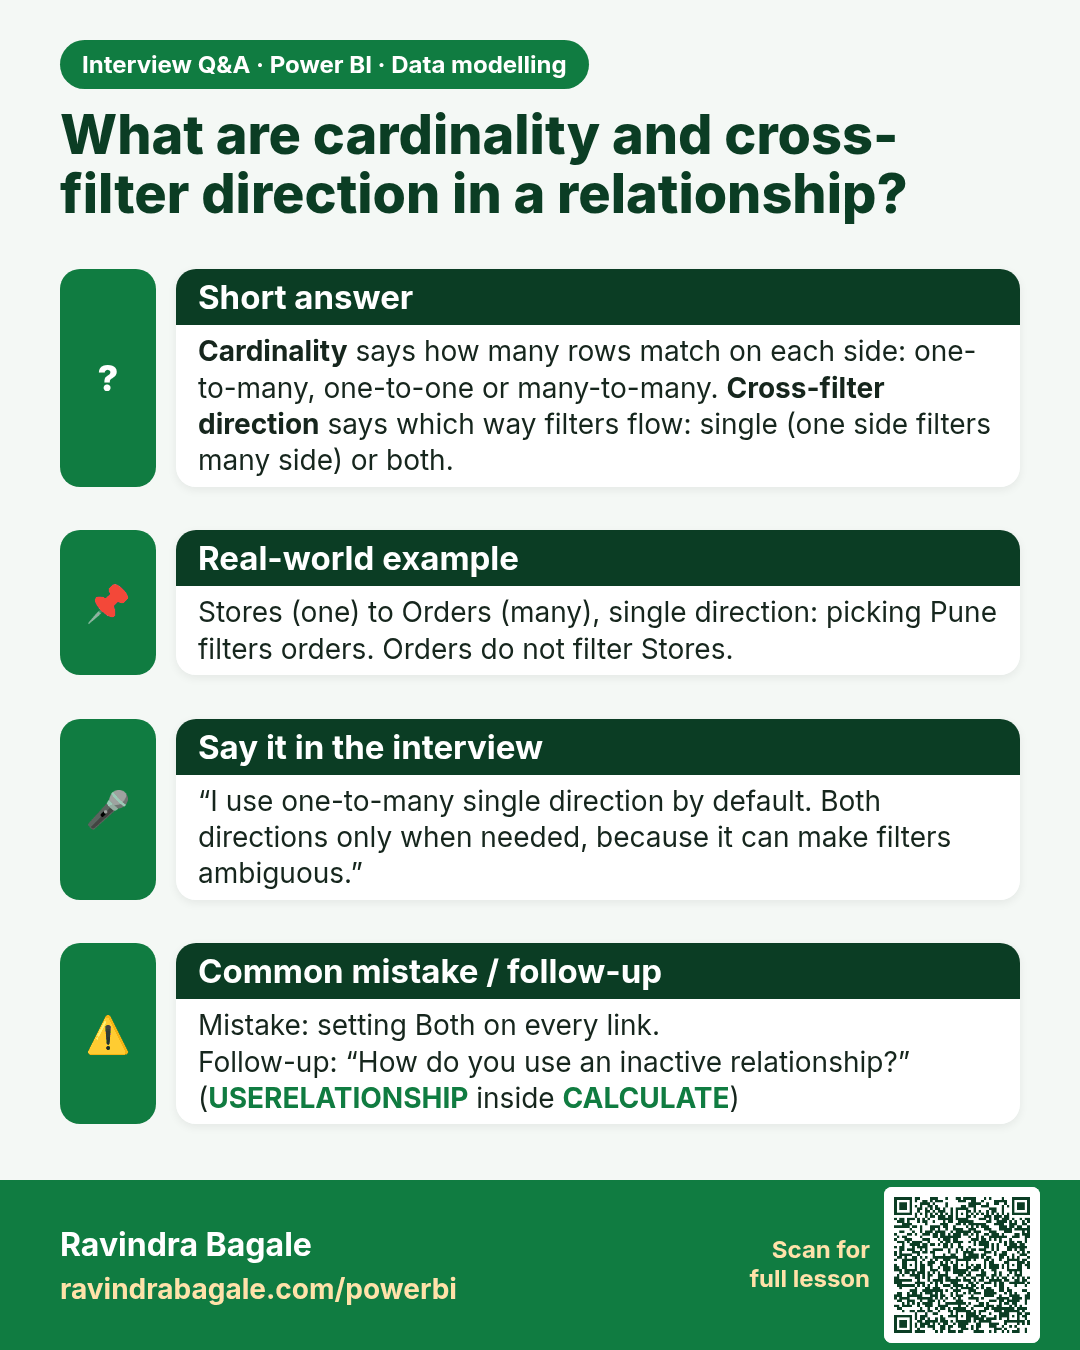
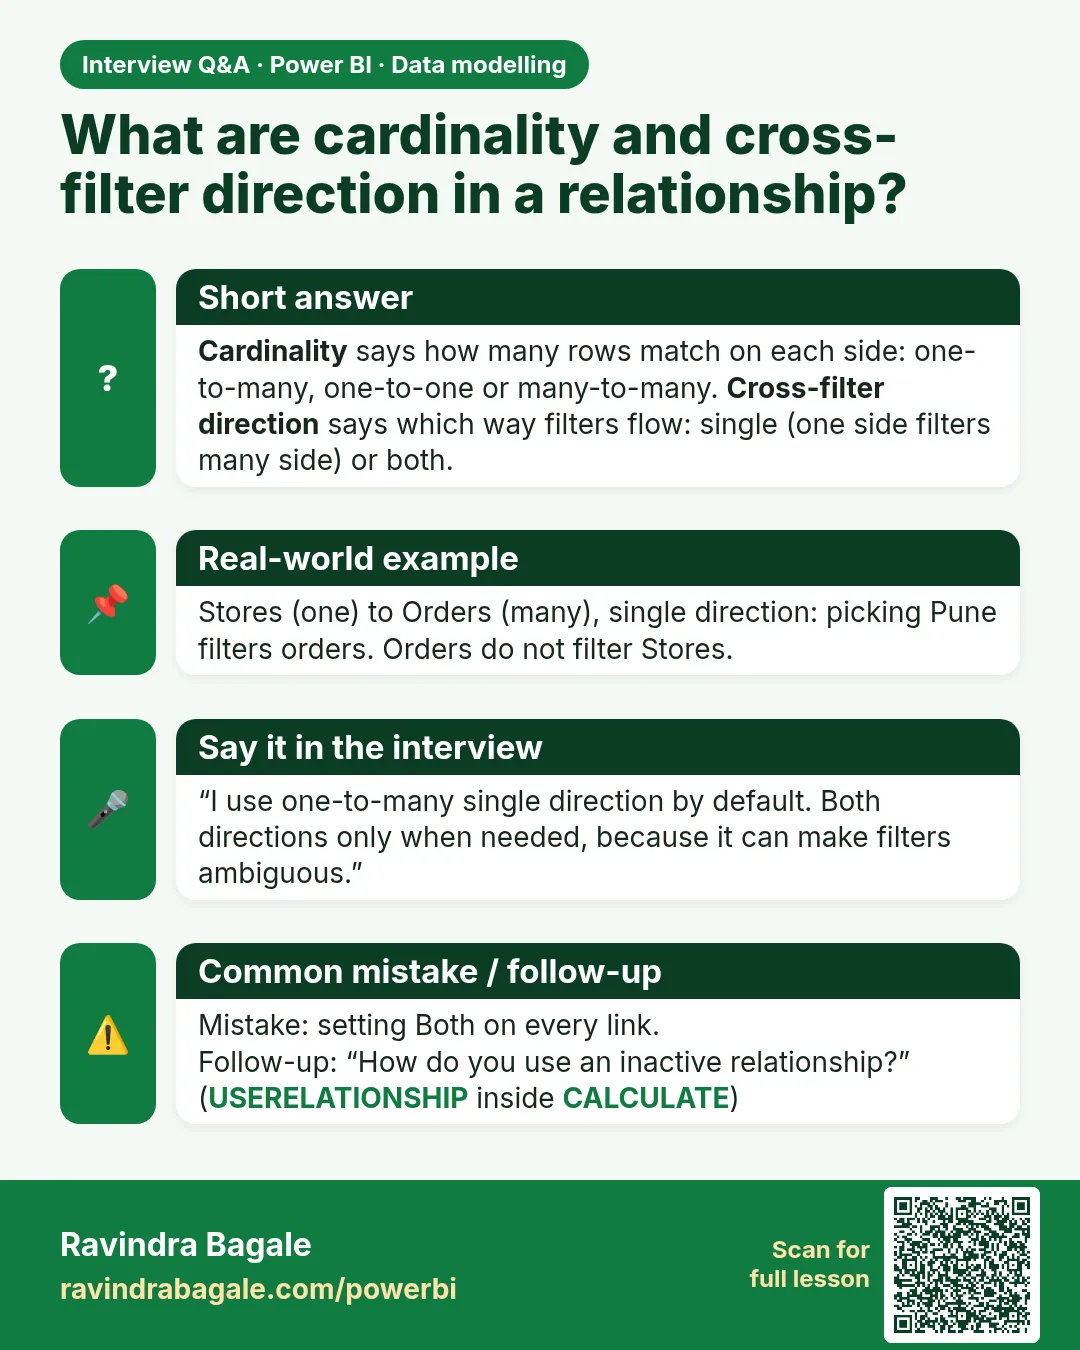
What are cardinality and cross-filter direction in a relationship? Cardinality says how many rows match on each side: one-to-many, one-to-one or many-to-many. Cross-filter direction says which way filters flow: single (one side filters many side) or both.
Interview card 2 of 3: What are cardinality and cross-filter direction in a relationship? · Download PNG · Open card page

Lesson: 11.4 Relationships in Power BI with Example: Cardinality and Direction
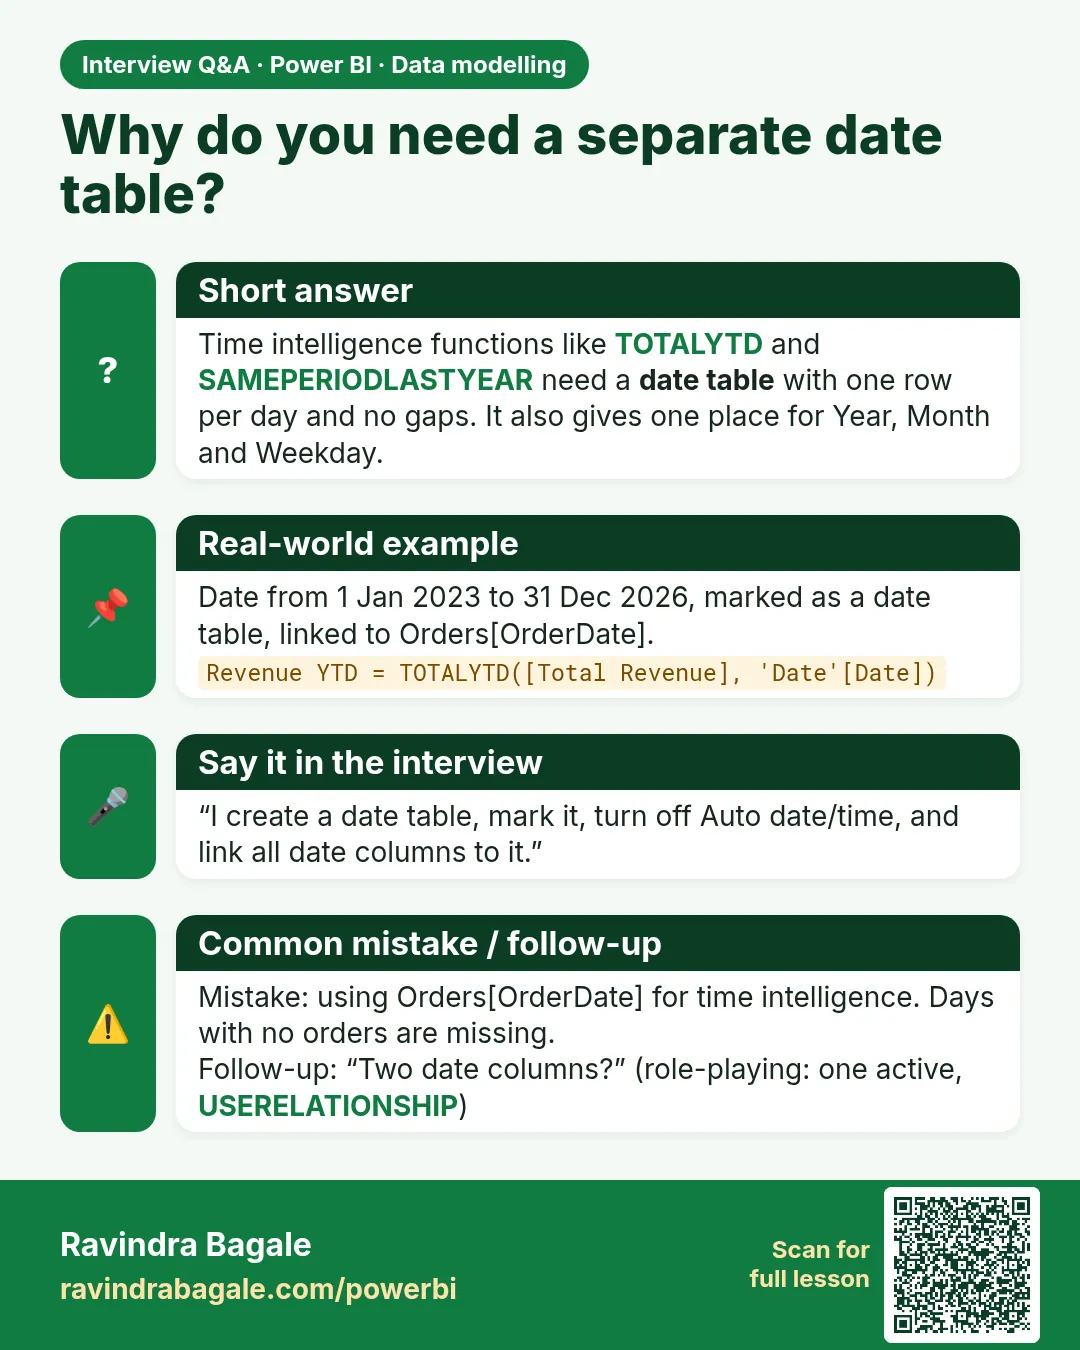
Why do you need a separate date table? Time intelligence functions like TOTALYTD and SAMEPERIODLASTYEAR need a date table with one row per day and no gaps. It also gives one place for Year, Month and Weekday.
Interview card 3 of 3: Why do you need a separate date table? · Download PNG · Open card page

Lesson: 11.5 Date Table in Power BI with Example (April–March FY)
Comparison cards

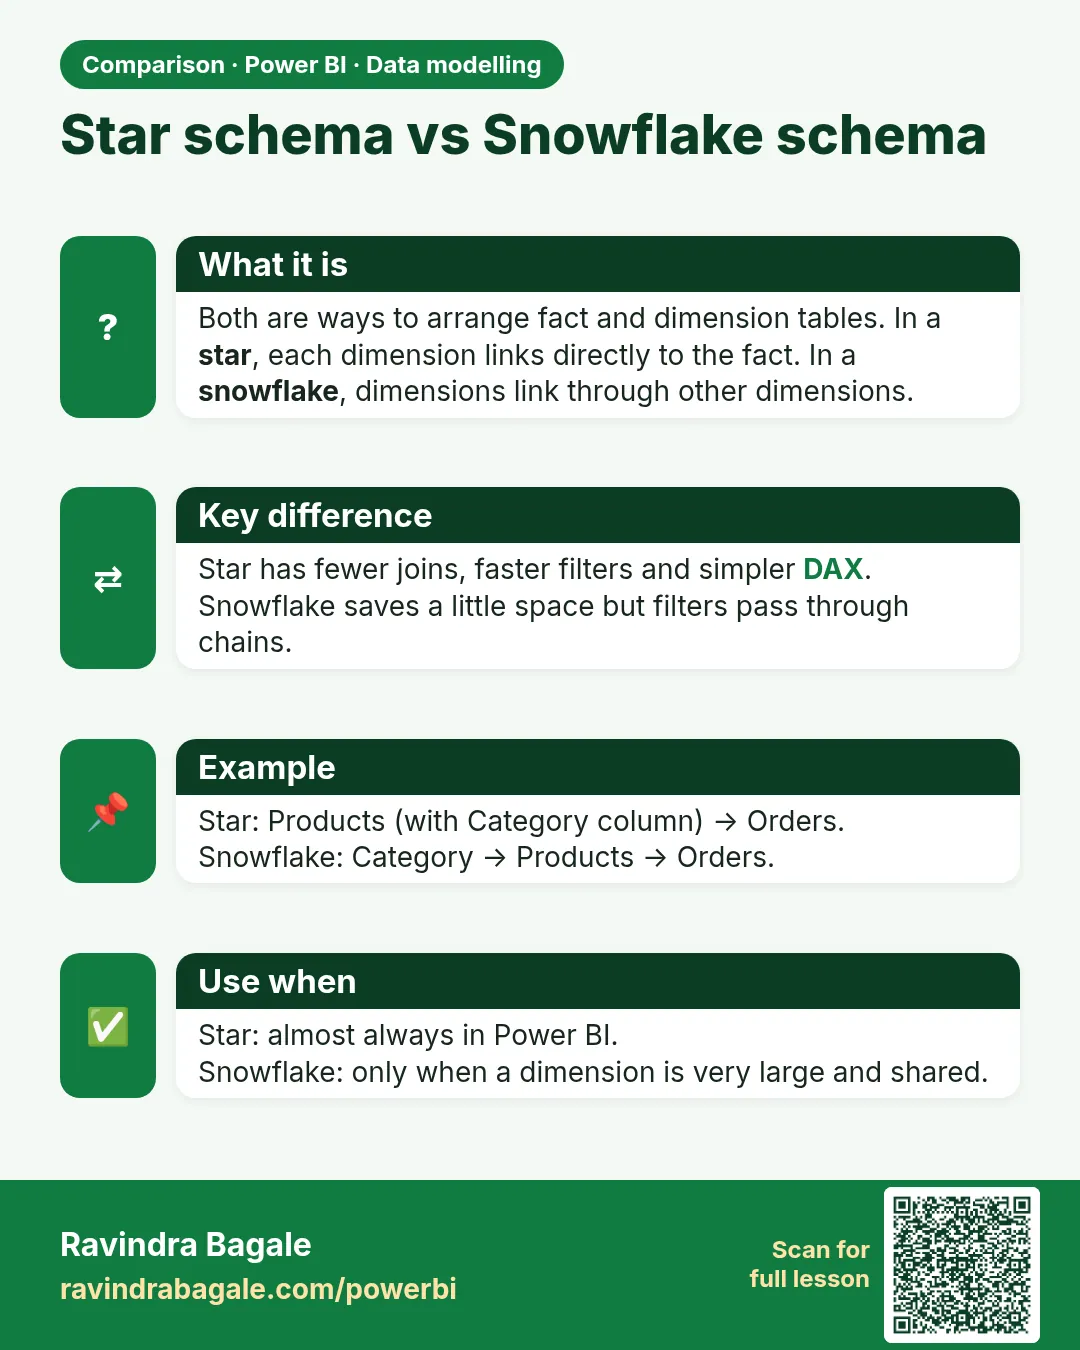
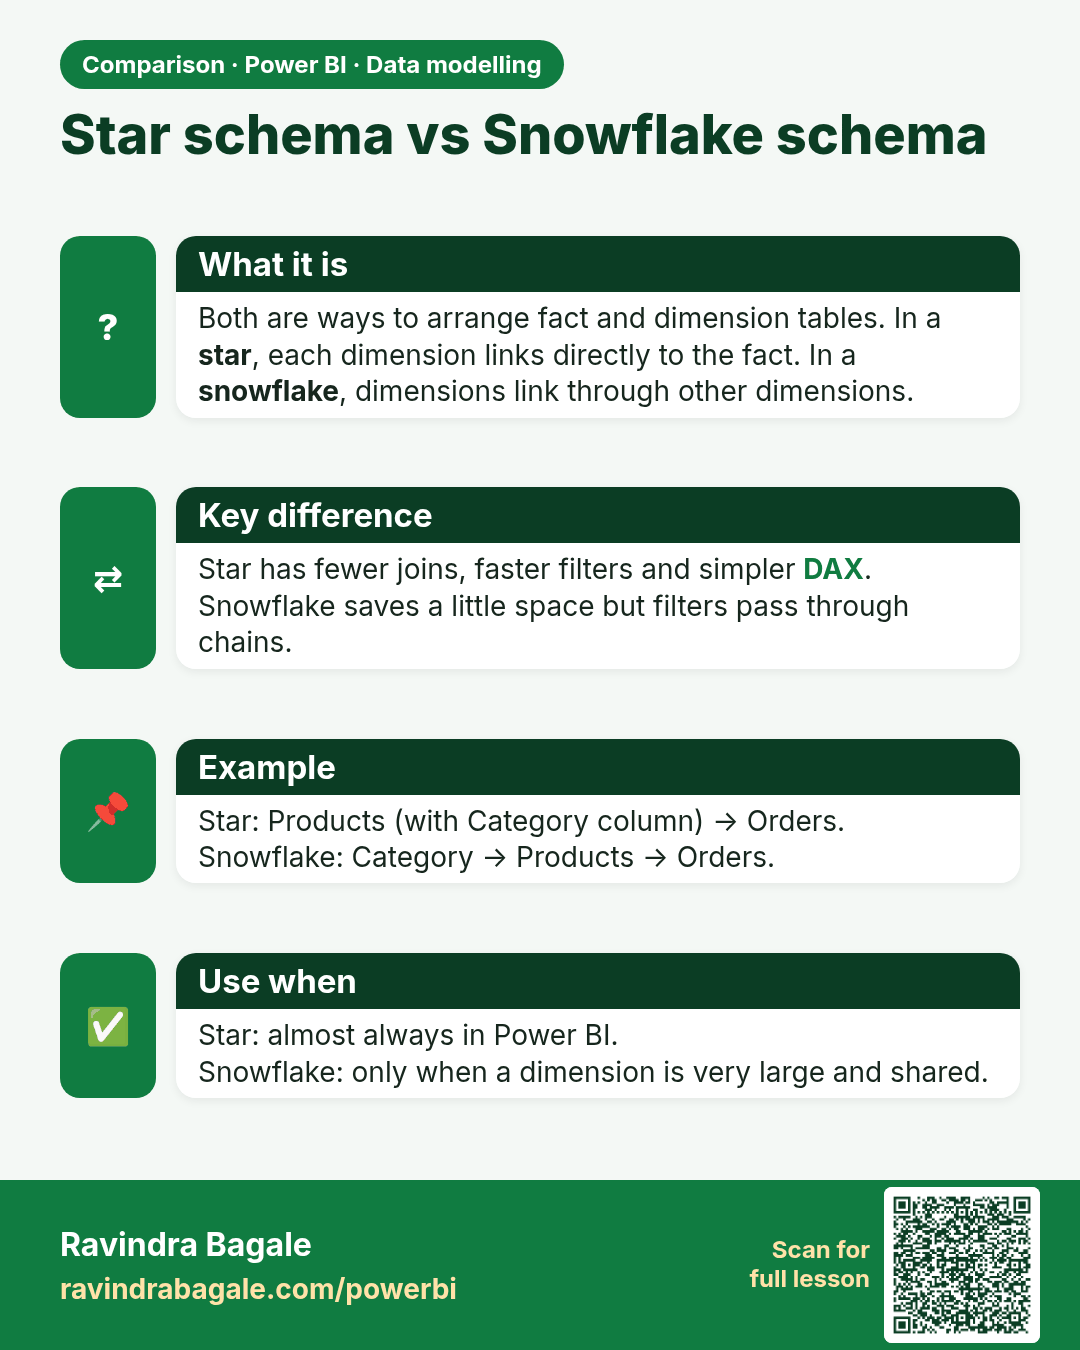
Star schema vs Snowflake schema. Both are ways to arrange fact and dimension tables. In a star, each dimension links directly to the fact. In a snowflake, dimensions link through other dimensions.
Comparison card 1 of 2: Star schema vs Snowflake schema · Download PNG · Open card page

Lesson: 11.3 Star Schema vs Snowflake Schema in Power BI with Example
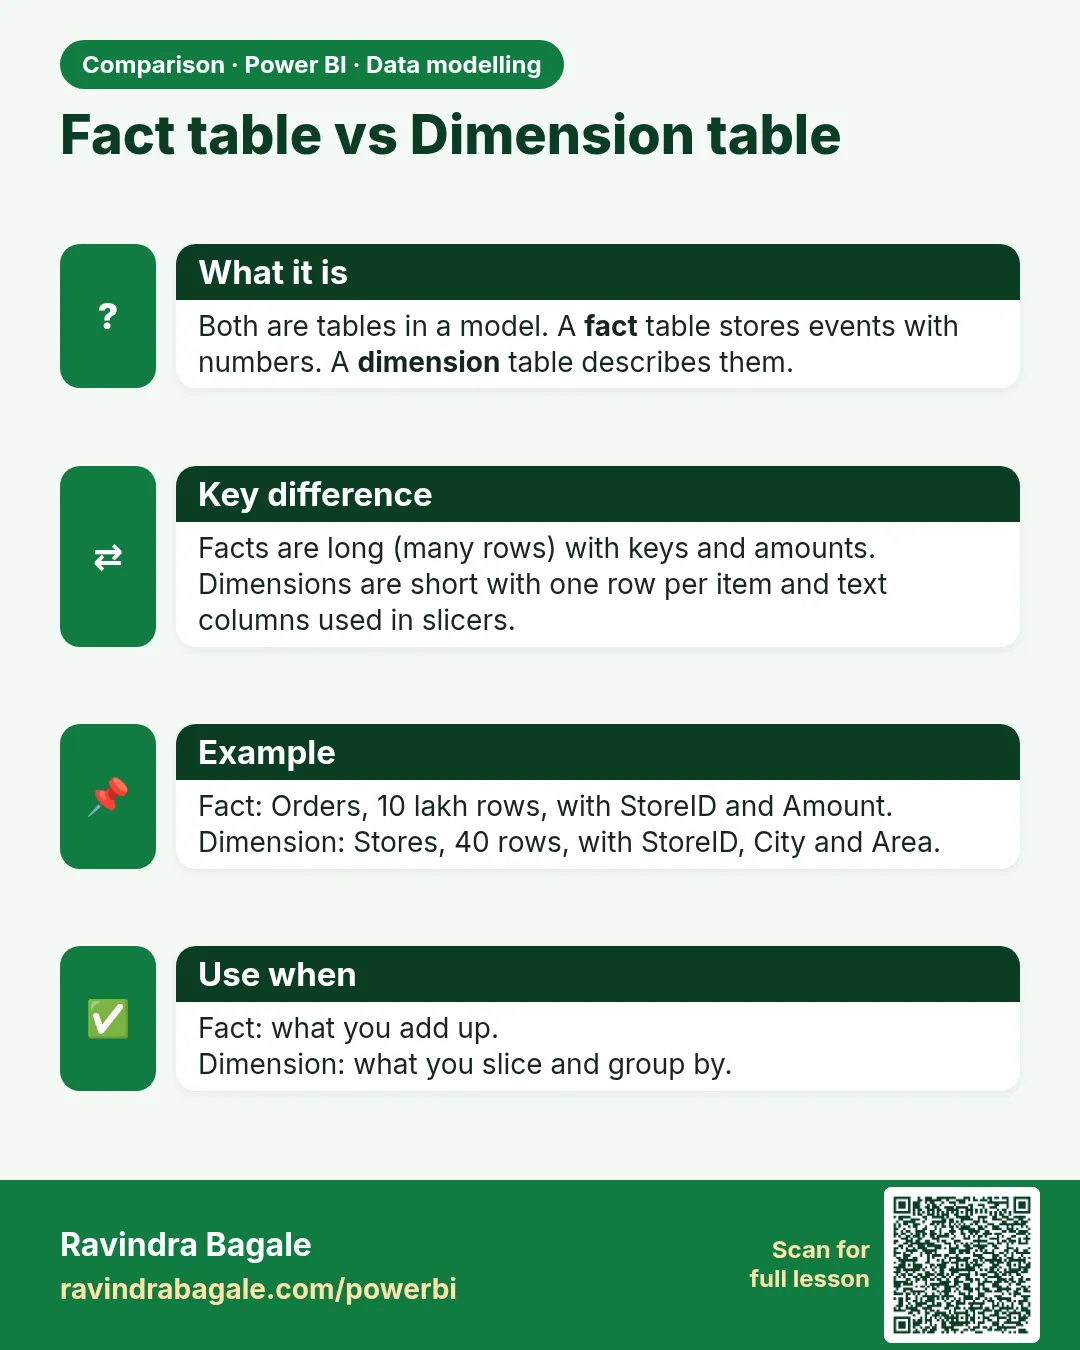
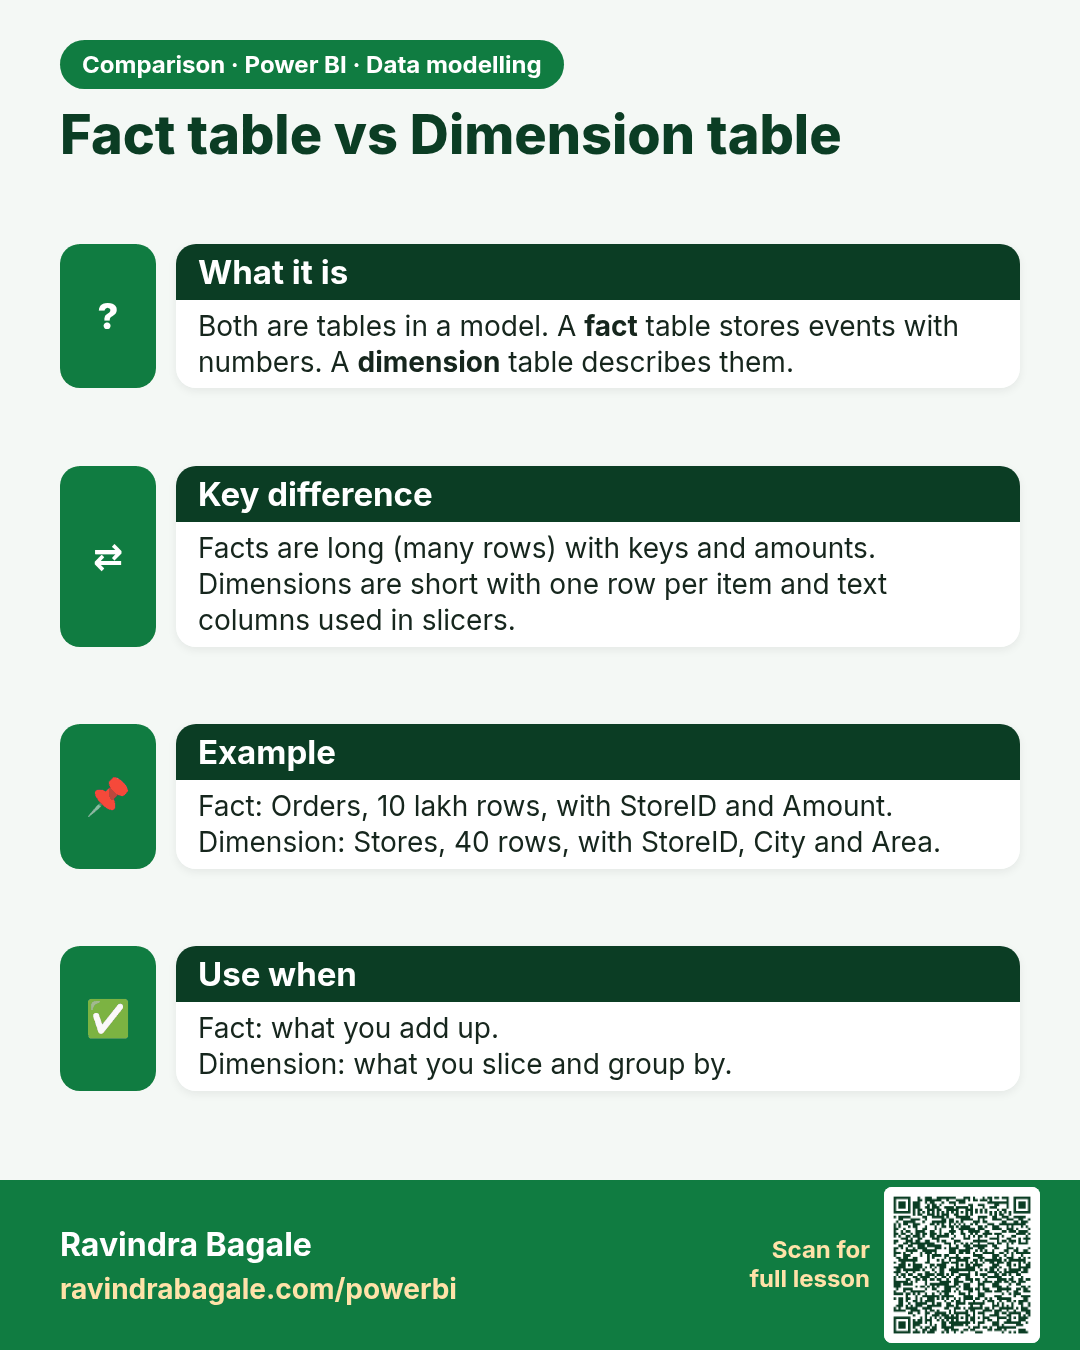
Fact table vs Dimension table. Both are tables in a model. A fact table stores events with numbers. A dimension table describes them.
Comparison card 2 of 2: Fact table vs Dimension table · Download PNG · Open card page

Lesson: 11.2 Fact Tables and Dimension Tables in Power BI with Example