1. Introduction to Business Intelligence and Power BI
1.7 The Quick-Commerce Sample Datasets Used in This Guide
Start with a problem
Salman counts rows in the Orders table and reports 6 orders. Ravina counts receipts and finds 3. Who is right?
Explain simply
Every table has a grain: what one row means. The guide's Orders table has one row per order line (one product in an order). Order-level values such as Delivery Fee repeat on every line of the same order.
Show the data
order_lines_grain.csv (3 orders, 6 lines):
| Order ID | Line No | Product | Amount (₹) | Delivery Fee (₹) | Delivery Mins |
|---|---|---|---|---|---|
| BLK-901 | 1 | Milk 500 ml | 30 | 25 | 9 |
| BLK-901 | 2 | Ladi Pav (6 pcs) | 40 | 25 | 9 |
| BLK-901 | 3 | Thick Poha 1 kg | 70 | 25 | 9 |
| BLK-902 | 1 | Nashik Grapes 500 g | 90 | 0 | 12 |
| BLK-903 | 1 | Bhakarwadi 250 g | 80 | 25 | 11 |
| BLK-903 | 2 | Kokum Sharbat 750 ml | 150 | 25 | 11 |
About this data: This table uses columns: Order ID, Line No, Product, Amount (₹), Delivery Fee (₹), Delivery Mins. This table uses columns: Rows. This table uses columns: Card. Values shown are the lesson examples already on this page (not a new dataset).
Fictional sample data. Practice file: order_lines_grain.csv (source: src/practice/).
Demonstrate
-
Load the practice file › Transform Data › check the row count at the bottom.
Your result should look like this:
Rows 6 (order lines) -
Measure
Orders = DISTINCTCOUNT(Orders[Order ID]).Your result should look like this:
Card 3 -
Measure
Total Sales = SUM(Orders[Amount]).Your result should look like this:
Card ₹460 -
Wrong measure:
SUM(Orders[Delivery Fee]).Your result should look like this:
Card ₹125 (fee counted once per line) -
Right measure:
Delivery Fees = SUMX(VALUES(Orders[Order ID]), CALCULATE(MAX(Orders[Delivery Fee]))).Your result should look like this:
Card ₹50 (25 + 0 + 25) -
Average delivery per order:
AVERAGEX(VALUES(Orders[Order ID]), CALCULATE(MAX(Orders[Delivery Mins]))).Your result should look like this:
Card 10.67 min (not 10.17)
Show the result
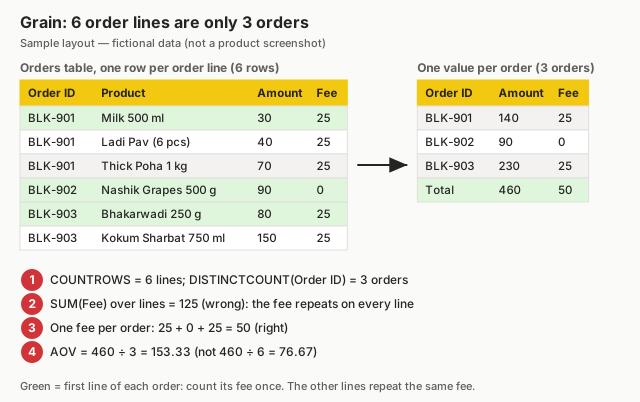
Your result should look like this (fictional sample):
| Measure | Wrong (per line) | Right (per order) |
|---|---|---|
| Count | 6 | 3 |
| Delivery fees (₹) | 125 | 50 |
| Avg delivery (min) | 10.17 | 10.67 |
| AOV (₹) | 76.67 | 153.33 |
Explain what happened
Order-level values repeat on each line, so line-level SUM and AVERAGE count BLK-901 three times. Taking one value per order first fixes it. AOV = ₹460 ÷ 3 = ₹153.33.
Explore further
- The canonical practice file visuals_orders_apr_may_2026.csv is one row per order, so there COUNTROWS = orders.
- All sample times are IST (UTC+5:30); see 7.14 for converting UTC.
Detailed reference for this lesson:
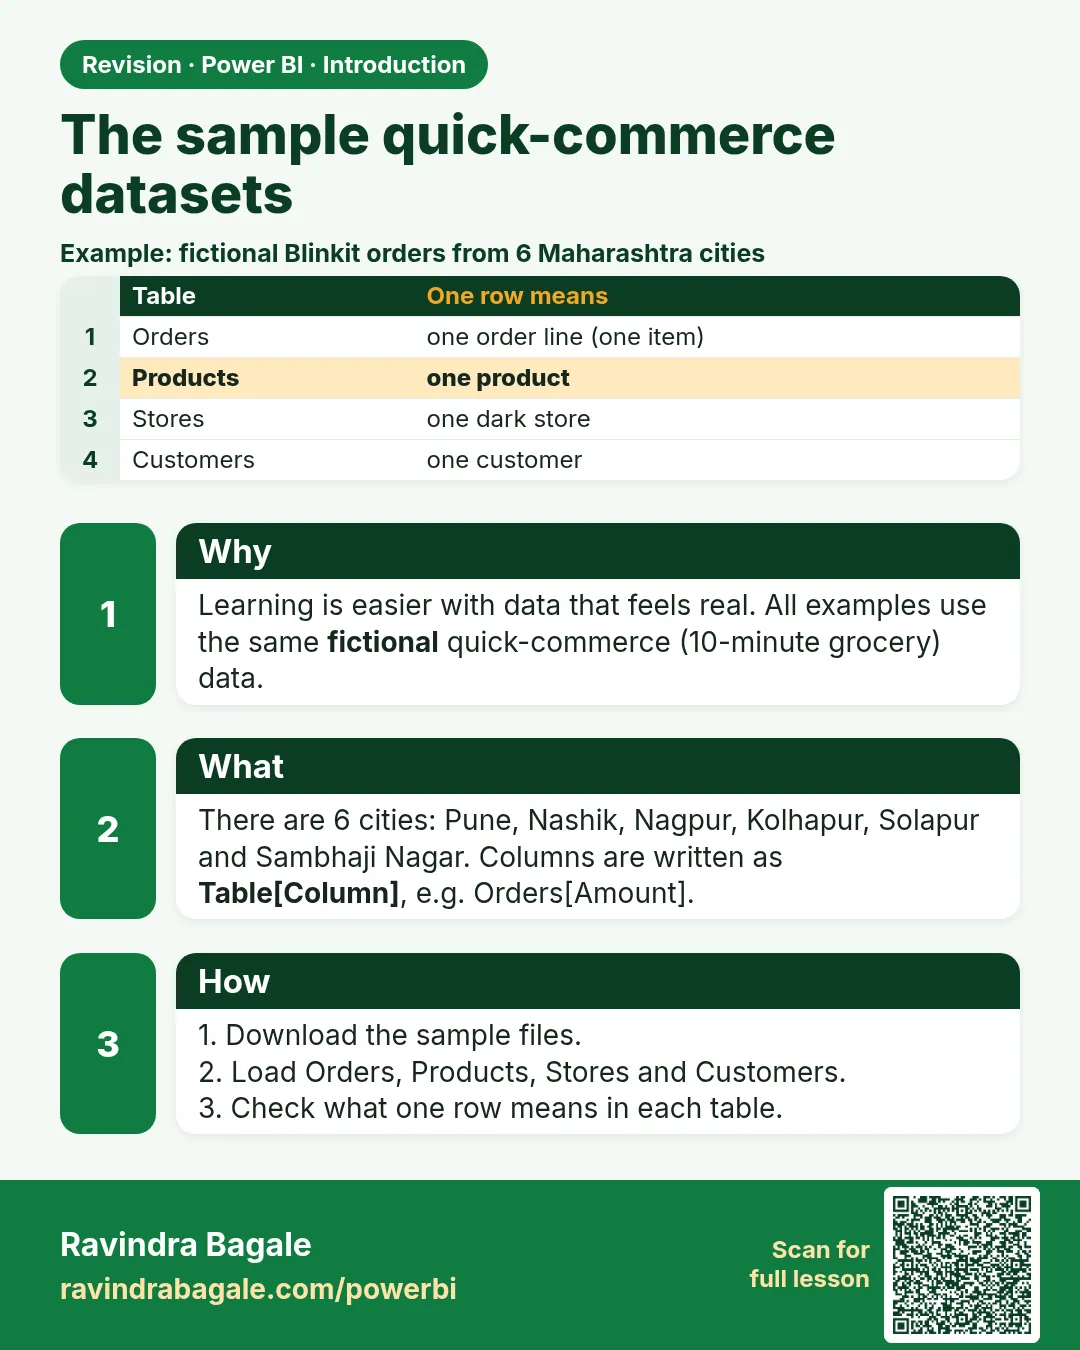
Keep this in mind: to keep learning practical, every example in this course uses quick-commerce (10-minute grocery delivery) data from six cities in Maharashtra: Pune, Nashik, Nagpur, Kolhapur, Mumbai and Sambhaji Nagar. The main running example is Blinkit order data. A second dataset with the same columns, Amazon Now order data, is used in some examples, in the append/merge lessons, in exercises and on a platform comparison page in the project.
लक्षात ठेवा: शिकणं practical राहावं म्हणून या कोर्समधलं प्रत्येक उदाहरण Maharashtra च्या सहा शहरांचा quick-commerce (10 मिनिटांत किराणा delivery) data वापरतं: Pune, Nashik, Nagpur, Kolhapur, Mumbai आणि Sambhaji Nagar. मुख्य उदाहरण Blinkit चा order data आहे. त्याच columns चा दुसरा dataset, Amazon Now चा order data, काही उदाहरणांत, append/merge च्या lessons मध्ये, exercises मध्ये आणि project मधल्या platform comparison page वर वापरला आहे.
याद रखिए: सीखना practical रहे, इसलिए इस कोर्स का हर उदाहरण Maharashtra के छह शहरों का quick-commerce (10 मिनट में किराना delivery) data इस्तेमाल करता है: Pune, Nashik, Nagpur, Kolhapur, Mumbai और Sambhaji Nagar. मुख्य उदाहरण Blinkit का order data है. उन्हीं columns वाला दूसरा dataset, Amazon Now का order data, कुछ उदाहरणों में, append/merge के lessons में, exercises में और project के platform comparison page पर इस्तेमाल हुआ है.
Important: fictional sample data
The Blinkit and Amazon Now datasets in this guide are fictional sample data created only for learning. They do not represent real company figures, real customers, real stores or real performance, and nothing in this guide is a statement about either company. The company names are used fakt to make the examples feel familiar. All person names are sample names.
Naming convention used in this guide
Columns are written as Table[Column], for example Orders[Amount]. Measures are written in square brackets only, for example [Total Sales]. This is also the recommended convention in real projects – it makes it easy to tell measures and columns apart.
The raw files use compact column names such as OrderID and OrderDateTime. In Power Query we rename them to friendly names such as Order ID and Order DateTime (a best practice covered in Module 11). The friendly names are used in all DAX examples.
Orders (fact table – one row per order line)
| Column (raw name) | Friendly name | Data type | Example |
|---|---|---|---|
| OrderID | Order ID | Text | BLK-250314-0457 |
| OrderDateTime | Order DateTime (IST) | Date/Time | 14-03-2025 19:42 |
| – (added in Power Query) | Order Date, Order Hour | Date, Whole number | 14-03-2025, 19 |
| CustomerID | Customer ID | Text | C-0102 |
| StoreID | Store ID | Text | BLK-PUN-01 |
| ProductID | Product ID | Text | P-021 |
| Quantity | Quantity | Whole number | 2 |
| Amount | Amount | Fixed decimal (₹) | ₹ 54.00 (line value after discount) |
| Discount | Discount | Fixed decimal (₹) | ₹ 6.00 |
| DeliveryFee | Delivery Fee | Fixed decimal (₹) | ₹ 25.00 |
| DeliveryTimeMins | Delivery Time Mins | Whole number | 9 |
| DeliveredDateTime | Delivered DateTime (and Delivered Date) | Date/Time | 14-03-2025 19:51 |
| DeliveryPartnerID | Delivery Partner ID | Text | DP-017 |
| OrderStatus | Order Status | Text | Delivered / Cancelled |
| PaymentMode | Payment Mode | Text | UPI / Card / Cash on Delivery / Wallet |
| Platform | Platform | Text | Blinkit / Amazon Now |
All times in the sample data are in Indian Standard Time (IST, UTC+5:30). Module 7.14 shows how to convert UTC timestamps to IST in Power Query if a source system stores UTC.
Understand the grain
Each row is one order line (one product inside an order). An order with three products has three rows with the same Order ID. Order-level columns – Delivery Fee, Delivery Time Mins, Delivered DateTime, Delivery Partner ID, Order Status, Payment Mode – repeat on every line of that order. That is why orders are counted with DISTINCTCOUNT(Orders[Order ID]), not COUNTROWS. In this sample data, cancelled orders have Amount, Discount and Delivery Fee = 0 and a blank Delivery Time.
Product (dimension)
| Column | Example |
|---|---|
| Product ID | P-021 |
| Product Name | Gokul Cow Milk 500 ml |
| Category | Dairy & Breakfast |
| Sub Category | Milk |
| Brand | Gokul |
| Unit Price | ₹ 30.00 |
| Unit Cost | ₹ 26.00 |
Customer (dimension)
| Column | Example |
|---|---|
| Customer ID | C-0102 |
| Customer Name | Ruhi Bagale |
| Gender | Female |
| City | Pune |
| Area | Baner |
| Signup Date | 05-08-2023 |
DeliveryPartner (dimension)
| Column | Example |
|---|---|
| Delivery Partner ID | DP-017 |
| Partner Name | Salman |
| Vehicle Type | Bike / EV Scooter / Bicycle |
| Home Store ID | BLK-PUN-01 |
| Joining Date | 12-01-2024 |
DarkStore (dimension)
| Column | Example |
|---|---|
| Store ID | BLK-PUN-01 |
| Store Name | Kothrud Hub |
| Platform | Blinkit |
| Area | Kothrud |
| City | Pune |
| State / Country | Maharashtra / India |
| City Manager | Ravindra Bagale |
| Manager Email | ravindra.bagale@example.com |
Date (dimension, see Module 11)
| Column | Example |
|---|---|
| Date | 14-03-2025 |
| Year / Quarter | 2025 / Q1 |
| Month Number / Name | 3 / March |
| Year Month | 2025-03 |
| Day Name | Friday |
| Festival | Diwali / Ganeshotsav / (blank) |
Sample products with a local Maharashtra flavour
| Product ID | Product Name | Category | Sub Category |
|---|---|---|---|
| P-001 | Nashik Grapes 500 g | Fruits & Vegetables | Fresh Fruits |
| P-002 | Nagpur Oranges 1 kg | Fruits & Vegetables | Fresh Fruits |
| P-021 | Gokul Cow Milk 500 ml | Dairy & Breakfast | Milk |
| P-022 | Amul Butter 100 g | Dairy & Breakfast | Butter & Cheese |
| P-031 | Thick Poha 1 kg | Dairy & Breakfast | Breakfast Staples |
| P-032 | Ladi Pav (6 pcs) | Dairy & Breakfast | Bread & Pav |
| P-041 | Kolhapuri Misal Masala 100 g | Snacks | Instant Mixes & Masala |
| P-042 | Bhakarwadi 250 g | Snacks | Namkeen |
| P-051 | Kokum Sharbat 750 ml | Beverages | Syrups & Sharbat |
| P-061 | Herbal Bath Soap 4 x 100 g | Personal Care | Bath & Body |
| P-071 | Cotton Bedsheet (Double) | Household | Home Linen |
| P-072 | Dishwash Liquid 500 ml | Household | Cleaning |
Categories: Fruits & Vegetables, Dairy & Breakfast, Snacks, Beverages, Personal Care, Household. Prices and costs in the sample files are made up for practice.
Dark stores in the sample data (all in Maharashtra, India)
| City | Blinkit dark stores (Store ID – Area) | Amazon Now dark stores (Store ID – Area) | City Manager |
|---|---|---|---|
| Pune | BLK-PUN-01 Kothrud · BLK-PUN-02 Baner · BLK-PUN-03 Hadapsar | AMN-PUN-01 Hinjewadi · AMN-PUN-02 Wakad | Ravindra Bagale |
| Nashik | BLK-NSK-01 College Road | AMN-NSK-01 Gangapur Road | Shraddha Bagale |
| Nagpur | BLK-NGP-01 Dharampeth | AMN-NGP-01 Sitabuldi | Shahrukh |
| Kolhapur | BLK-KOP-01 Rajarampuri | AMN-KOP-01 Tarabai Park | Zoya |
| Mumbai | BLK-MUM-01 Andheri East | AMN-MUM-01 Powai | Amir |
| Sambhaji Nagar | BLK-SBN-01 CIDCO | AMN-SBN-01 Nirala Bazar | Raja |
In the data, Chhatrapati Sambhaji Nagar is stored with the short name Sambhaji Nagar.
Sample people used in this guide. City managers: Ravindra Bagale (Pune), Shraddha Bagale (Nashik), Shahrukh (Nagpur), Zoya (Kolhapur), Amir (Mumbai) and Raja (Sambhaji Nagar). Ravina is a regional lead for Pune and Mumbai, and Rani is the state operations head. Customers include Ruhi Bagale, Ravina, Rani and Salman. Delivery partners include Salman, Amir and Raja. All e-mail addresses use the fictional domain example.com.
CustomerCustomer ID (key) Customer Name Area, City |
ProductProduct ID (key) Product Name Category, Brand |
DeliveryPartnerDelivery Partner ID (key) Partner Name Vehicle Type |
DarkStoreStore ID (key) Store Name, Platform Area, City, State Manager Email |
Orders (fact)Order ID Order Date, Delivered Date Customer ID, Store ID Product ID, Delivery Partner ID Quantity, Amount, Discount Delivery Fee, Delivery Time Mins Order Status, Payment Mode, Platform |
DateDate (key) Year, Quarter Month, Year Month Festival |
Look at this data structure carefully once, because we will use these same tables in every module ahead.
हे data structure एकदा नीट बघा, कारण पुढे प्रत्येक module मध्ये आपण हेच tables वापरणार आहोत.
यह data structure एक बार ध्यान से देख लीजिए, क्योंकि आगे हर module में हम यही tables इस्तेमाल करेंगे.
Ravindra Bagale's Tip
Friends, remember: the mistake I see most with this dataset is ignoring the grain: Orders has one row per order line, not per order. Counting rows gives order lines, not orders. Use DISTINCTCOUNT(Orders[Order ID]) for order counts, and always ask "what does one row mean?" before you write a measure. This matters for both exams and interviews.
Ravindra Bagale's Tip – मराठी
मित्रांनो, लक्षात ठेवा: या dataset मध्ये मला सगळ्यात जास्त दिसणारी चूक म्हणजे grain कडे दुर्लक्ष: Orders मध्ये एक row म्हणजे एक order line, एक order नाही. Rows मोजल्या तर order lines मिळतात, orders नाहीत. Order count साठी DISTINCTCOUNT(Orders[Order ID]) वापरा, आणि measure लिहिण्याआधी नेहमी विचारा "एक row म्हणजे काय?". हे exam आणि interview दोन्हीसाठी important आहे.
Ravindra Bagale's Tip – हिंदी
दोस्तों, याद रखो: इस dataset में सबसे ज़्यादा दिखने वाली गलती है grain को नज़रअंदाज़ करना: Orders में एक row यानी एक order line, एक order नहीं. Rows गिनने से order lines मिलती हैं, orders नहीं. Order count के लिए DISTINCTCOUNT(Orders[Order ID]) इस्तेमाल करो, और measure लिखने से पहले हमेशा पूछो "एक row का मतलब क्या है?". यह exam और interview दोनों के लिए ज़रूरी है.
Fix common mistakes
| Wrong result | Reason | Correction |
|---|---|---|
| 6 orders reported | Counted order lines | DISTINCTCOUNT(Order ID) |
| Delivery fees ₹125 | Summed a repeated order-level value | One value per order, then sum |
| Average delivery 10.17 min | Average over lines weights BLK-901 three times | AVERAGEX over distinct orders |
Practise independently
Practice task
Add order BLK-904 with 2 lines (₹60 and ₹40), delivery fee ₹25 and 8 minutes. What are Orders, Total Sales, Delivery Fees (right) and AOV now?
Hints
- 4 orders; add 100 to sales and 25 to fees.
Solution
Orders 4; Total Sales ₹560; Delivery Fees ₹75; AOV ₹560 ÷ 4 = ₹140.
Think like a professional
State the grain of every fact table in one sentence before writing any measure. It prevents most wrong-total bugs.
Thodkyaat sangaycha tar (quick recap)
BI means taking decisions from data, and Power BI gives you parts for it: Desktop, Service and Mobile. Remember that our Blinkit data is at order-line level – this will matter every time you write a measure. Next, let us install Power BI and get to know the interface.
BI म्हणजे data वरून निर्णय घेणं, आणि त्यासाठी Power BI आपल्याला Desktop, Service आणि Mobile असे भाग देतो. आपला Blinkit data order-line level चा आहे, हे लक्षात ठेवा – पुढे प्रत्येक measure लिहिताना हे कामाला येईल. आता पुढे जाऊया, Power BI install करून interface ओळखूया.
BI का मतलब है data से फ़ैसले लेना, और इसके लिए Power BI हमें Desktop, Service और Mobile जैसे हिस्से देता है. याद रखिए, हमारा Blinkit data order-line level का है – आगे हर measure लिखते समय यह काम आएगा. अब आगे बढ़ते हैं, Power BI install करके interface पहचानते हैं.
 Revision card