1. Introduction to Business Intelligence and Power BI
1.1 What is Business Intelligence?
Start with a problem
Every morning Rani, regional head for Maharashtra, receives a raw list of orders and asks: Which city sold the most yesterday? Reading 8 rows is easy; reading 80,000 is not.
Explain simply
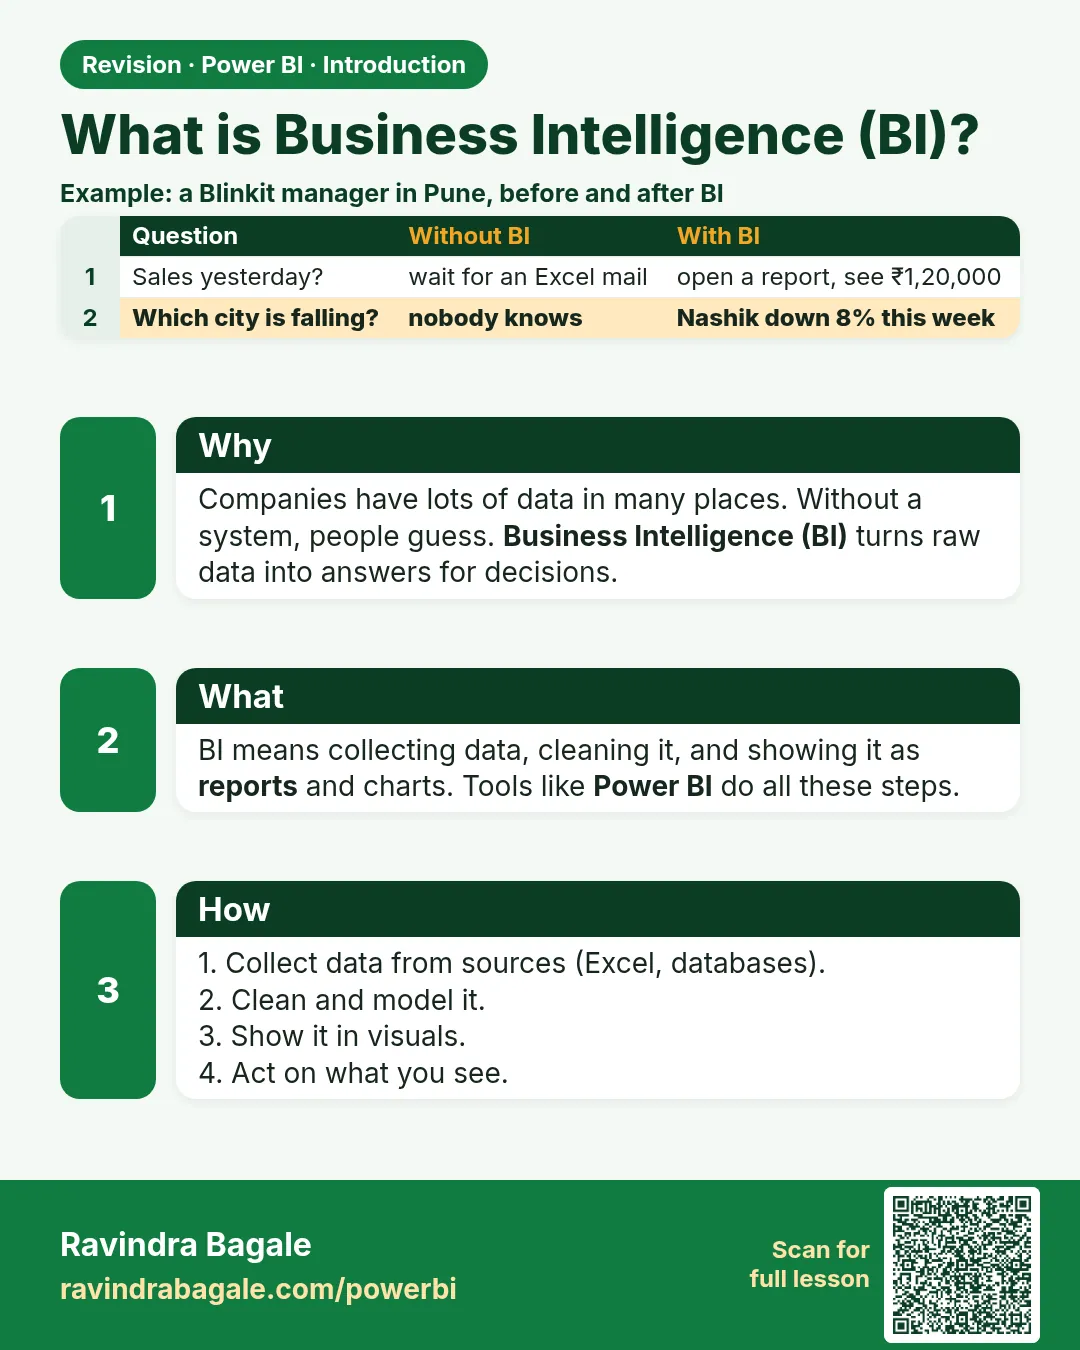
Business Intelligence (BI) turns raw data into answers people can act on: collect data, clean it, summarise it, show it, and decide.
Show the data
| Order ID | Order Date | City | Store | Platform | Category | Amount (₹) | Delivery mins | Status |
|---|---|---|---|---|---|---|---|---|
| 301 | 06-Apr-2026 | Pune | Kothrud | Blinkit | Dairy | 400 | 8 | Delivered |
| 302 | 06-Apr-2026 | Pune | Baner | Amazon Now | Snacks | 200 | 12 | Delivered |
| 303 | 07-Apr-2026 | Nashik | Gangapur | Blinkit | Dairy | 300 | 14 | Delivered |
| 304 | 04-May-2026 | Nashik | College Road | Blinkit | Fruits | 150 | 9 | Delivered |
| 305 | 04-May-2026 | Kolhapur | Rajarampuri | Amazon Now | Snacks | 450 | 7 | Delivered |
| 306 | 05-May-2026 | Pune | Kothrud | Blinkit | Fruits | 250 | 16 | Delivered |
| 307 | 05-May-2026 | Nashik | College Road | Amazon Now | Dairy | 350 | 11 | Delivered |
| 308 | 05-May-2026 | Kolhapur | Rajarampuri | Blinkit | Dairy | 0 | Cancelled |
About this data: This table uses columns: Order ID, Order Date, City, Store, Platform, Category, Amount (₹), Delivery mins, Status. This table uses columns: City, Total Sales (₹). This table uses columns: Layer, What happens, Example in Power BI. Values shown are the lesson examples already on this page (not a new dataset).
Fictional sample data. Practice file: visuals_orders_apr_may_2026.csv (source: src/practice/).
Demonstrate
- Look at the 8 raw rows above.
- Add up Amount for each City by hand.
- Write the three totals in a small table.
- Circle the highest city.
- Write one decision sentence (for example: check Kolhapur cancellations).
Show the result
Your result should look like this (fictional sample):
| City | Total Sales (₹) |
|---|---|
| Pune | 850 |
| Nashik | 800 |
| Kolhapur | 450 |
| Total | 2,100 |
Explain what happened
You moved from eight raw order rows, to a summary of revenue by city, to the insight that one city leads, to an action for the sales team. Power BI repeats those same steps automatically every day.
Explore further
- Next modules show how Power BI automates each step.
Detailed reference for this lesson:
Business Intelligence (BI) means collecting data, cleaning it, and showing it so people can take better business decisions. In short, BI turns raw data into useful information.
Think of a quick-commerce app that delivers groceries in minutes from dark stores in Pune, Nashik and Nagpur. It records a huge number of orders every day. Rows in a spreadsheet tell you almost nothing. A BI report quickly answers questions like these:
- Which city and which dark store (for example Kothrud in Pune or Dharampeth in Nagpur) got the most orders this week?
- What share of orders was delivered within 10 minutes?
- Which product categories are growing and which are falling compared to last year – and how big was the Diwali or Ganeshotsav spike?
- What is the cancellation rate, and at which hours of the day does it go up?
- Are discounts really increasing orders, or only reducing margin?
Business Intelligence (BI) म्हणजे data गोळा करायचा, तो साफ करायचा आणि असा दाखवायचा की लोकांना business चे निर्णय चांगले घेता येतील. थोडक्यात, BI raw data चं रूपांतर उपयोगी माहितीत करतो.
आता असं बघा: एक quick-commerce app आहे, जे Pune, Nashik आणि Nagpur मधल्या dark stores मधून काही मिनिटांत किराणा पोचवतं. रोज भरपूर orders येतात. Spreadsheet मधल्या rows बघून काहीच कळत नाही. पण BI report अशा प्रश्नांची उत्तरं पटकन देतो:
- या आठवड्यात कोणत्या शहरात आणि कोणत्या dark store ला (उदा. Pune चं Kothrud किंवा Nagpur चं Dharampeth) सगळ्यात जास्त orders आल्या?
- किती टक्के orders 10 मिनिटांच्या आत पोचल्या?
- गेल्या वर्षीच्या तुलनेत कोणत्या product categories वाढतायत आणि कोणत्या घटतायत – आणि Diwali किंवा Ganeshotsav ला किती उसळी आली?
- Cancellation rate किती आहे, आणि दिवसाच्या कोणत्या तासांना तो वाढतो?
- Discount मुळे खरंच orders वाढतायत, की फक्त margin कमी होतंय?
Business Intelligence (BI) का मतलब है data इकट्ठा करना, उसे साफ़ करना और ऐसे दिखाना कि लोग business के फ़ैसले बेहतर ले सकें. सीधी बात, BI raw data को काम की जानकारी में बदलता है.
सोचिए: एक quick-commerce app है जो Pune, Nashik और Nagpur के dark stores से कुछ ही मिनटों में किराना पहुँचाता है. हर दिन बहुत सारे orders आते हैं. Spreadsheet की rows देखकर कुछ समझ नहीं आता. लेकिन BI report ऐसे सवालों का जवाब तुरंत देती है:
- इस हफ़्ते किस शहर और किस dark store (जैसे Pune का Kothrud या Nagpur का Dharampeth) को सबसे ज़्यादा orders मिले?
- कितने प्रतिशत orders 10 मिनट के अंदर पहुँचे?
- पिछले साल की तुलना में कौन-सी product categories बढ़ रही हैं और कौन-सी घट रही हैं – और Diwali या Ganeshotsav पर कितना उछाल आया?
- Cancellation rate कितना है, और दिन के किन घंटों में वह बढ़ता है?
- Discount से सच में orders बढ़ रहे हैं, या सिर्फ़ margin घट रहा है?
A BI solution normally has four layers:
| Layer | What happens | Example in Power BI |
|---|---|---|
| Data sources | Where data lives | Excel files, CSV, SQL Server, SharePoint, web APIs |
| Data preparation (ETL) | Extract, Transform, Load: clean and shape data | Power Query Editor |
| Data model | Tables, relationships and calculations | Model view, DAX measures |
| Presentation | Reports, dashboards, sharing | Report view, Power BI Service, Mobile app |
BI vs. traditional Excel reporting
Excel is excellent for small, one-time analysis. BI tools like Power BI are built for repeatable reporting: you build the cleaning steps and the model once, and every refresh brings in new data automatically. They also handle millions of rows, relationships (संबंध) between many tables, and secure sharing across an organisation.
Ravindra Bagale's Tip
Friends, many students think BI means "making charts". My advice: start every project by writing down the three or four business questions the report must answer, for example "Which Pune store misses the 10-minute promise most often?". Charts come last. If you can't name the decision a visual supports, remove it.
Ravindra Bagale's Tip – मराठी
मित्रांनो, बऱ्याच students ना वाटतं BI म्हणजे "charts बनवणं". माझं सांगणं आहे, प्रत्येक project ची सुरुवात report ने उत्तर द्यायचे तीन-चार business प्रश्न लिहून करा, उदाहरणार्थ "Which Pune store misses the 10-minute promise most often?". Charts सगळ्यात शेवटी. एखादा visual कोणत्या निर्णयाला मदत करतो ते सांगता येत नसेल, तर तो काढून टाका.
Ravindra Bagale's Tip – हिंदी
दोस्तों, बहुत से students सोचते हैं BI का मतलब "charts बनाना" है. मेरी सलाह है, हर project की शुरुआत उन तीन-चार business सवालों को लिखकर करो जिनका जवाब report को देना है, जैसे "Which Pune store misses the 10-minute promise most often?". Charts सबसे आख़िर में. अगर तुम नहीं बता सकते कि कोई visual किस फ़ैसले में मदद करता है, तो उसे हटा दो.
Fix common mistakes
| Wrong result | Reason | Correction |
|---|---|---|
| Pune total ₹650 | Counted only Kothrud | Include Baner (302, ₹200) |
| Kolhapur counted as 2 sales | Cancelled order 308 has ₹0 | Sales total is still ₹450; order count is 2 |
| Report built but no decision | BI stopped at charts | End with an action sentence |
Practise independently
Practice task
Total sales by Platform for the 8 orders?
Hints
- Blinkit: 301, 303, 304, 306, 308.
Solution
Blinkit ₹1,100; Amazon Now ₹1,000.
Think like a professional
In interviews, describe BI as data to decision, and give a small example like this one.
 Revision card