Ravindra BagaleCourses & study guides मराठी Track your progress

Ravi Sir's Cards › Power BI

11. Data Modelling: मराठी Cards

English cards · Chapter उघडा

उजळणी (Revision) cards

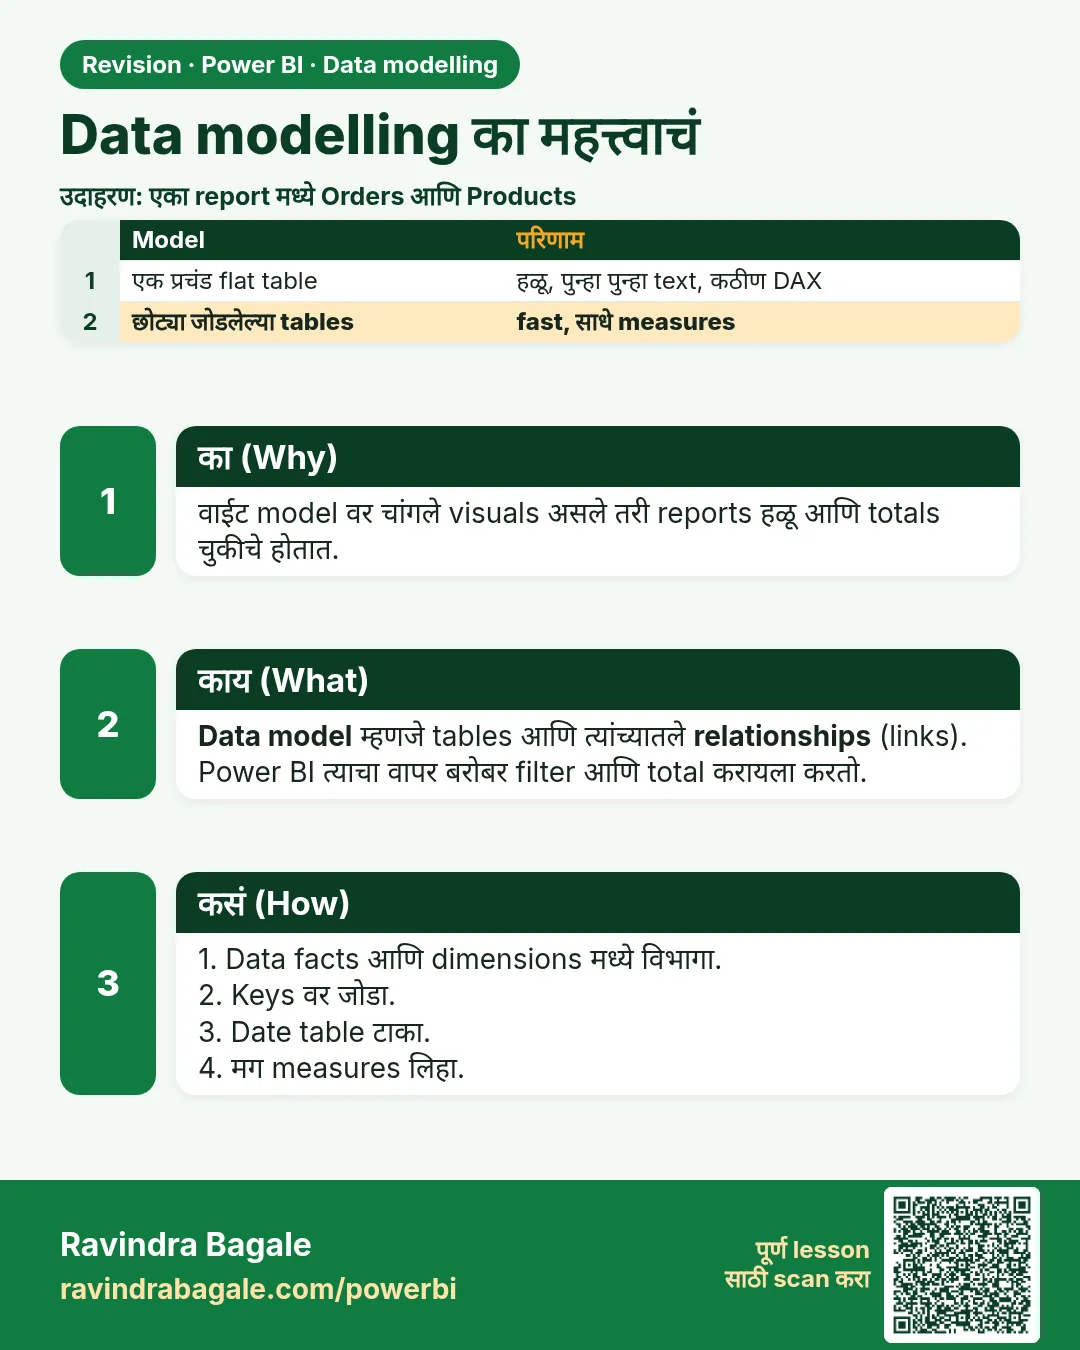
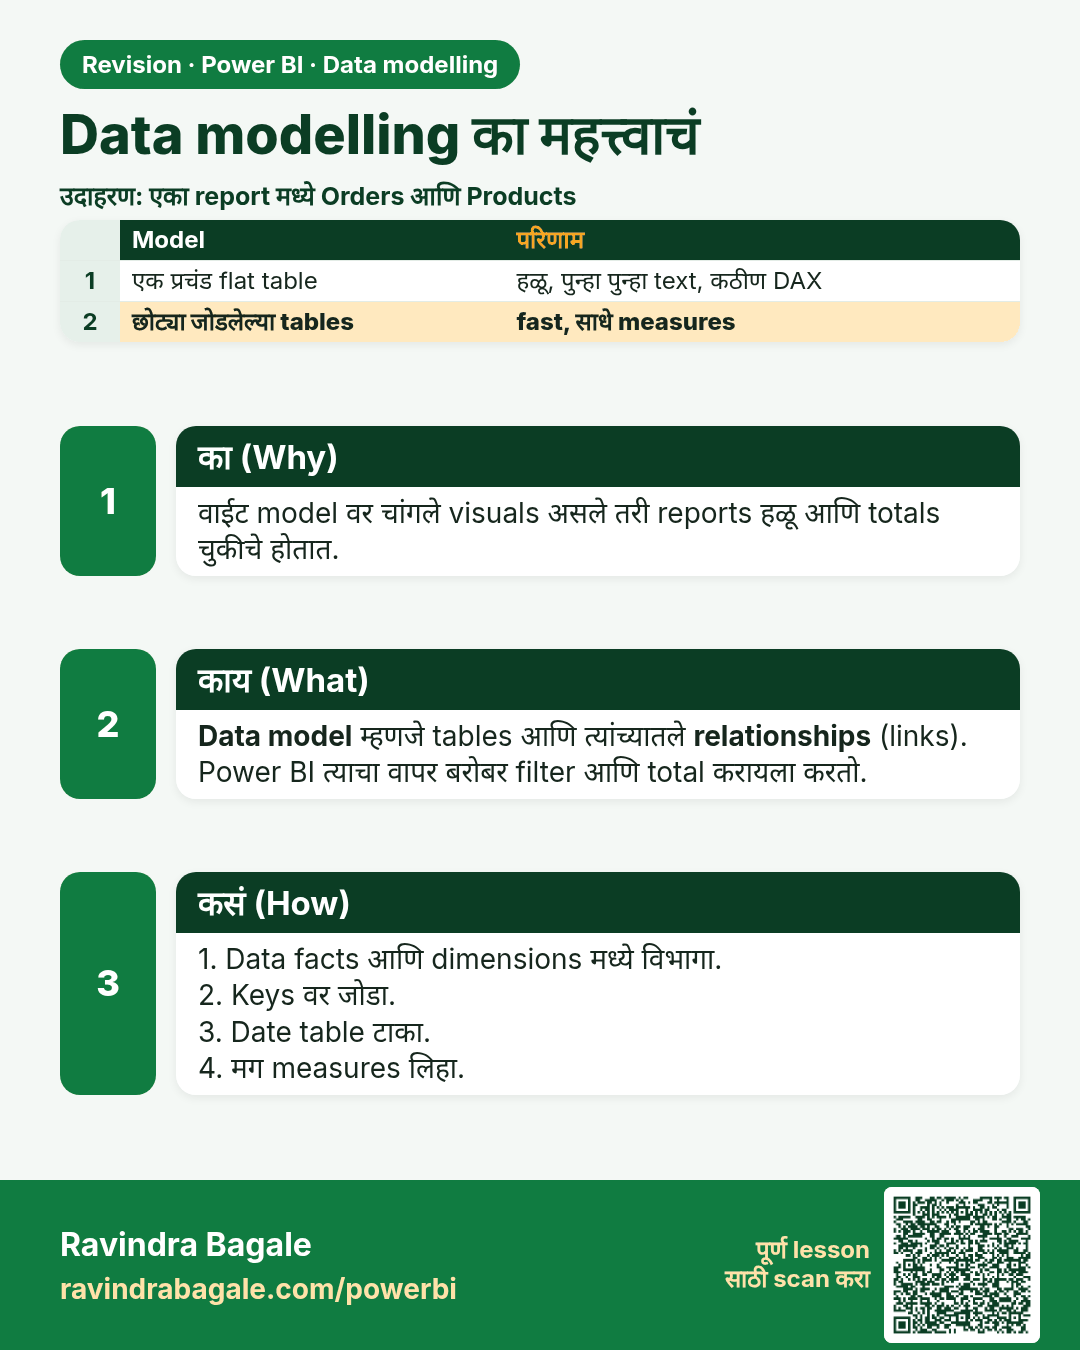
Data modelling का महत्त्वाचं. वाईट model वर चांगले visuals असले तरी reports हळू आणि totals चुकीचे होतात.
उजळणी (Revision) card 1 of 11: Data modelling का महत्त्वाचं · PNG download करा · Card page उघडा

Lesson: 11.1 Why Data Modelling Matters
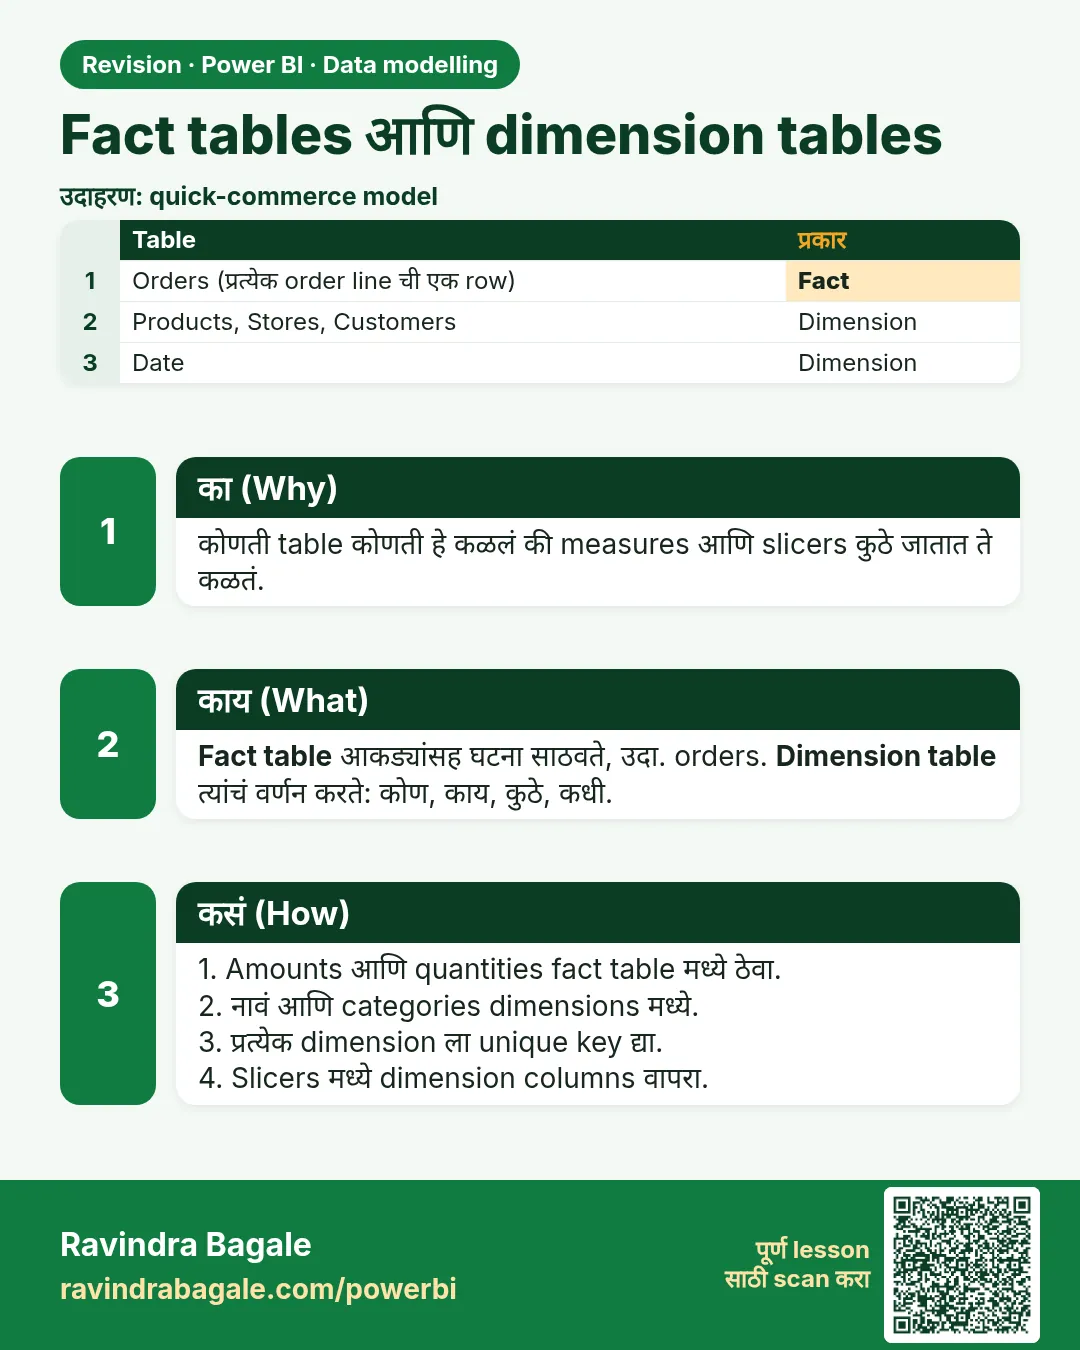
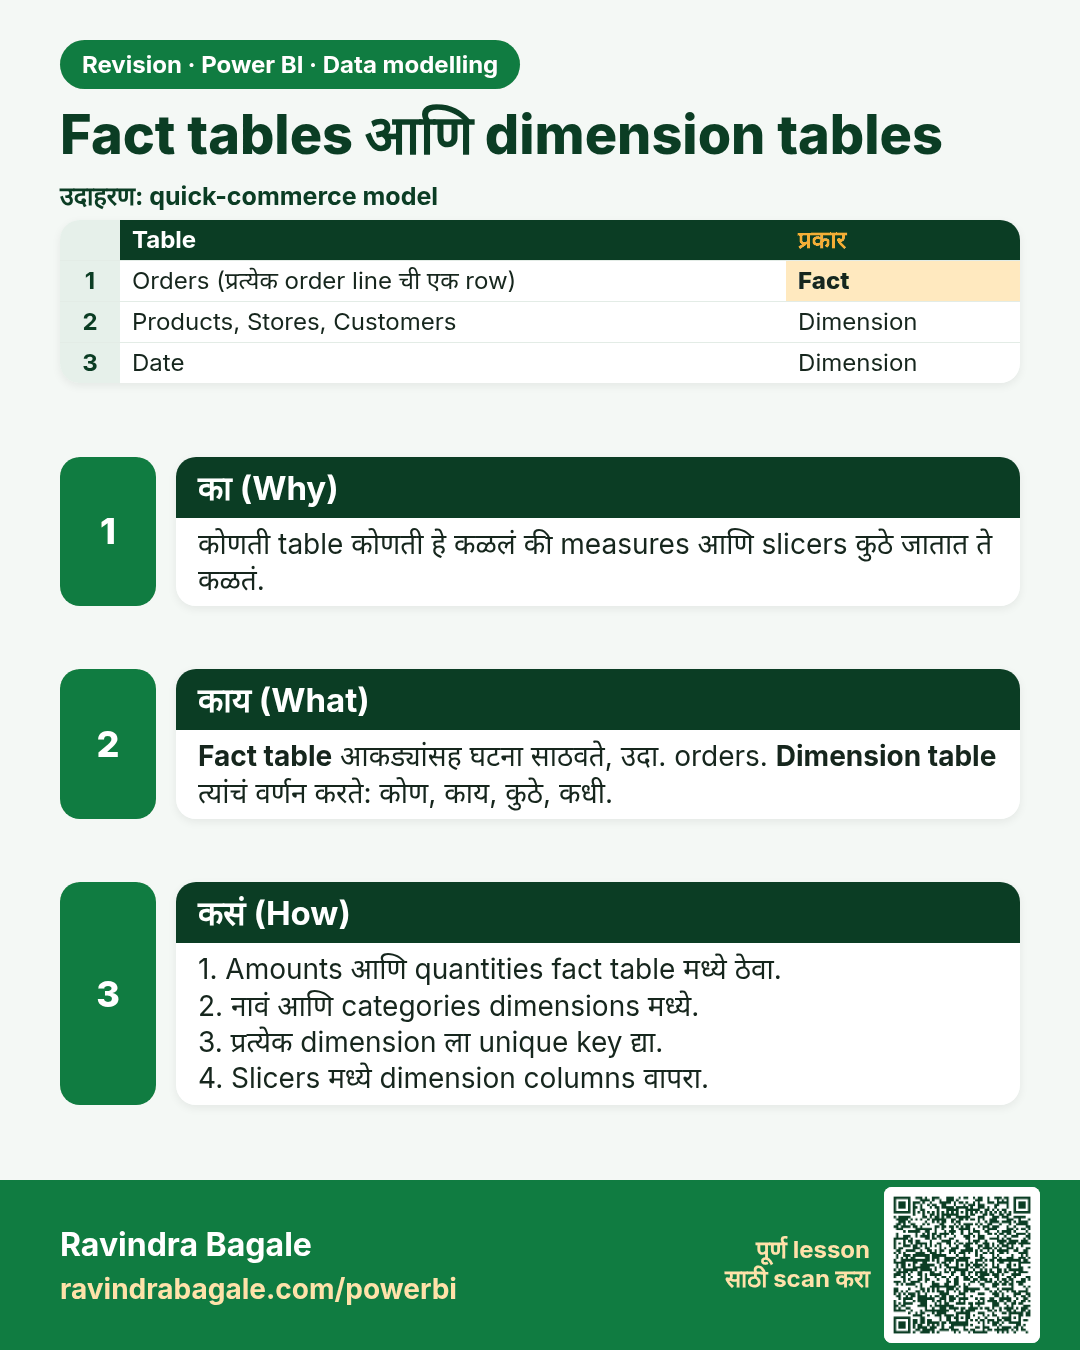
Fact tables आणि dimension tables. कोणती table कोणती हे कळलं की measures आणि slicers कुठे जातात ते कळतं.
उजळणी (Revision) card 2 of 11: Fact tables आणि dimension tables · PNG download करा · Card page उघडा

Lesson: 11.2 Fact Tables and Dimension Tables in Power BI with Example
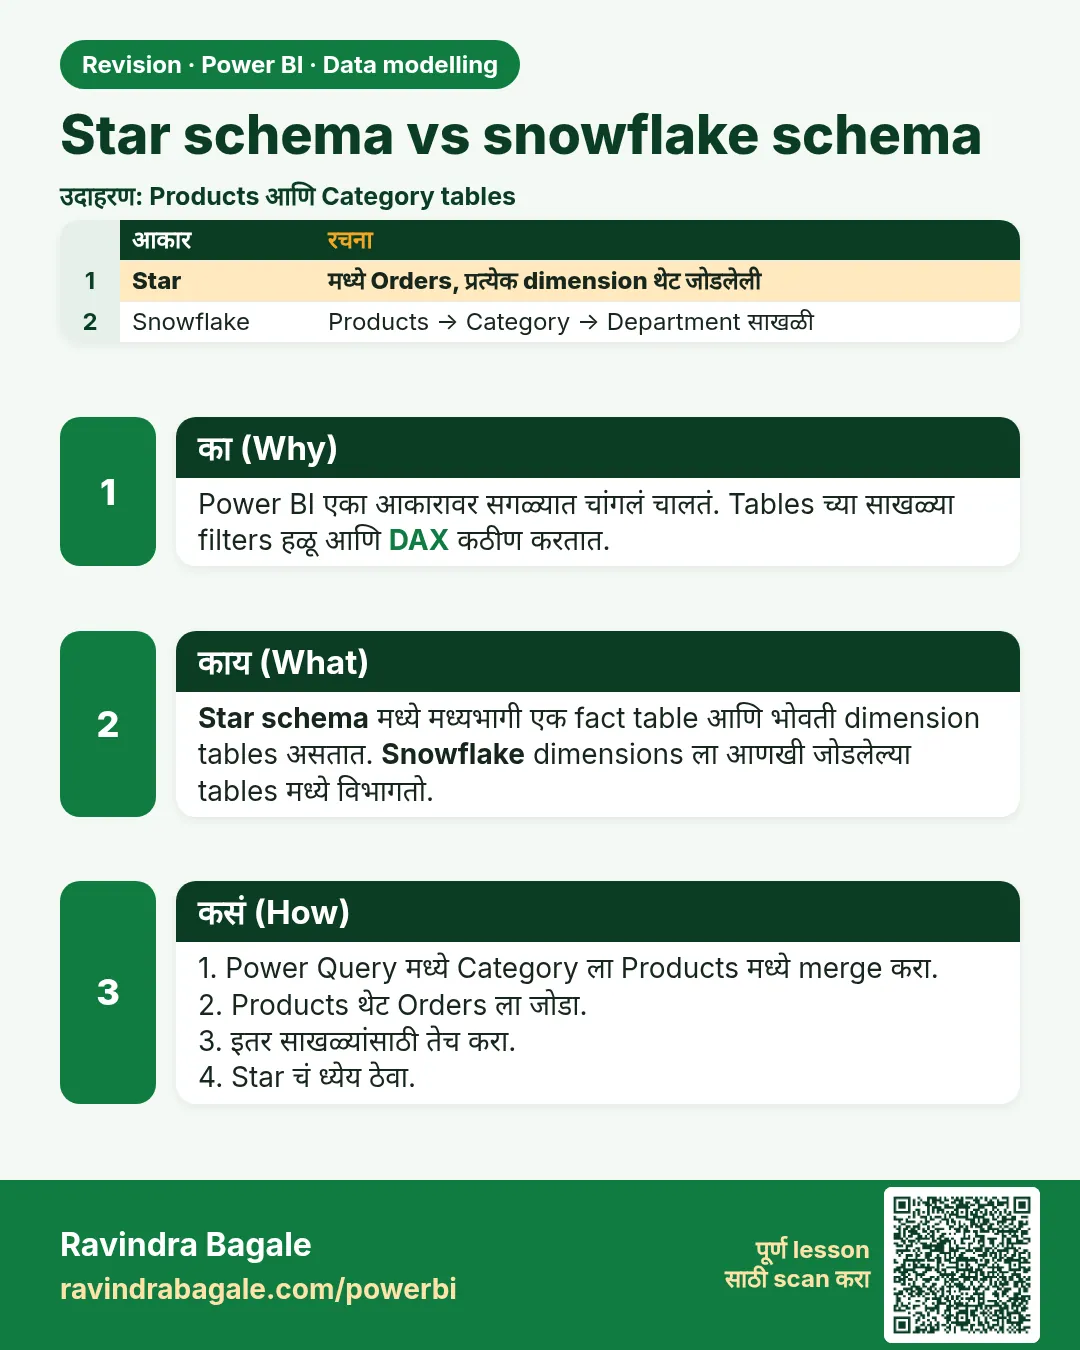
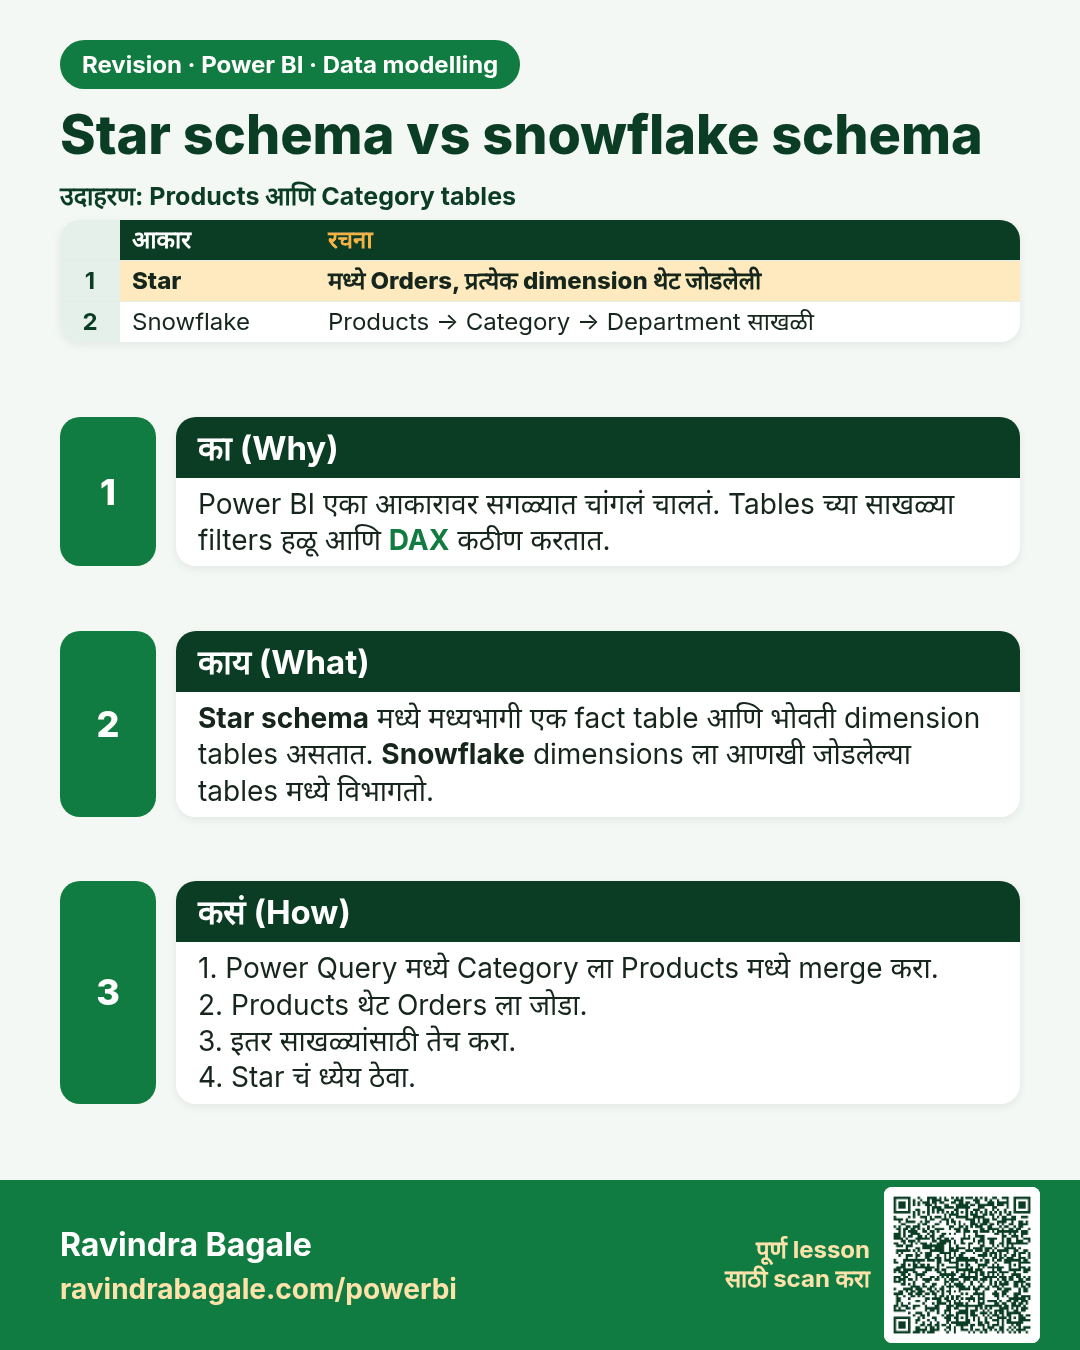
Star schema vs snowflake schema. Power BI एका आकारावर सगळ्यात चांगलं चालतं. Tables च्या साखळ्या filters हळू आणि DAX कठीण करतात.
उजळणी (Revision) card 3 of 11: Star schema vs snowflake schema · PNG download करा · Card page उघडा

Lesson: 11.3 Star Schema vs Snowflake Schema in Power BI with Example
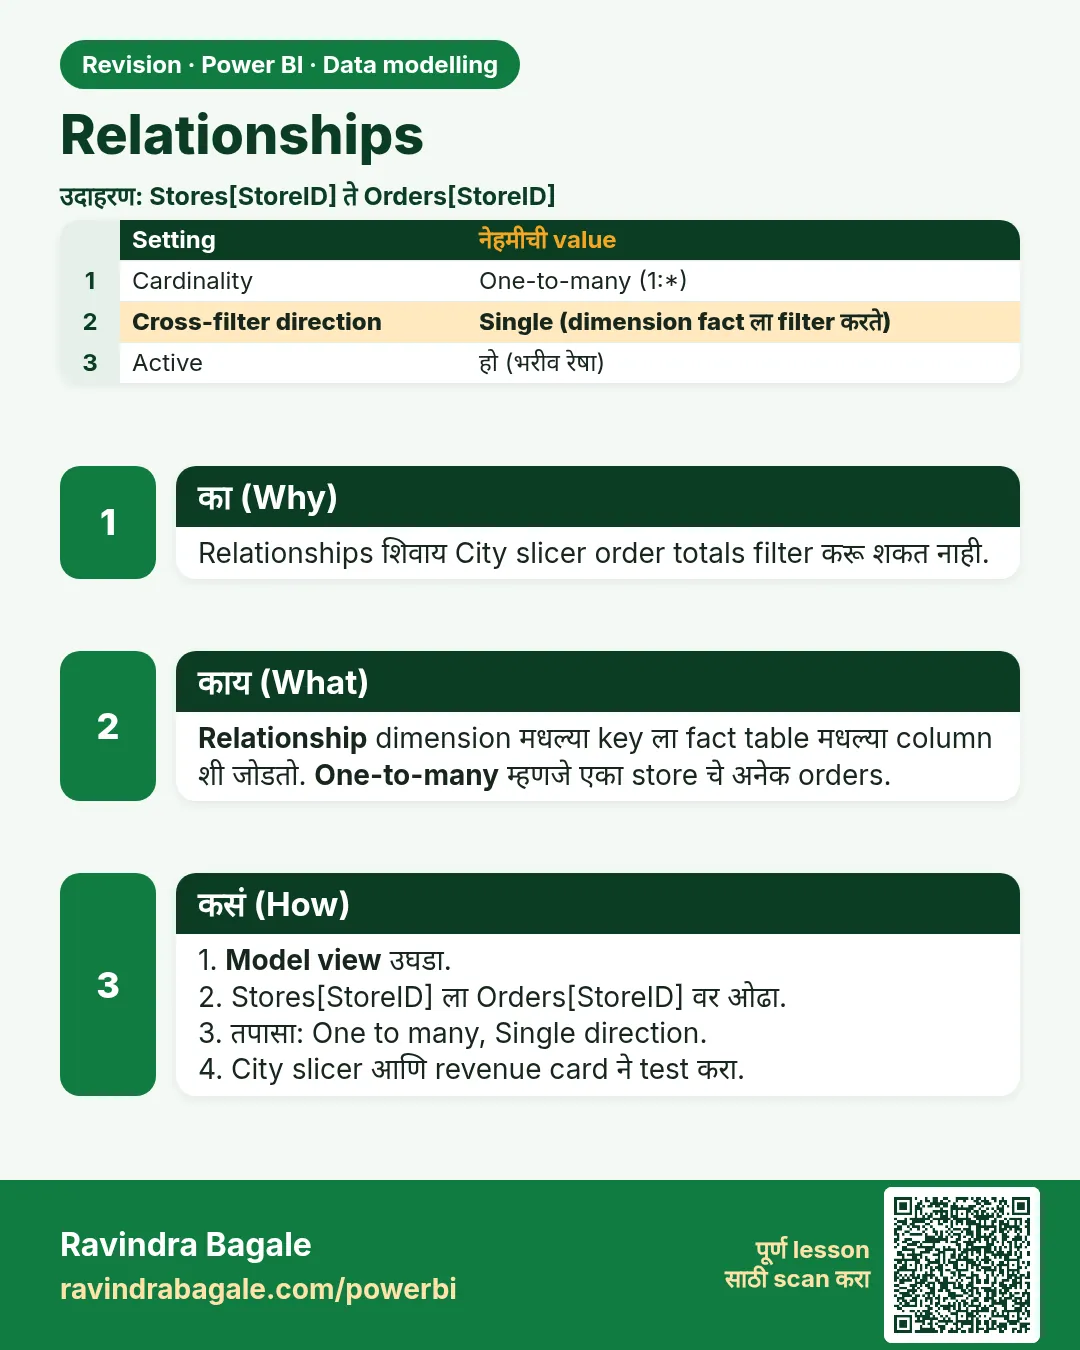
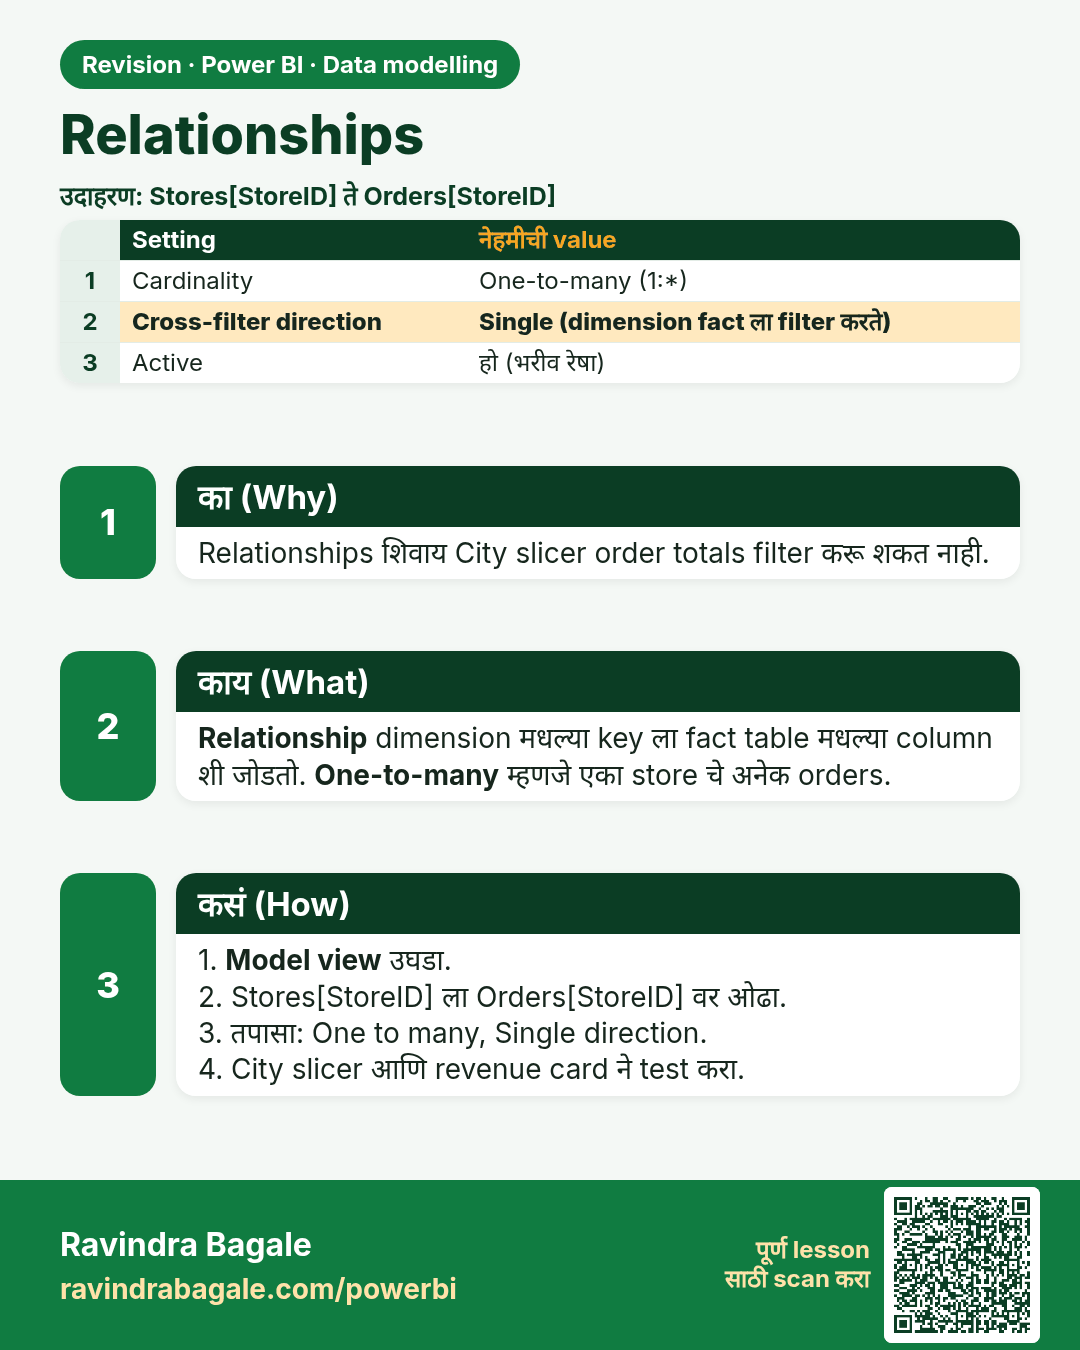
Relationships. Relationships शिवाय City slicer order totals filter करू शकत नाही.
उजळणी (Revision) card 4 of 11: Relationships · PNG download करा · Card page उघडा

Lesson: 11.4 Relationships in Power BI with Example: Cardinality and Direction

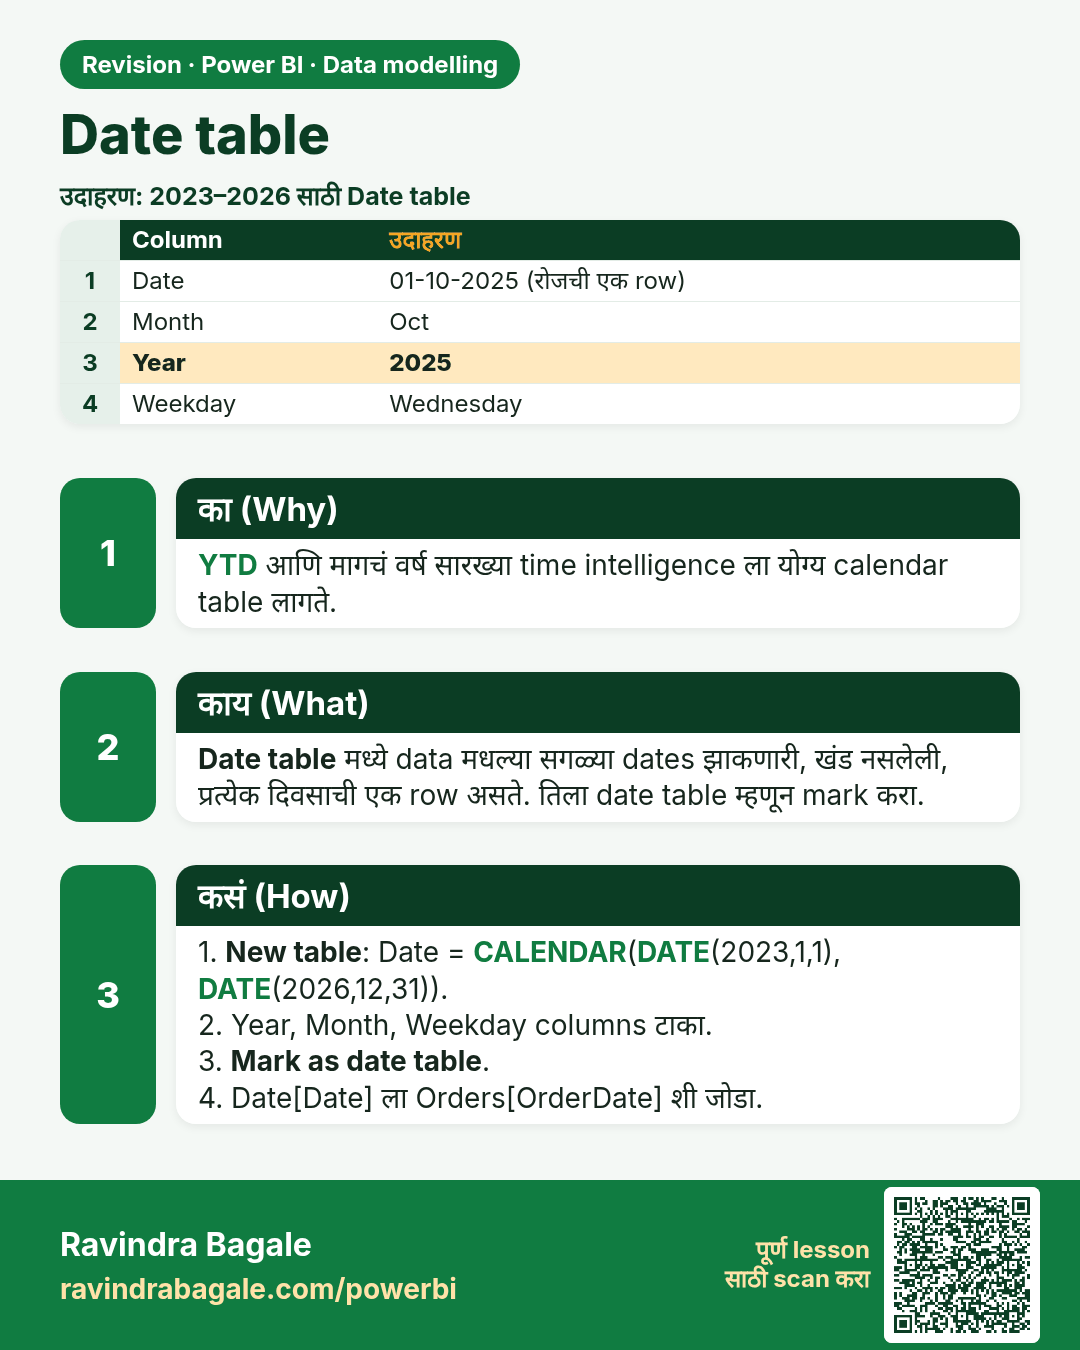
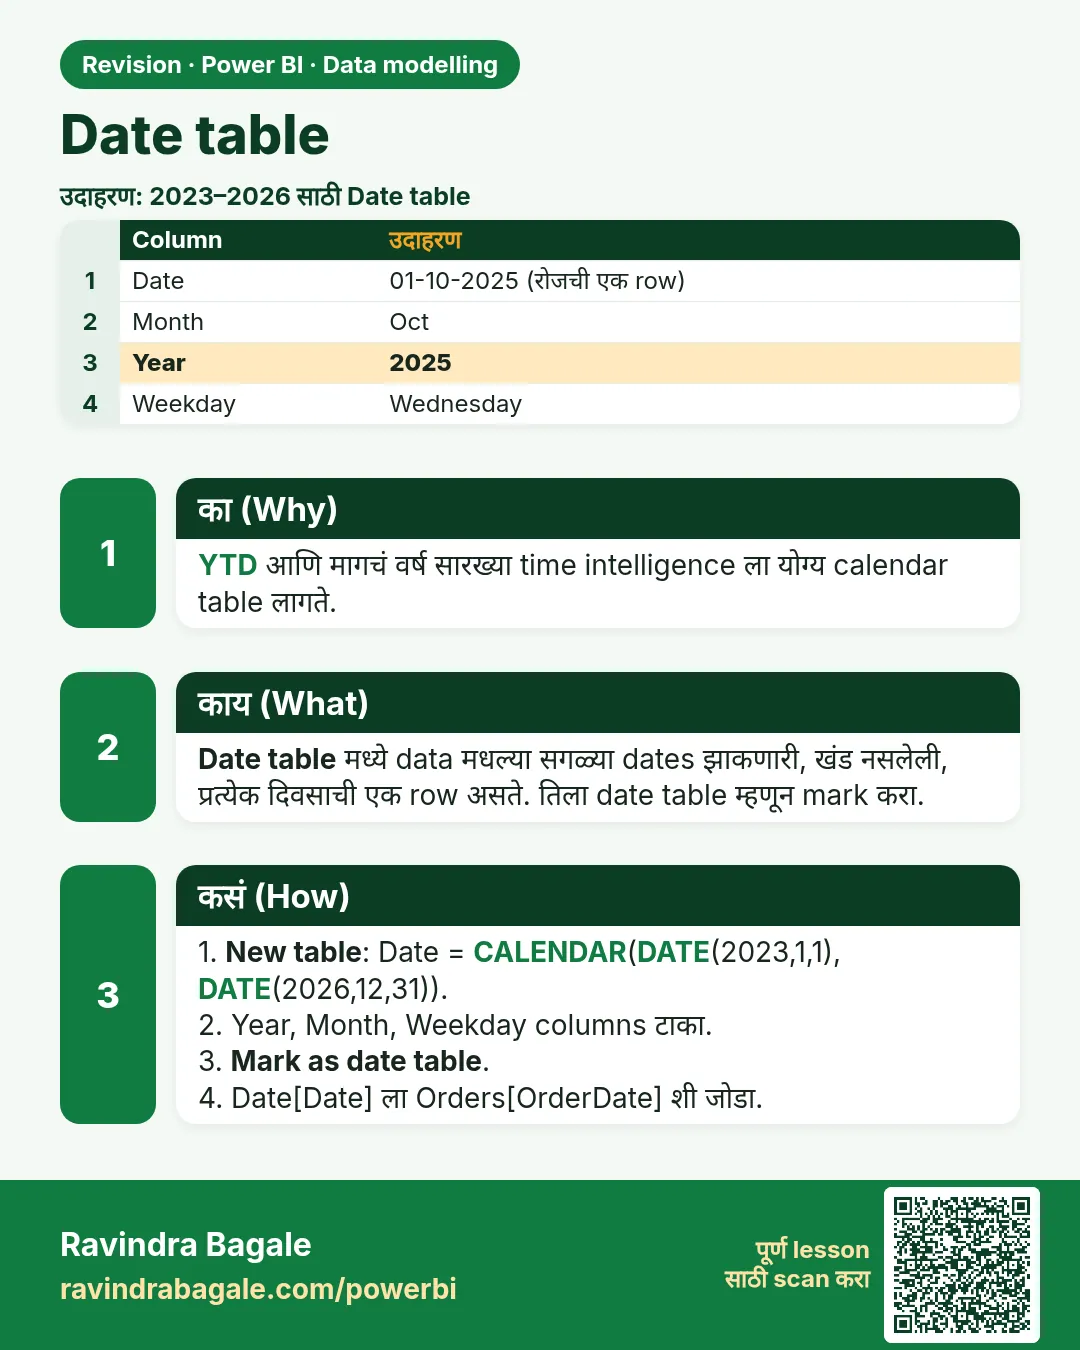
Date table. YTD आणि मागचं वर्ष सारख्या time intelligence ला योग्य calendar table लागते.
उजळणी (Revision) card 5 of 11: Date table · PNG download करा · Card page उघडा

Lesson: 11.5 Date Table in Power BI with Example (April–March FY)

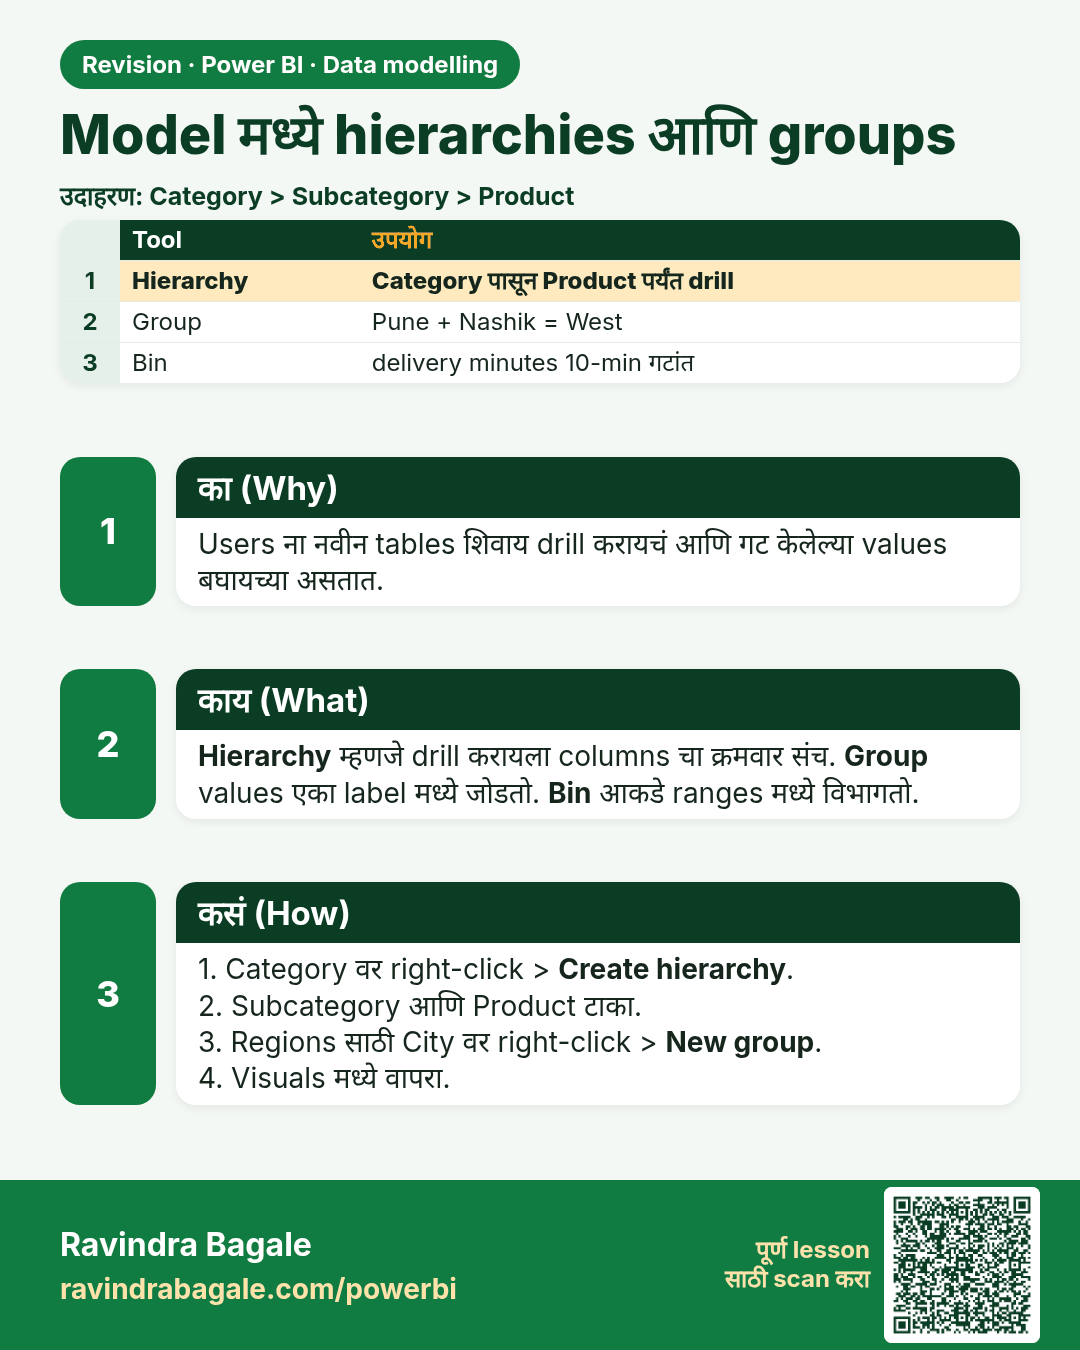
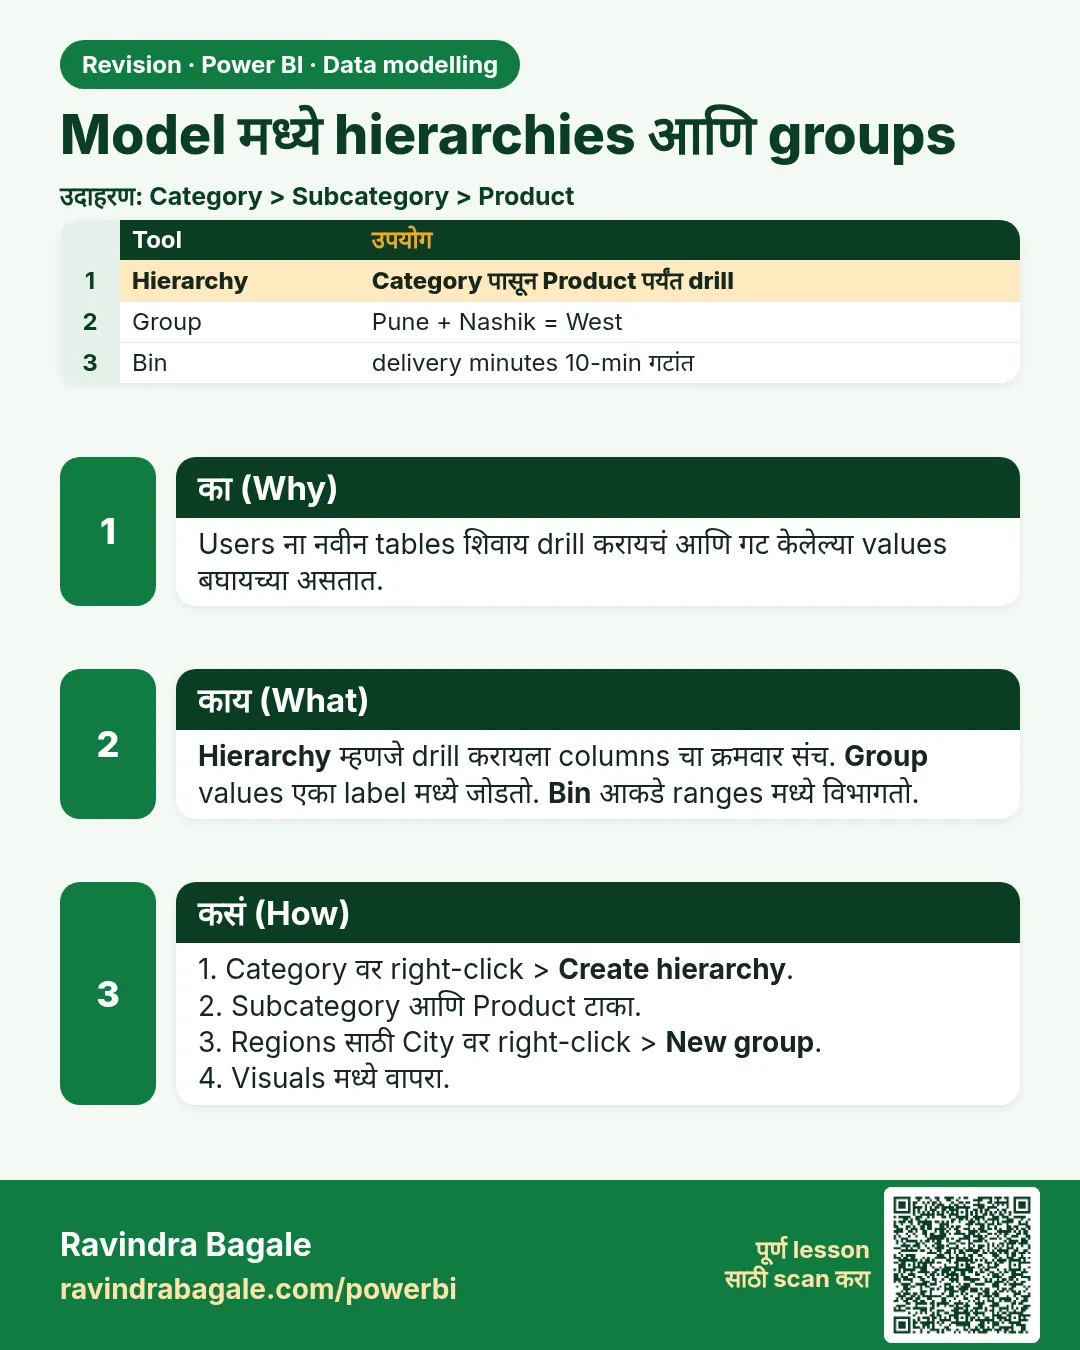
Model मध्ये hierarchies आणि groups. Users ना नवीन tables शिवाय drill करायचं आणि गट केलेल्या values बघायच्या असतात.
उजळणी (Revision) card 6 of 11: Model मध्ये hierarchies आणि groups · PNG download करा · Card page उघडा

Lesson: 11.6 Hierarchies and Groups

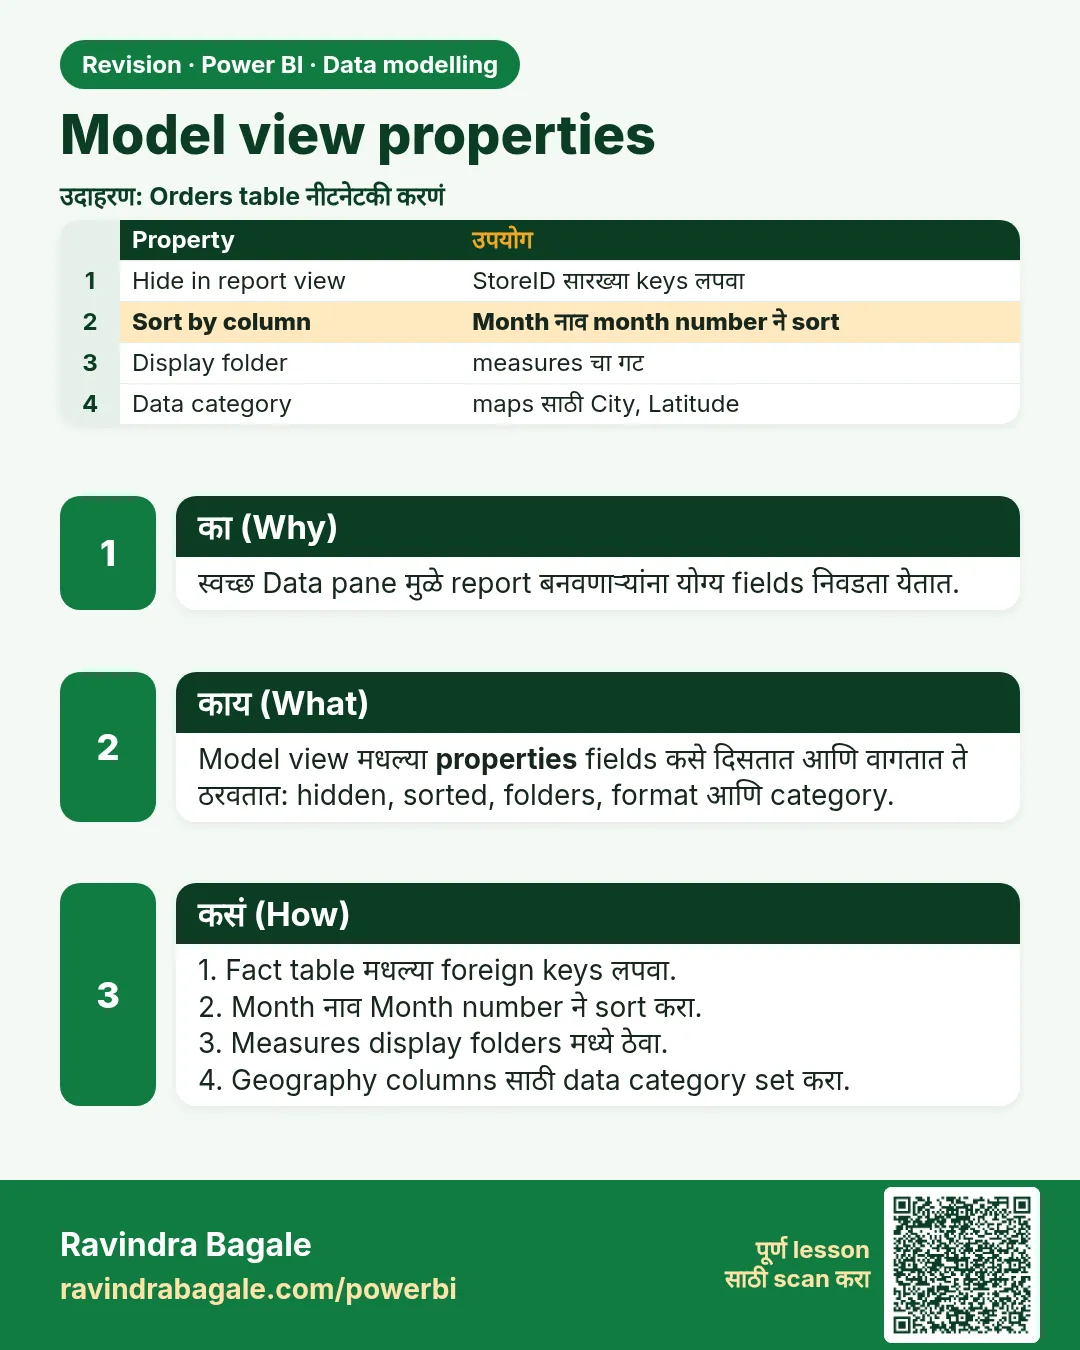
Model view properties. स्वच्छ Data pane मुळे report बनवणाऱ्यांना योग्य fields निवडता येतात.
उजळणी (Revision) card 7 of 11: Model view properties · PNG download करा · Card page उघडा

Lesson: 11.7 Model View Properties

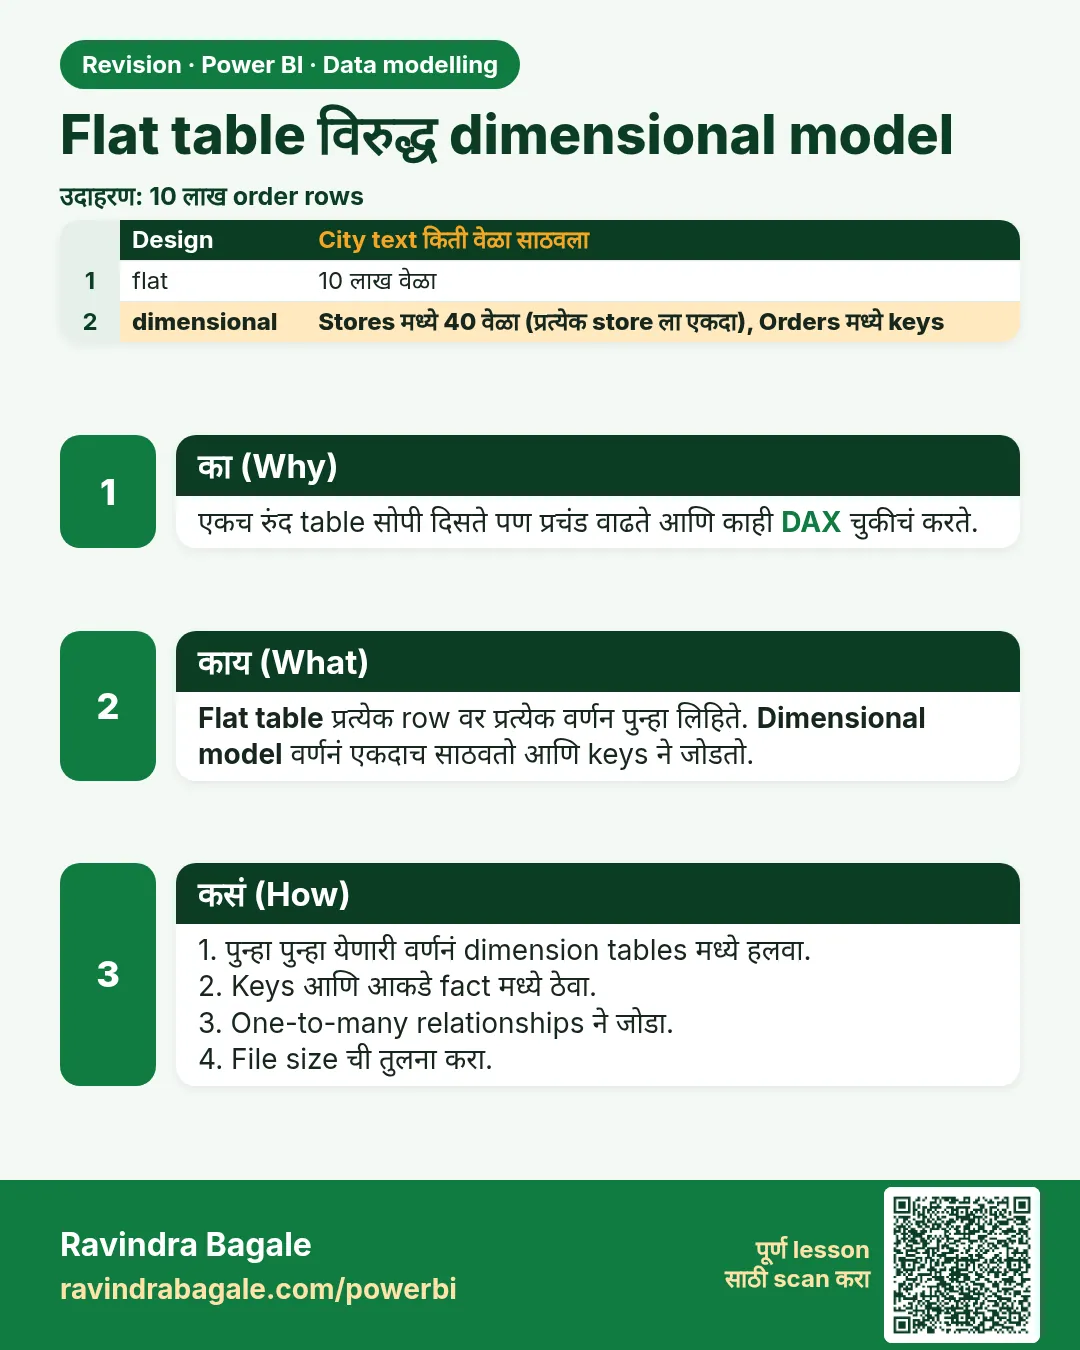
Flat table विरुद्ध dimensional model. एकच रुंद table सोपी दिसते पण प्रचंड वाढते आणि काही DAX चुकीचं करते.
उजळणी (Revision) card 8 of 11: Flat table विरुद्ध dimensional model · PNG download करा · Card page उघडा

Lesson: 11.9 A Flat Table versus a Dimensional Model

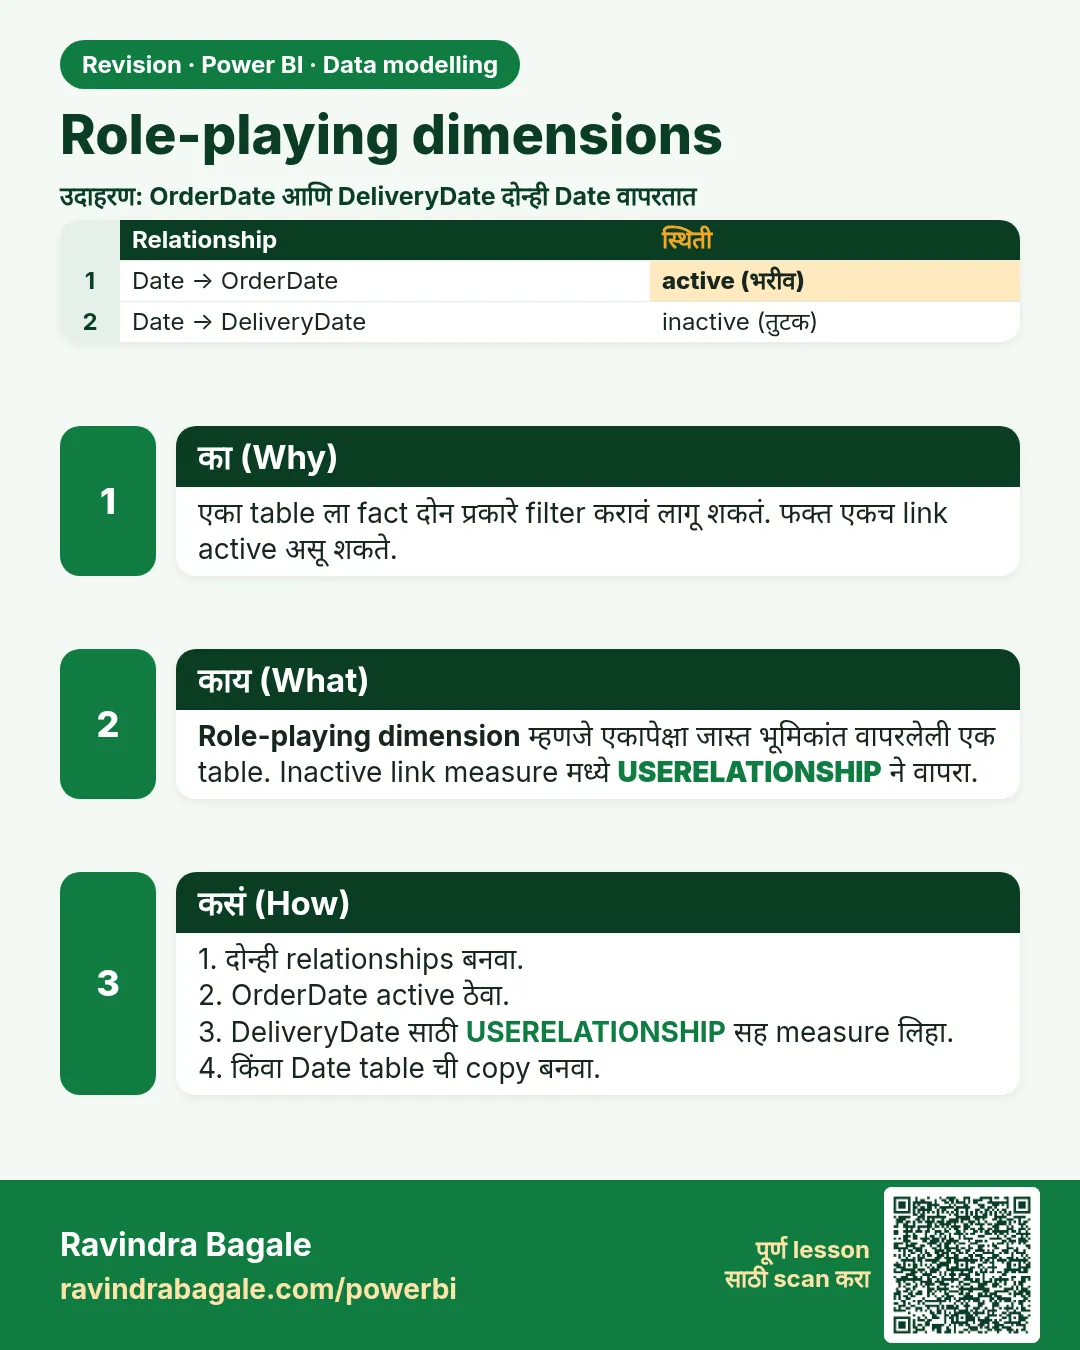
Role-playing dimensions. एका table ला fact दोन प्रकारे filter करावं लागू शकतं. फक्त एकच link active असू शकते.
उजळणी (Revision) card 9 of 11: Role-playing dimensions · PNG download करा · Card page उघडा

Lesson: 11.10 Role-Playing Dimensions

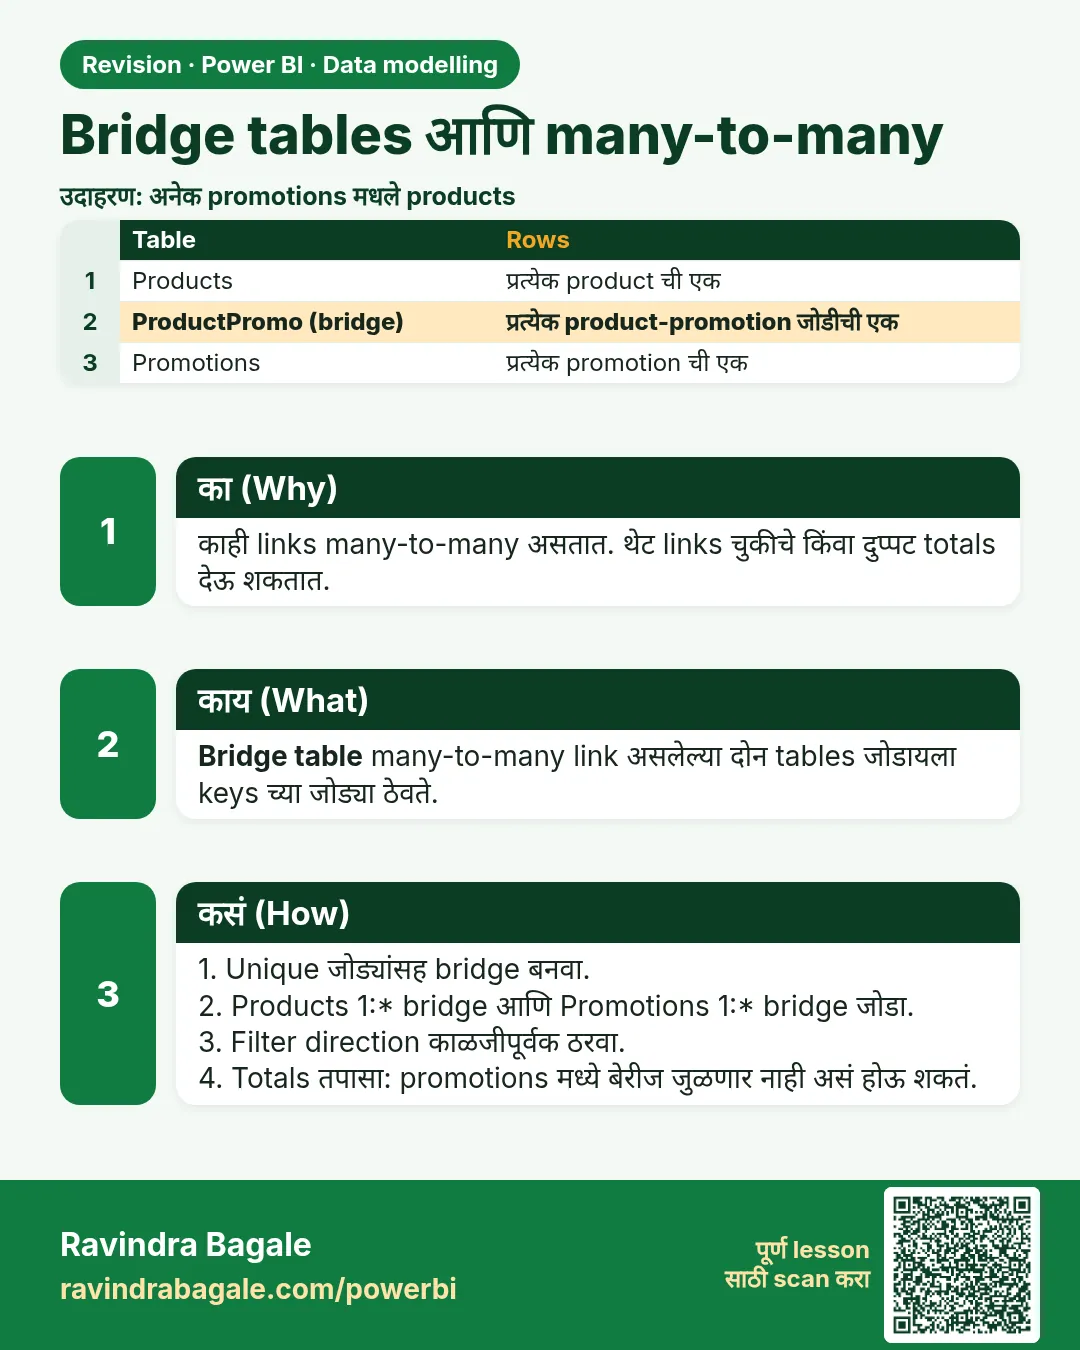
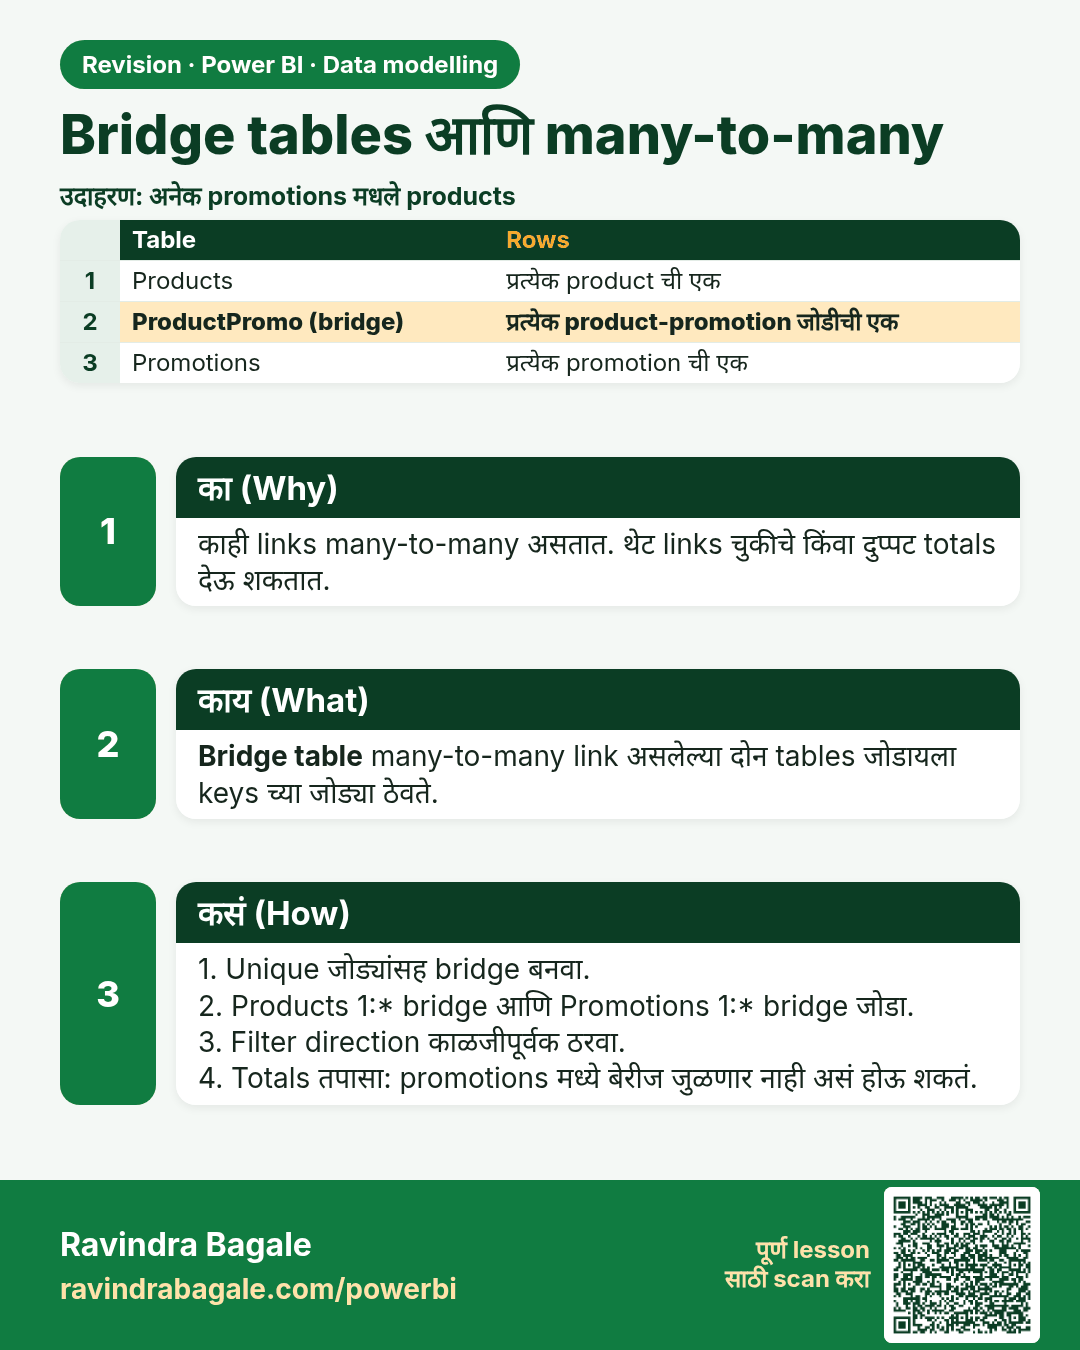
Bridge tables आणि many-to-many. काही links many-to-many असतात. थेट links चुकीचे किंवा दुप्पट totals देऊ शकतात.
उजळणी (Revision) card 10 of 11: Bridge tables आणि many-to-many · PNG download करा · Card page उघडा

Lesson: 11.11 Bridge Tables and Many-to-Many

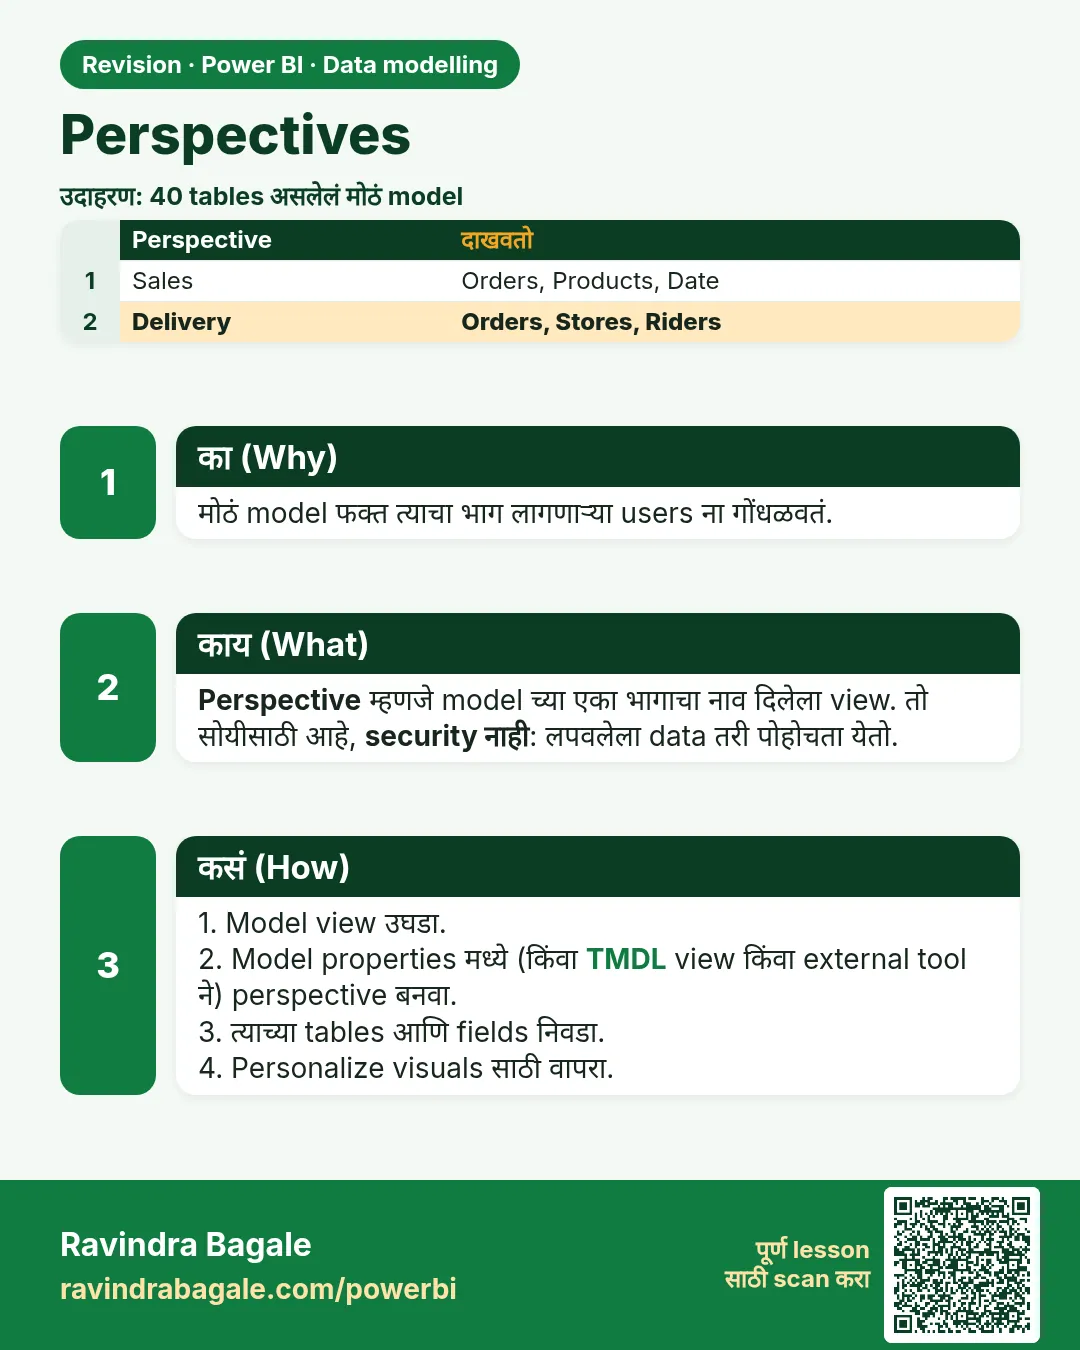
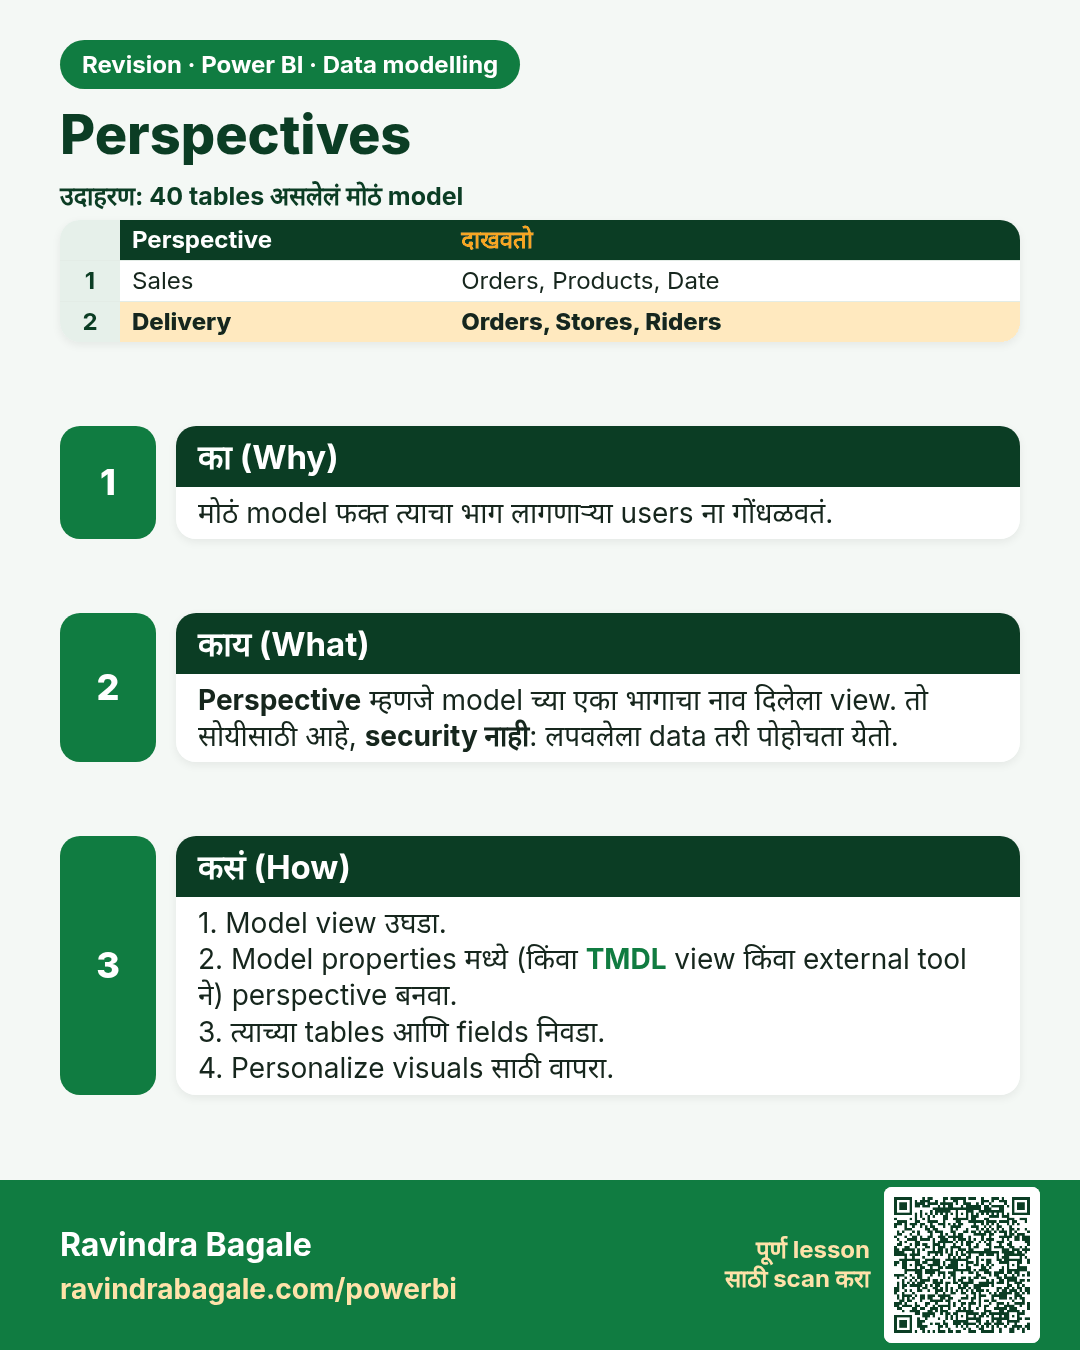
Perspectives. मोठं model फक्त त्याचा भाग लागणाऱ्या users ना गोंधळवतं.
उजळणी (Revision) card 11 of 11: Perspectives · PNG download करा · Card page उघडा

Lesson: 11.12 Perspectives

मुलाखत (Interview) cards

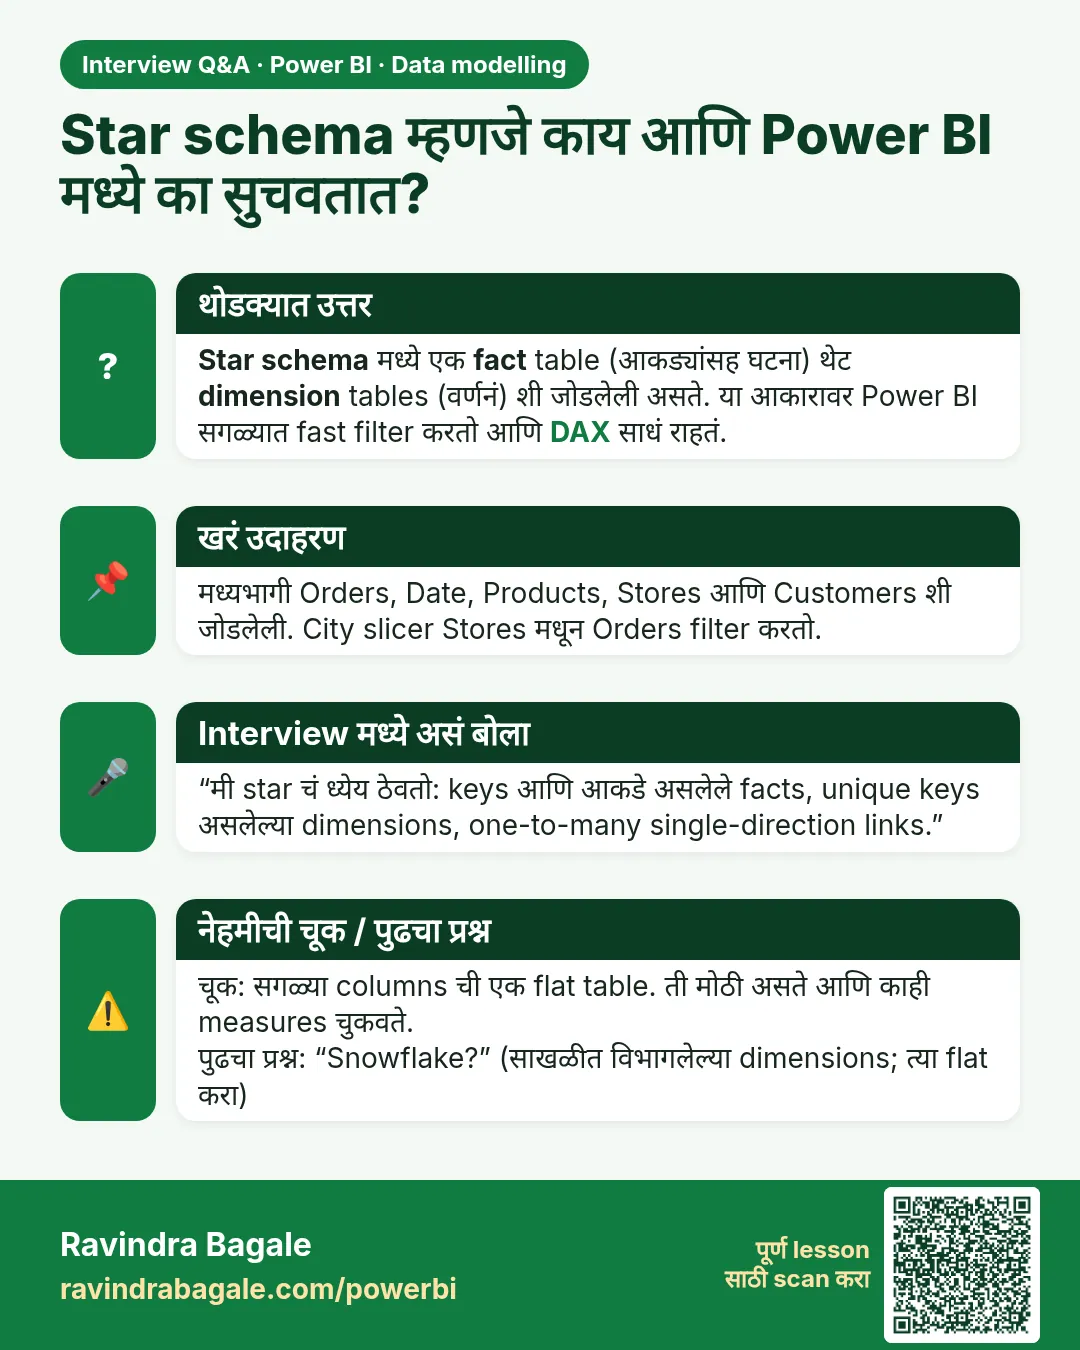
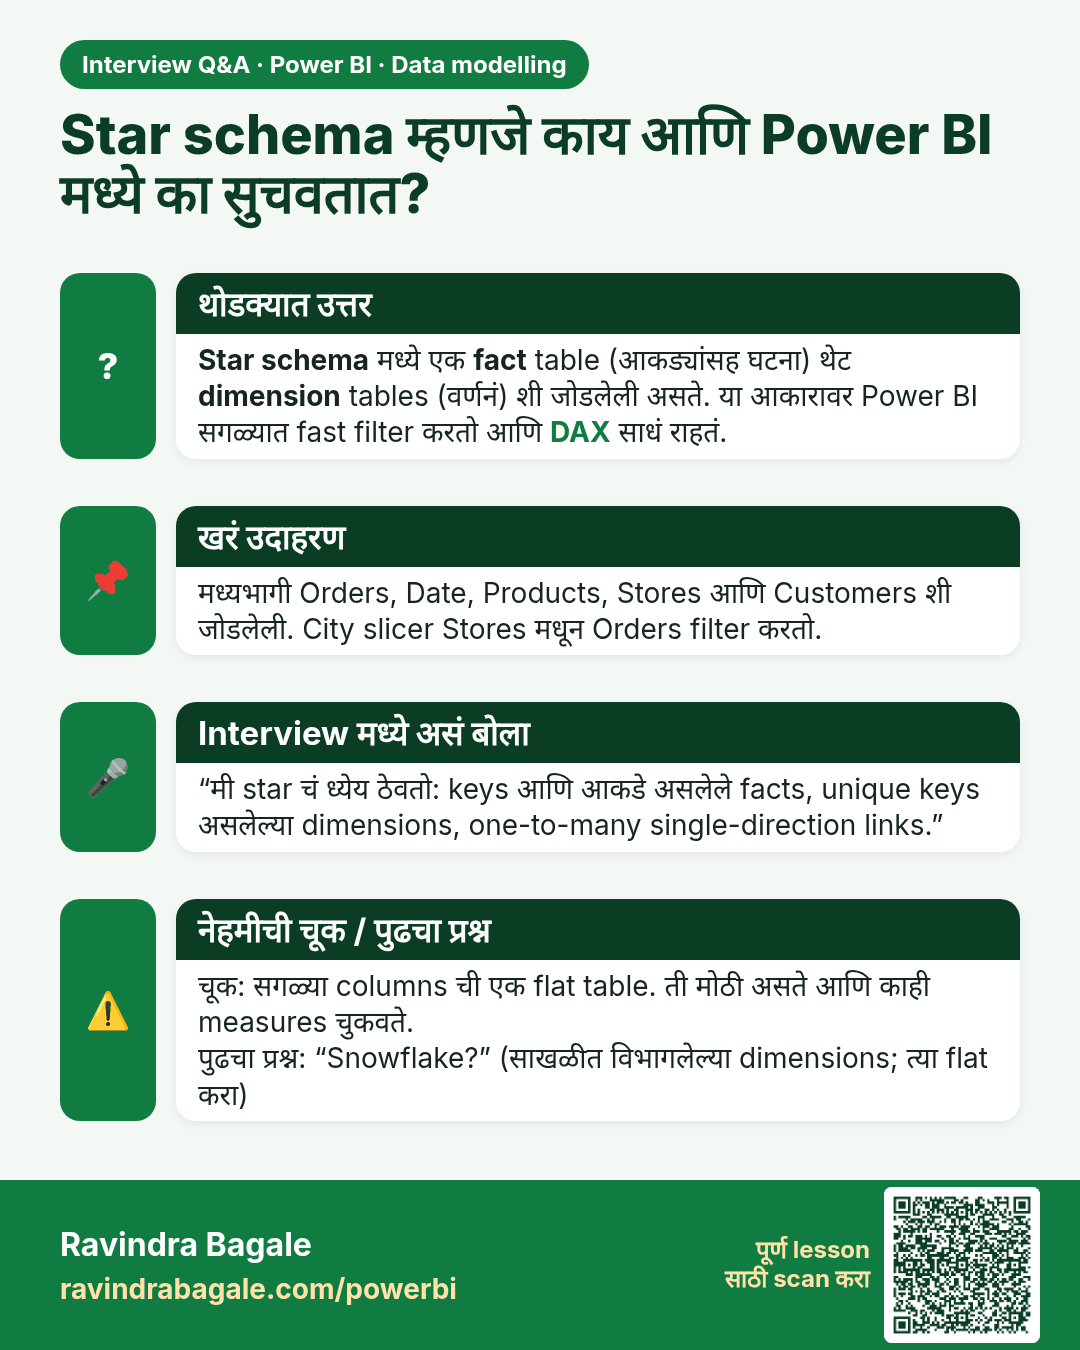
Star schema म्हणजे काय आणि Power BI मध्ये का सुचवतात? Star schema मध्ये एक fact table (आकड्यांसह घटना) थेट dimension tables (वर्णनं) शी जोडलेली असते. या आकारावर Power BI सगळ्यात fast filter करतो आणि DAX साधं राहतं.
मुलाखत (Interview) card 1 of 3: Star schema म्हणजे काय आणि Power BI मध्ये का सुचवतात? · PNG download करा · Card page उघडा

Lesson: 11.3 Star Schema vs Snowflake Schema in Power BI with Example
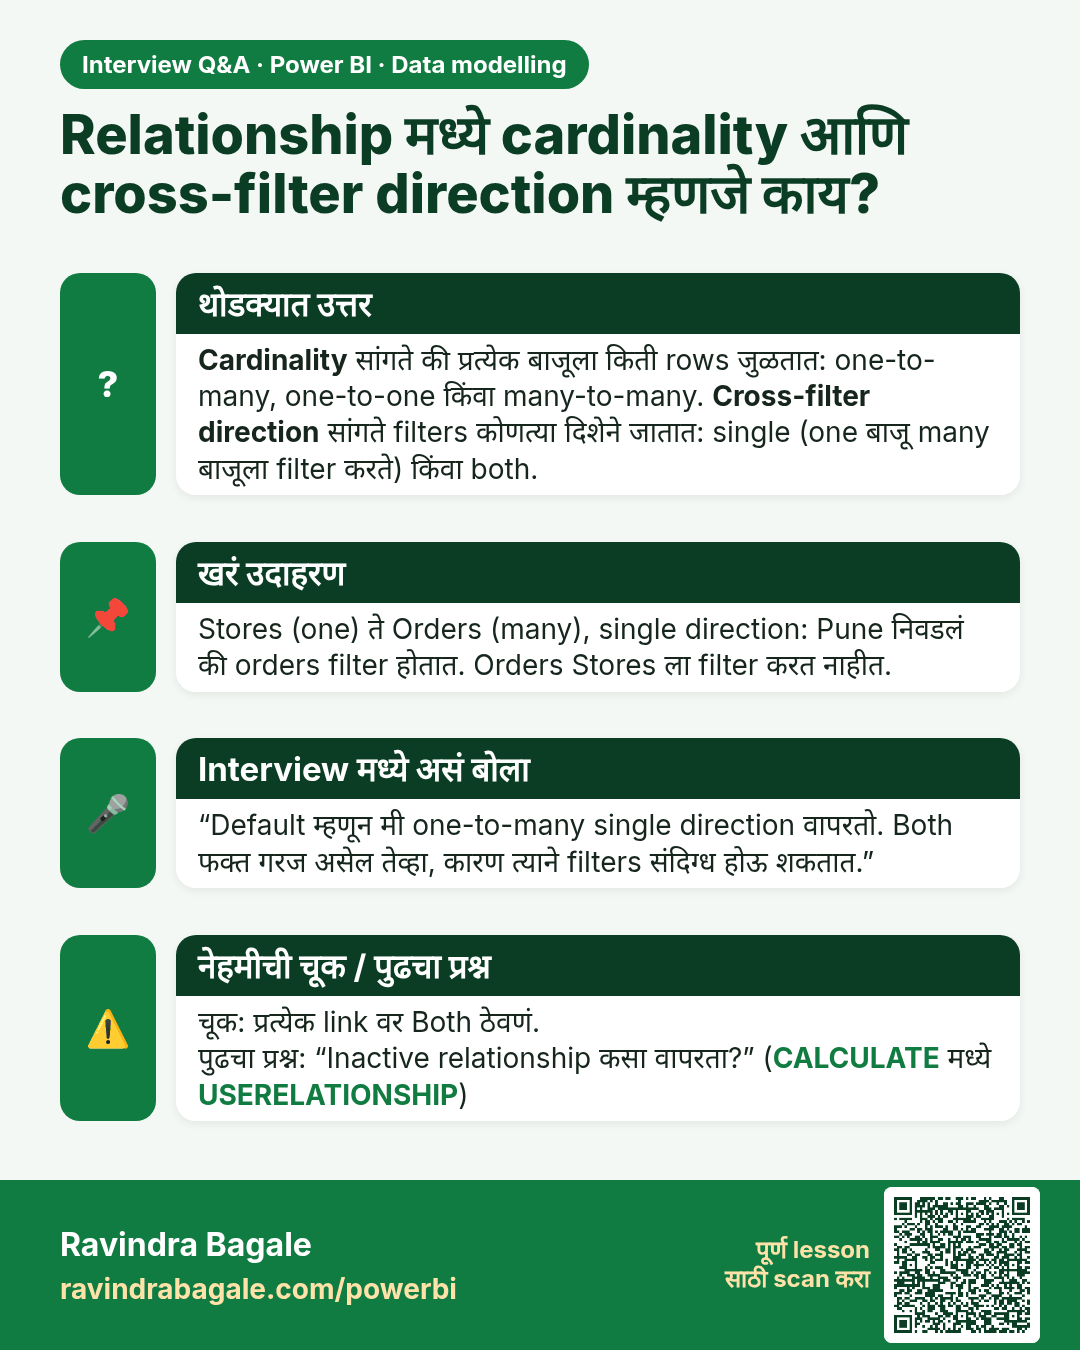
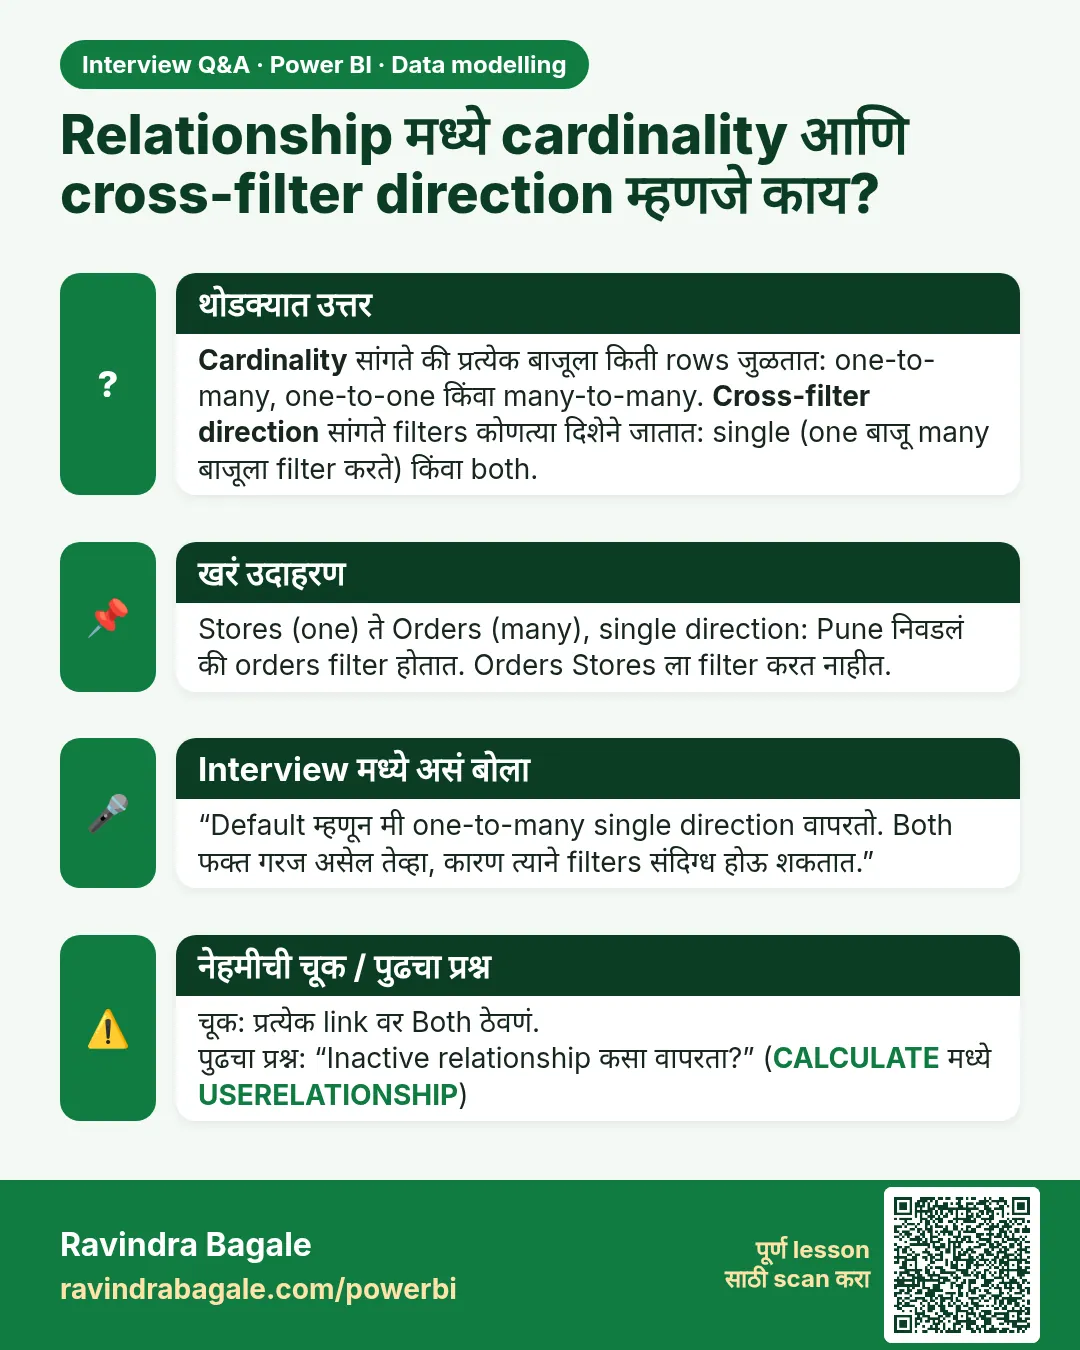
Relationship मध्ये cardinality आणि cross-filter direction म्हणजे काय? Cardinality सांगते की प्रत्येक बाजूला किती rows जुळतात: one-to-many, one-to-one किंवा many-to-many. Cross-filter direction सांगते filters कोणत्या दिशेने जातात: single (one बाजू many बाजूला filter करते) किंवा both.
मुलाखत (Interview) card 2 of 3: Relationship मध्ये cardinality आणि cross-filter direction म्हणजे काय? · PNG download करा · Card page उघडा

Lesson: 11.4 Relationships in Power BI with Example: Cardinality and Direction
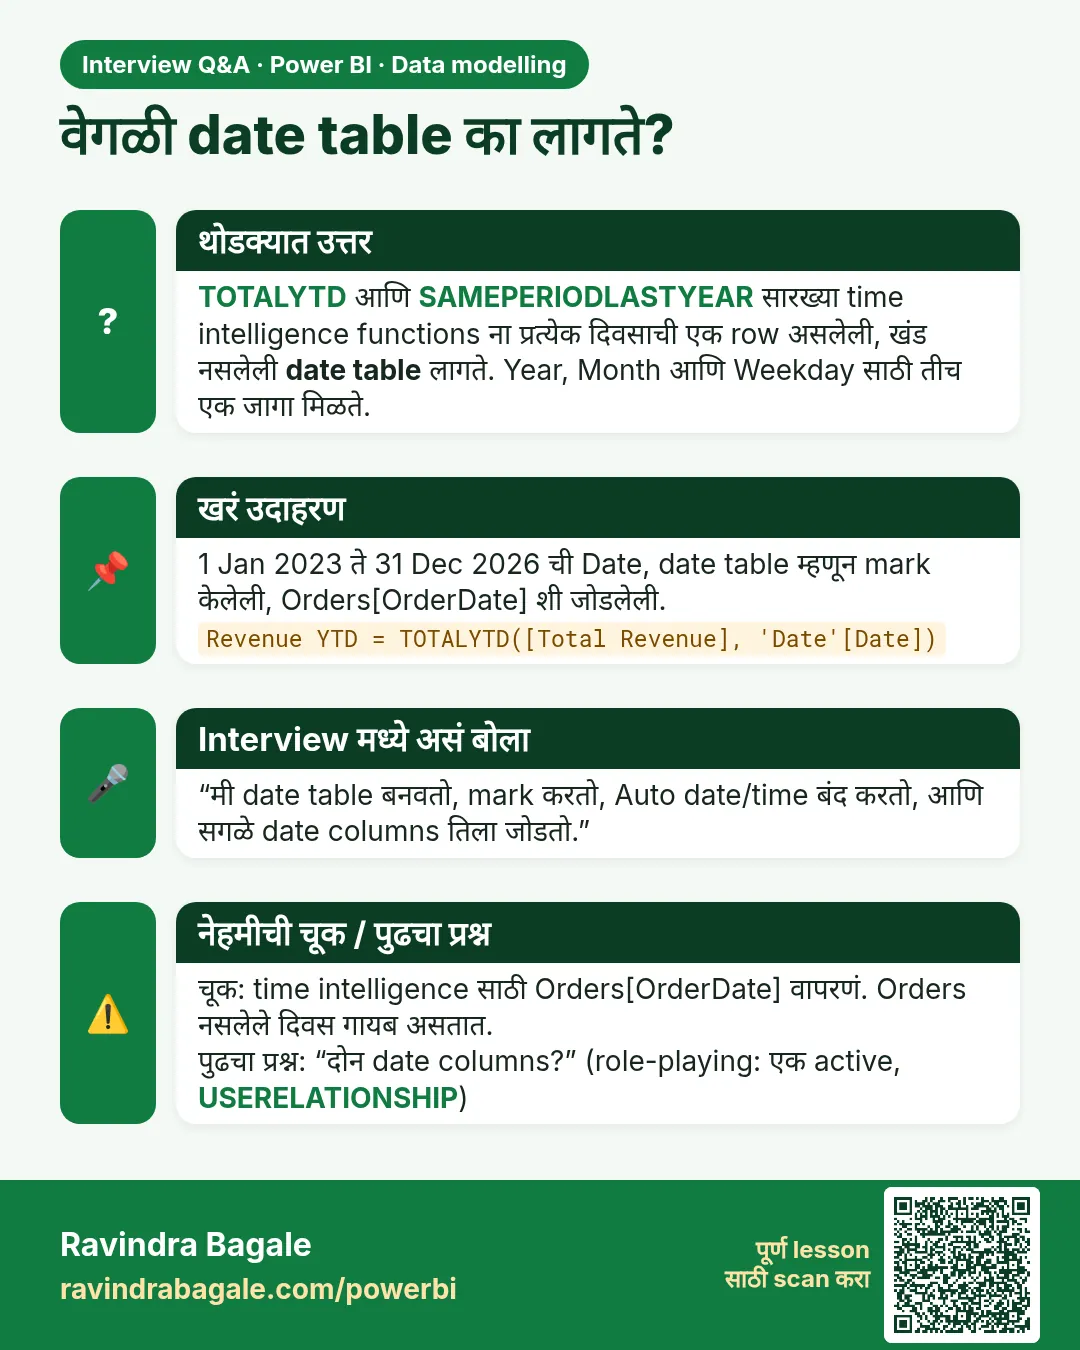
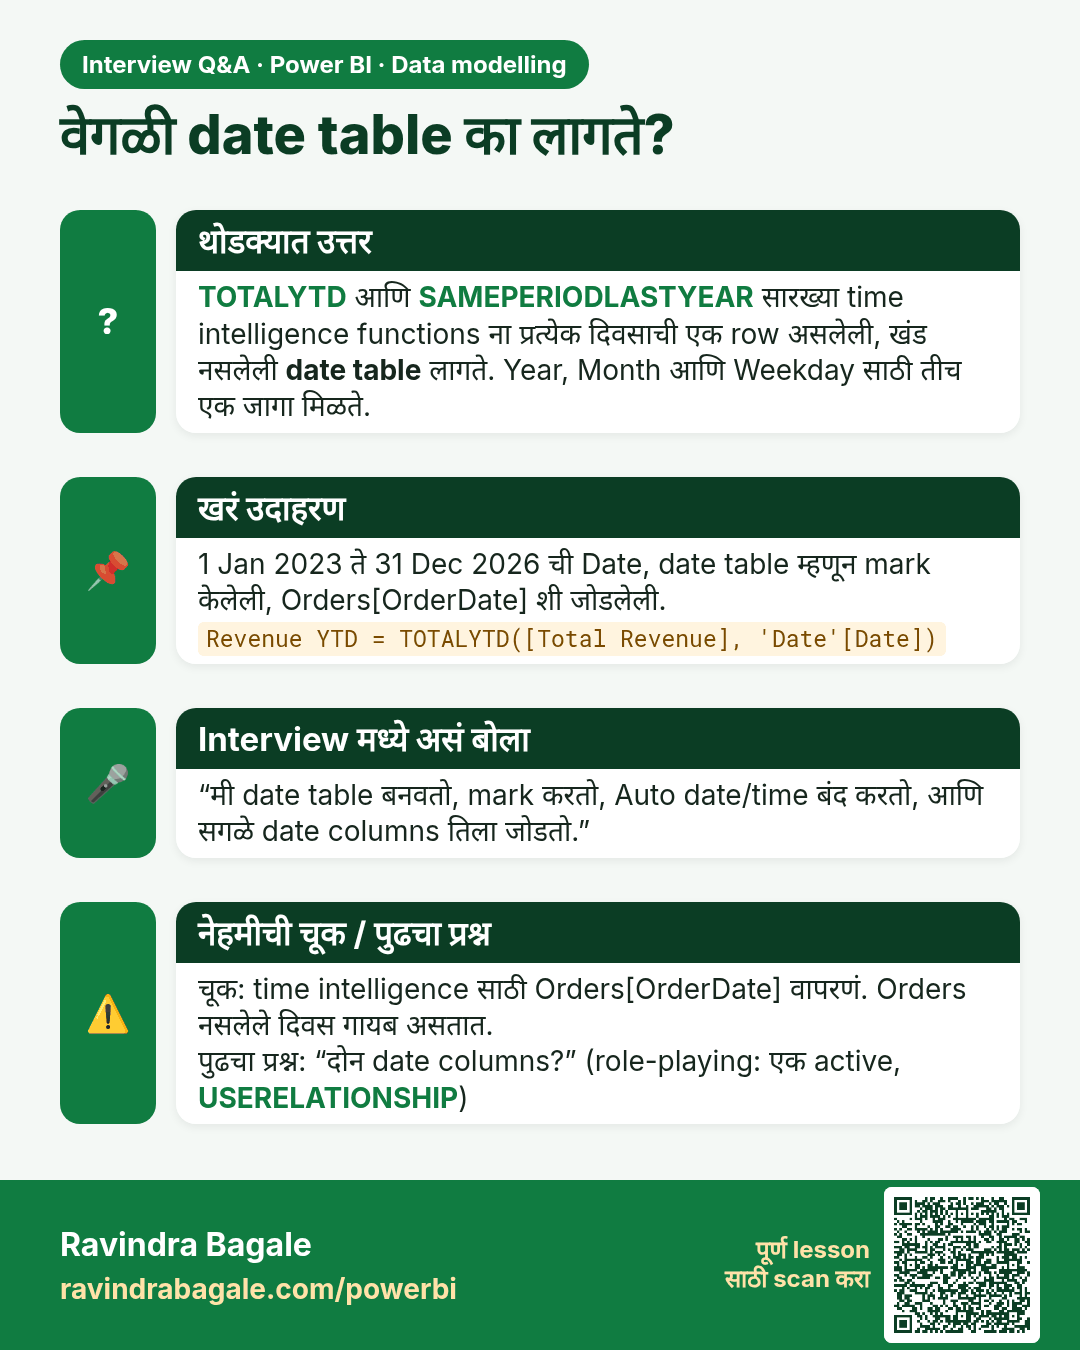
वेगळी date table का लागते? TOTALYTD आणि SAMEPERIODLASTYEAR सारख्या time intelligence functions ना प्रत्येक दिवसाची एक row असलेली, खंड नसलेली date table लागते. Year, Month आणि Weekday साठी तीच एक जागा मिळते.
मुलाखत (Interview) card 3 of 3: वेगळी date table का लागते? · PNG download करा · Card page उघडा

Lesson: 11.5 Date Table in Power BI with Example (April–March FY)
तुलना (Comparison) cards

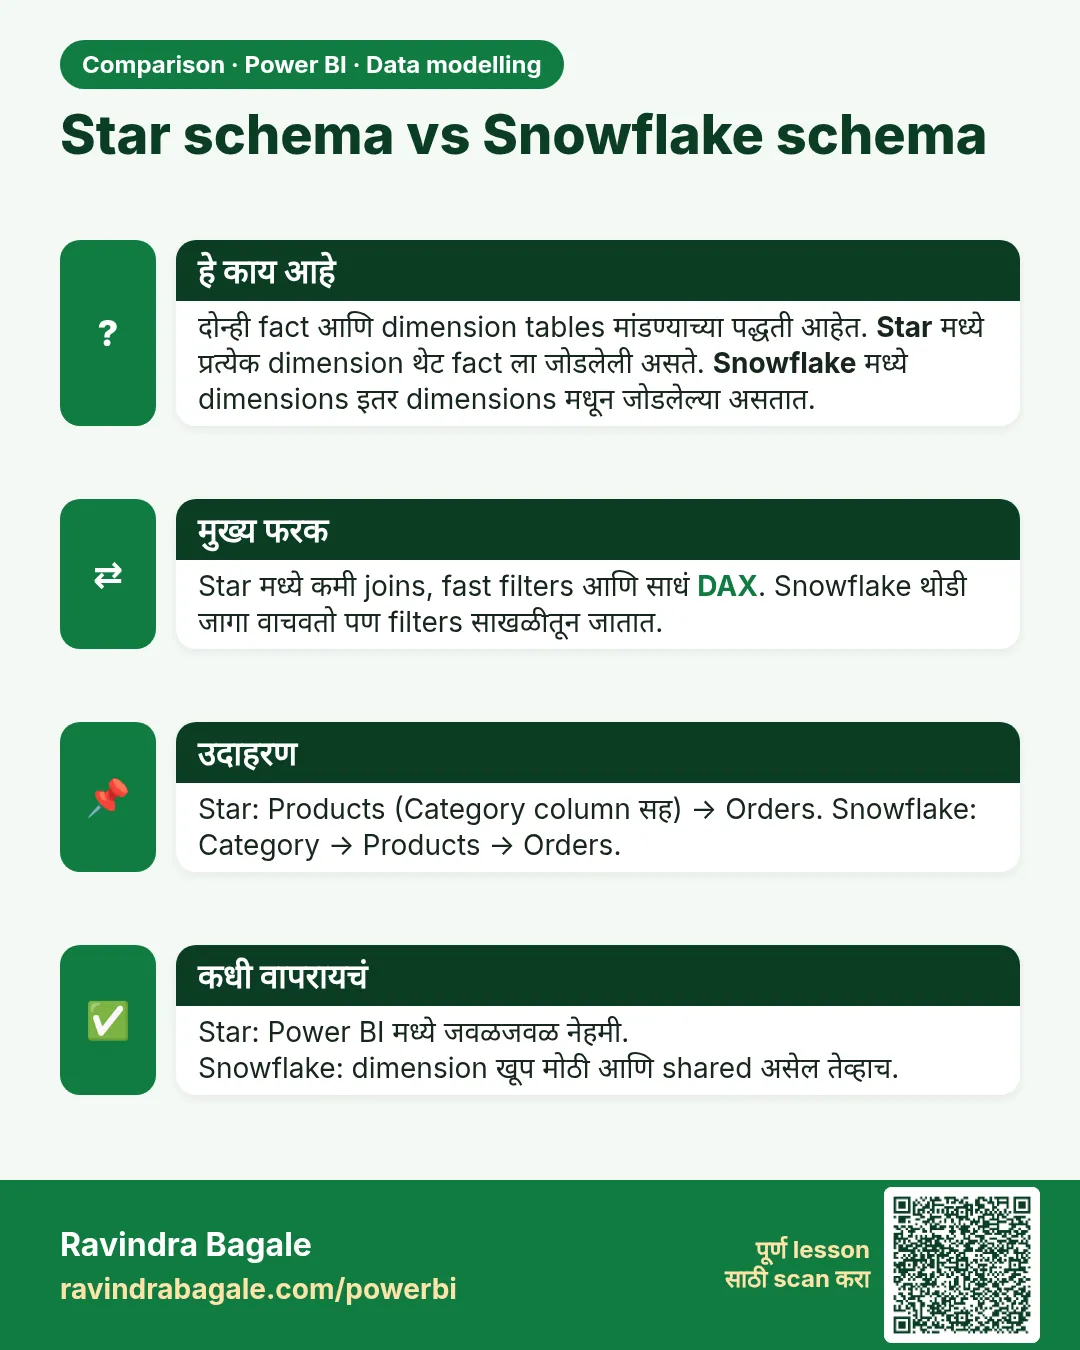
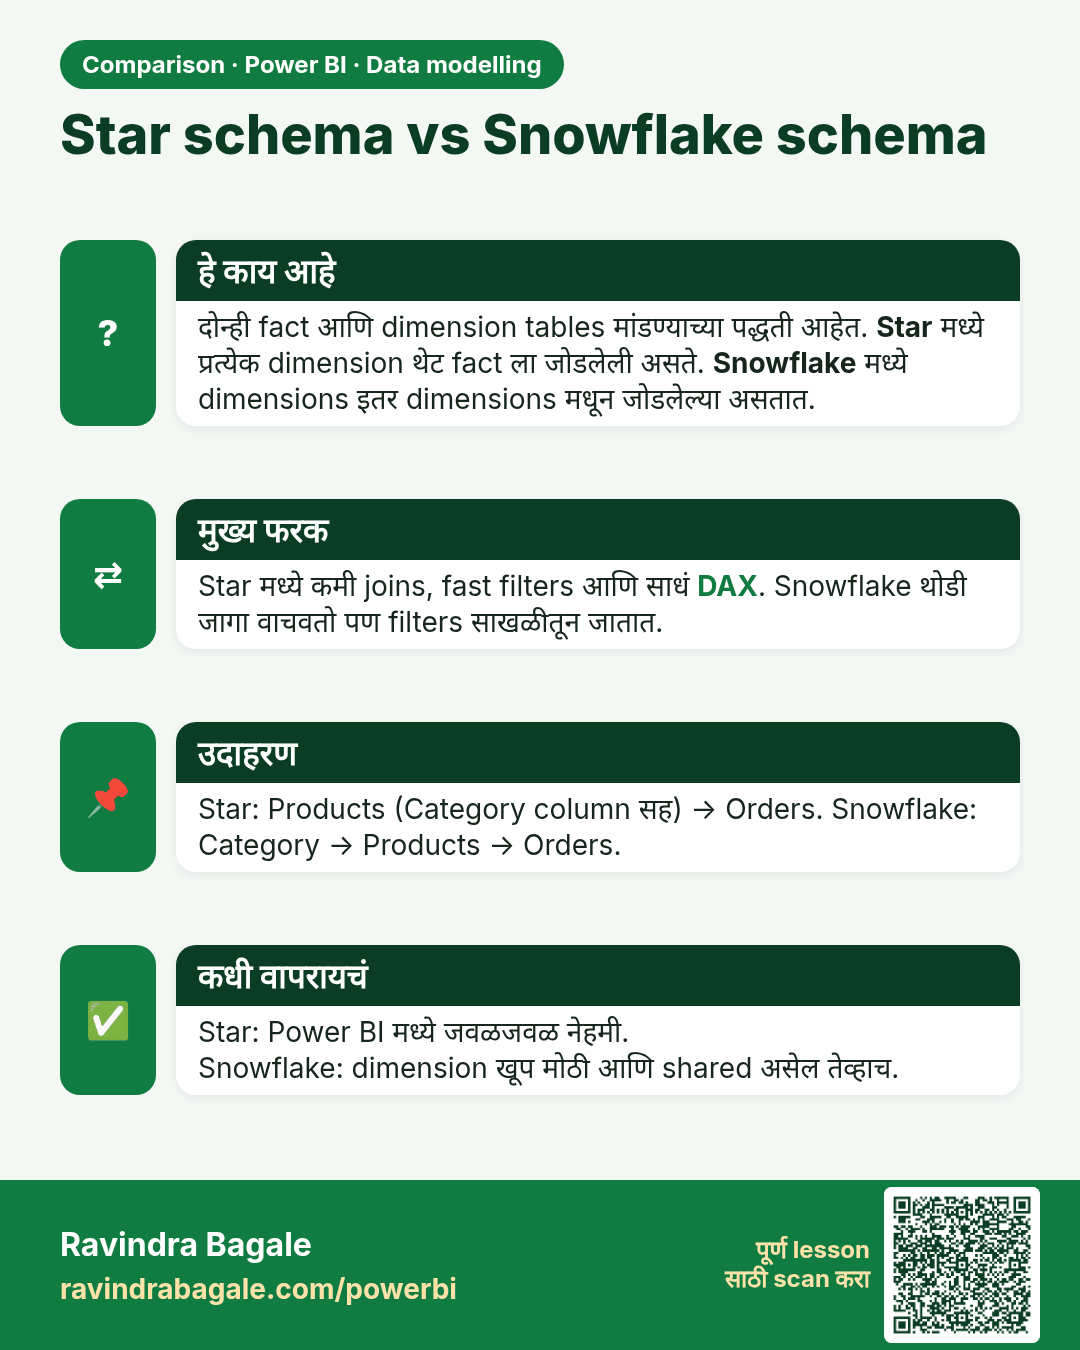
Star schema vs Snowflake schema. दोन्ही fact आणि dimension tables मांडण्याच्या पद्धती आहेत. Star मध्ये प्रत्येक dimension थेट fact ला जोडलेली असते. Snowflake मध्ये dimensions इतर dimensions मधून जोडलेल्या असतात.
तुलना (Comparison) card 1 of 2: Star schema vs Snowflake schema · PNG download करा · Card page उघडा

Lesson: 11.3 Star Schema vs Snowflake Schema in Power BI with Example
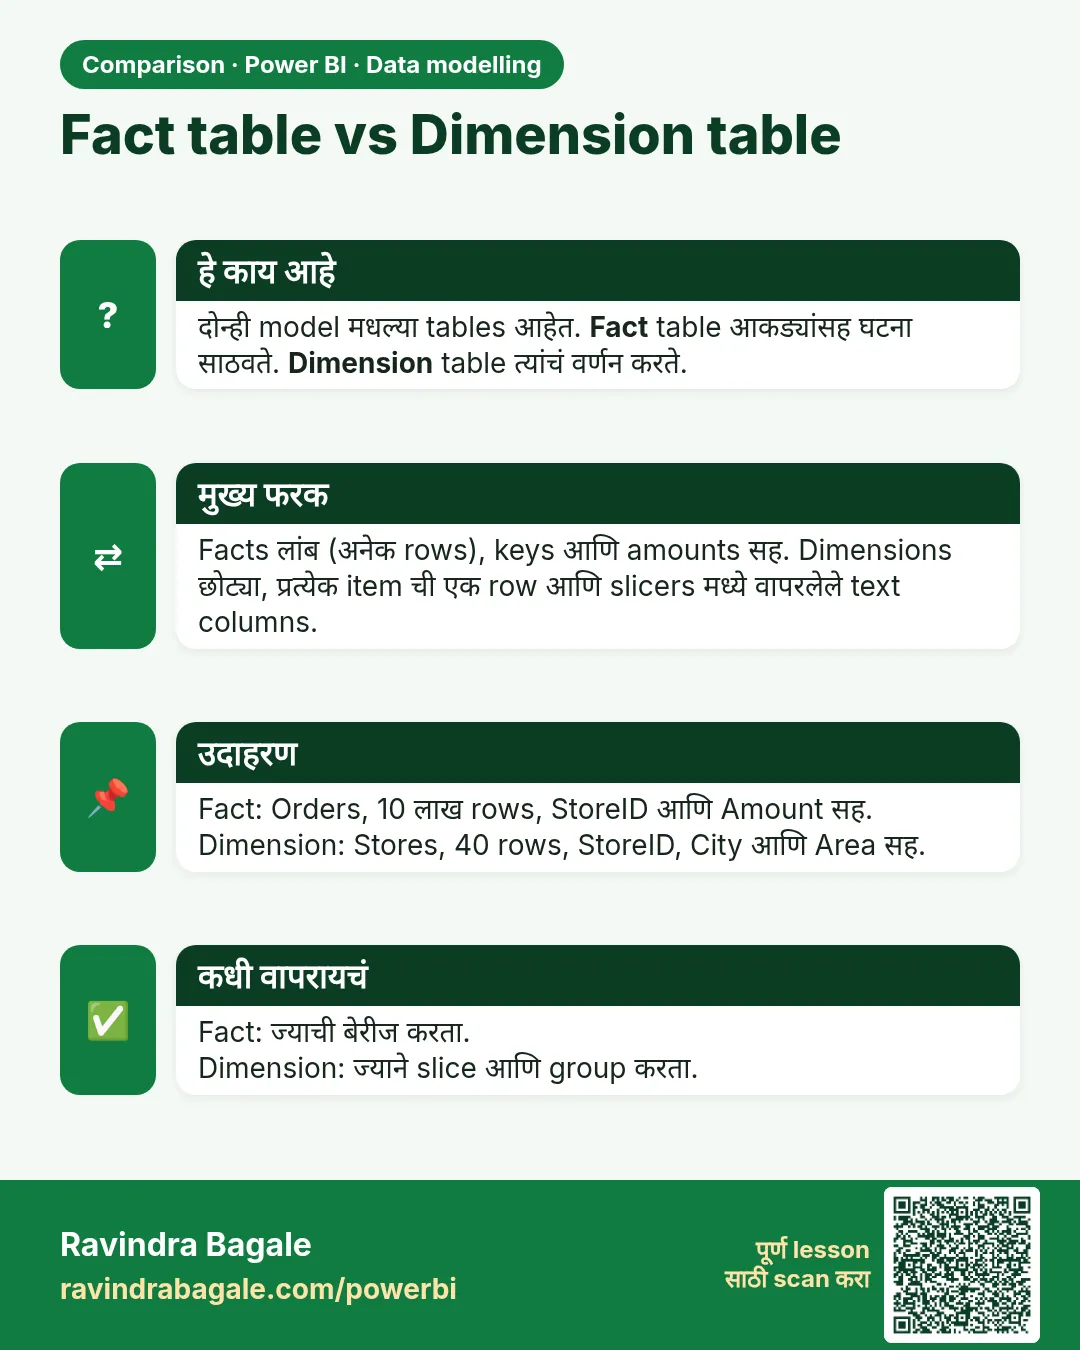
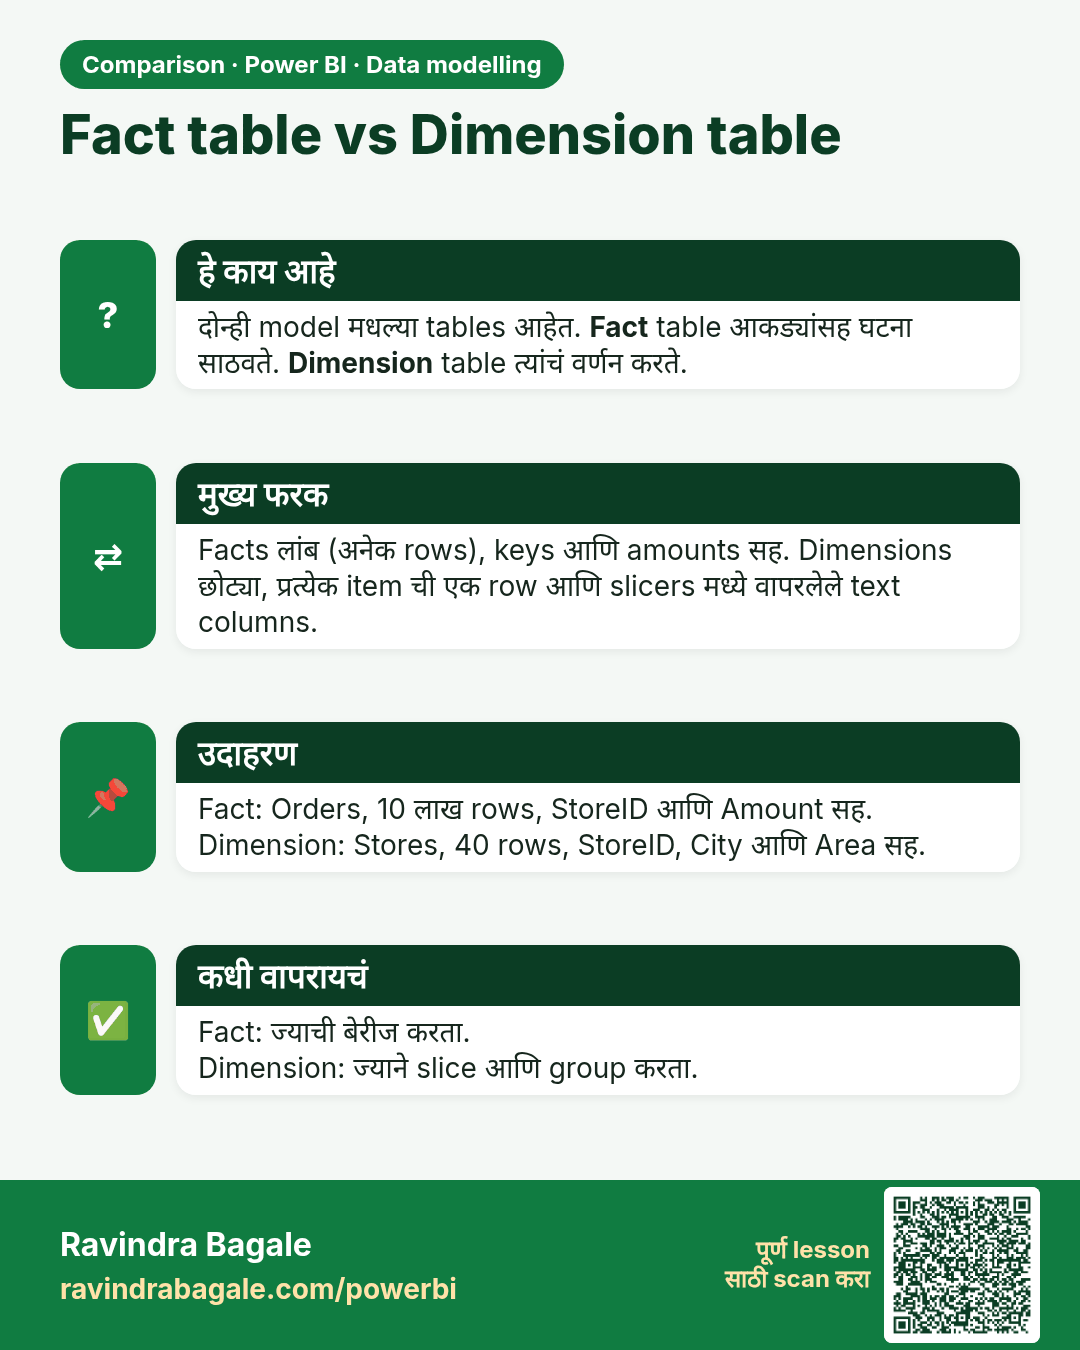
Fact table vs Dimension table. दोन्ही model मधल्या tables आहेत. Fact table आकड्यांसह घटना साठवते. Dimension table त्यांचं वर्णन करते.
तुलना (Comparison) card 2 of 2: Fact table vs Dimension table · PNG download करा · Card page उघडा

Lesson: 11.2 Fact Tables and Dimension Tables in Power BI with Example