11.1 Why Data Modelling Matters
Quick answer: the short, self-contained version of this lesson is the guide Star Schema in Power BI.
Start with a problem
Shraddha put store, city, region and manager details into every order row. The table is wide, repetitive, and the manager's email is repeated many times.
Explain simply
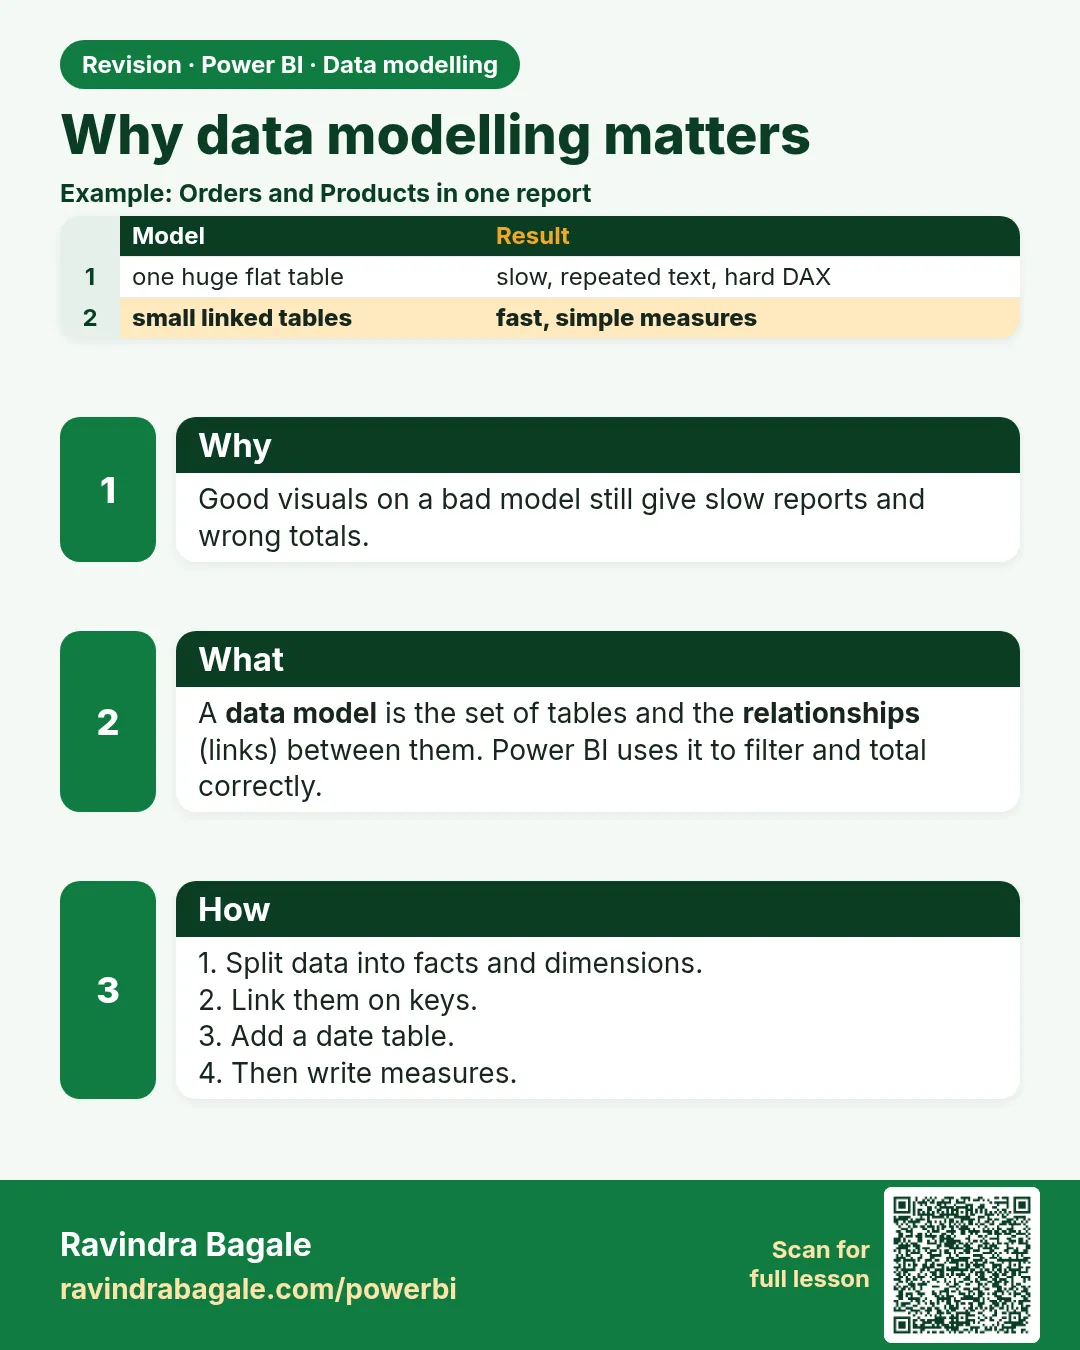
Data modelling splits data into a fact table (events such as orders) and dimension tables (descriptions such as stores), joined by keys. This is a star schema.
Show the data
| Table | Rows | Example columns |
|---|---|---|
| Orders (fact) | 8 | Order ID, Store, Amount |
| DarkStores (dimension) | 5 | Store, City, Region, Manager |
About this data: This table uses columns: Table, Rows, Example columns. This table uses columns: Region, Total Sales (₹). This table uses columns: Wrong result, Reason, Correction. Values shown are the lesson examples already on this page (not a new dataset).
Fictional sample data. Practice file: dark_stores_maharashtra.csv, visuals_orders_apr_may_2026.csv (source: src/practice/).
Demonstrate
- Load both CSVs.
- Model view: drag DarkStores[Store] onto Orders[Store].
- Check one-to-many (1 → *), single direction.
- Matrix: Region from DarkStores, Total Sales from Orders.
Show the result
Your result should look like this (fictional sample):
| Region | Total Sales (₹) |
|---|---|
| West Maharashtra | 850 |
| North Maharashtra | 800 |
| South Maharashtra | 450 |
| Total | 2,100 |
Explain what happened
The relationship lets the store's Region filter its orders; each store detail is stored once.
Explore further
- Module 11.2 explains fact and dimension tables in detail.
Detailed reference for this lesson:
A data model is the set of tables, the relationships between them and the calculations on top. A good model makes DAX simple, reports fast and numbers correct. A poor model (one giant flat table, or many-to-many relationships everywhere) causes slow reports and wrong totals. In interviews, strong modelling knowledge is what separates a report maker from a Power BI developer.
Ravindra Bagale's Tip
Friends, many students build every visual on one big flat table exported from Excel and then struggle with totals and slow reports. Split it into a fact table and dimensions early. A good model makes DAX simple, and a bad model makes every measure a fight. Never forget this.
Ravindra Bagale's Tip – मराठी
मित्रांनो, बरेच students Excel मधून export केलेल्या एकाच मोठ्या flat table वर प्रत्येक visual बनवतात आणि मग totals आणि slow reports शी झगडतात. सुरुवातीलाच त्याचे fact table आणि dimensions मध्ये तुकडे करा. चांगलं model DAX सोपं करतं, आणि वाईट model मध्ये प्रत्येक measure एक लढाई होते. हे अजिबात विसरू नका.
Ravindra Bagale's Tip – हिंदी
दोस्तों, बहुत से students Excel से export की गई एक ही बड़ी flat table पर हर visual बनाते हैं और फिर totals और slow reports से जूझते हैं. शुरुआत में ही उसे fact table और dimensions में बाँट दो. अच्छा model DAX को आसान बनाता है, और ख़राब model में हर measure एक लड़ाई बन जाता है. यह बिल्कुल मत भूलना.
Fix common mistakes
| Wrong result | Reason | Correction |
|---|---|---|
| Every region shows ₹2,100 | No relationship | Create Store relationship |
| Many-to-many warning | Duplicate stores in DarkStores | Remove duplicates |
| Region blank | Store spelling mismatch | Clean keys |
Practise independently
Practice task
Which region is Kolhapur in, and what is its total?
Hints
- DarkStores.
Solution
South Maharashtra, ₹450.
Think like a professional
Star schema is the most common modelling interview question; draw it.
 Revision card