28. End-to-End Project: Blinkit Quick-Commerce Dashboard
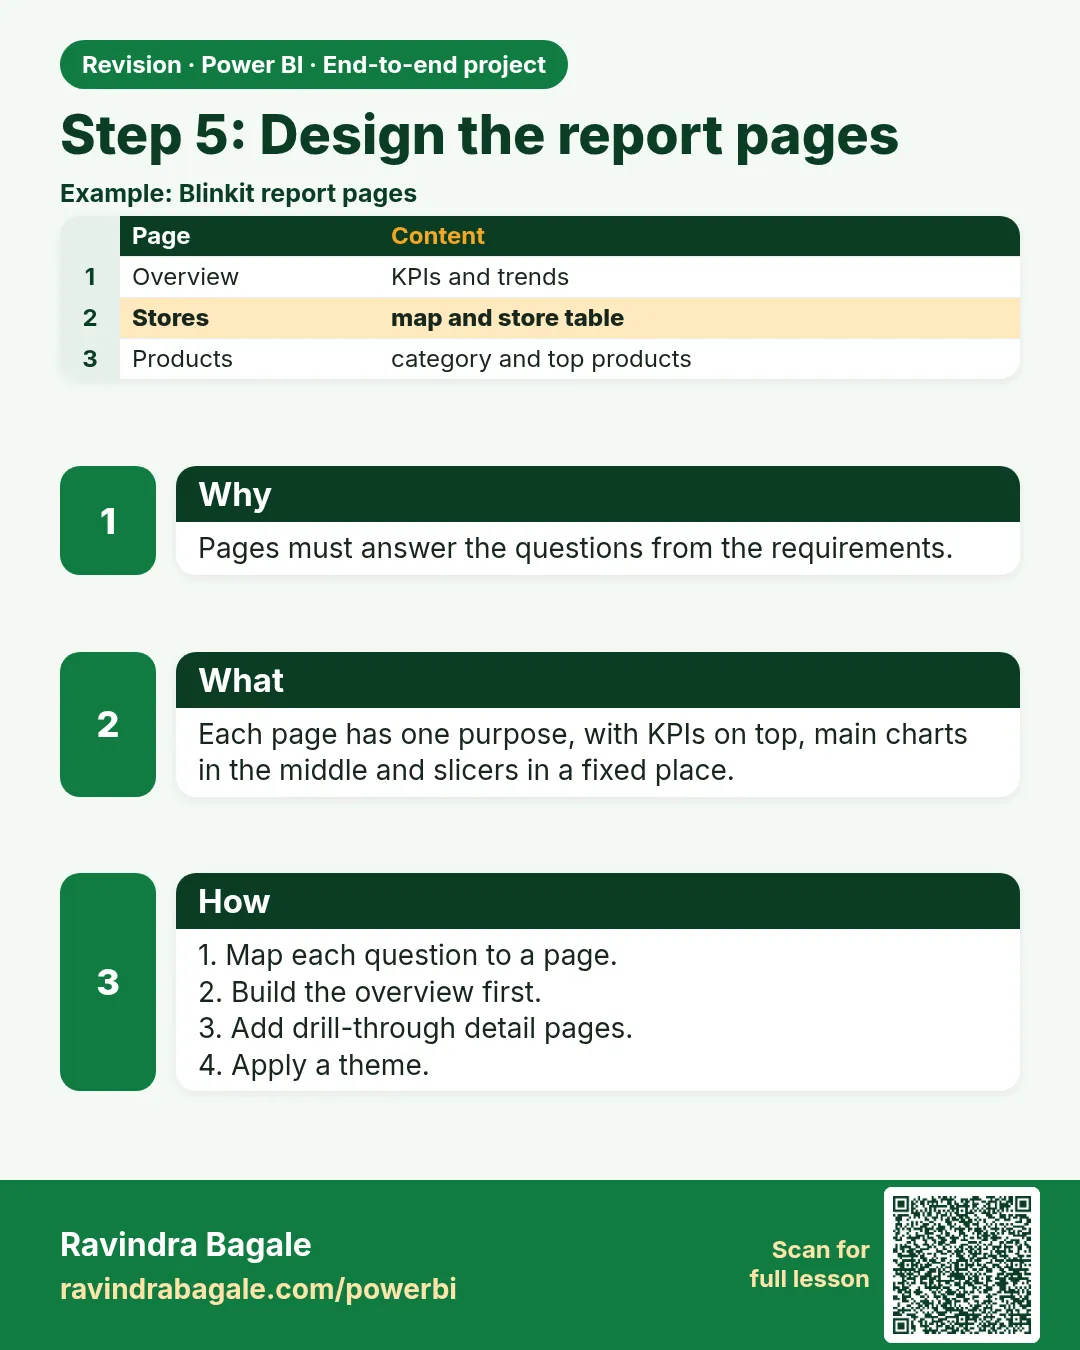
28.6 Step 5 – Design the Report Pages
Checkpoint F
Page 1 leads with the promise and cancel rate; total orders is context. Layout SVGs below are sample layouts — fictional data — not product screenshots.
Look: apply a theme first (View › Themes, or import your Quick Commerce Theme.json). Add a consistent header with the dynamic title and slicers for Date, City and Platform (synced across pages; on the Blinkit pages the Platform slicer can be preset to Blinkit and hidden).
Page 1: Blinkit Executive Overview
- Cards: Total Sales (₹), Total Orders, AOV (₹), Avg Delivery Time (mins), % Orders Delivered Under 10 Mins, Cancellation Rate.
- Line chart: Total Sales and Sales LY by month (festival months such as Diwali and Ganeshotsav stand out; annotate them).
- Clustered bar: Total Sales by Category (drill down to Sub Category).
- Map (using Map Location or latitude/longitude) or bar chart: Total Orders by City across Maharashtra.
- Donut: Orders by Payment Mode (4 slices).
Why this page exists
Page 1 exists so Rani can decide, in one screen, whether Monday is a demand story or a service story, and whether she must open a city. It does not exist to show that you know how to build six card types.
Who opens it on Monday. Rani, about 8:10 IST, before she calls the city managers. Not Shraddha. A Nashik-only reader will think the page is "about other cities" and miss the fact that her own 81% is not Gangapur. She has page 2 for that, under RLS.
The decision it changes. Do not end the call on 50 orders or on ₹16,000. AOV is ₹400 on both cities (Pune ₹7,600 ÷ 19 delivered, Nashik ₹8,400 ÷ 21). Money will not pick a store. The city rates are close: Nashik about 81% (17 of 21), Pune about 79% (15 of 19). The decision is "both cities get a store check before the call ends", not "Pune is the problem city and Nashik is fine". If you only phone the worse city bar, you will phone neither with any force, and Kothrud stays inside 79%.
KPIs that stay off this page. Repeat %, riders, store rank, hour of day, Blinkit versus Amazon Now, top products. They are real KPIs. They are the wrong meeting. Total orders may sit in a small card labelled context. It must not be the largest mark on the page.
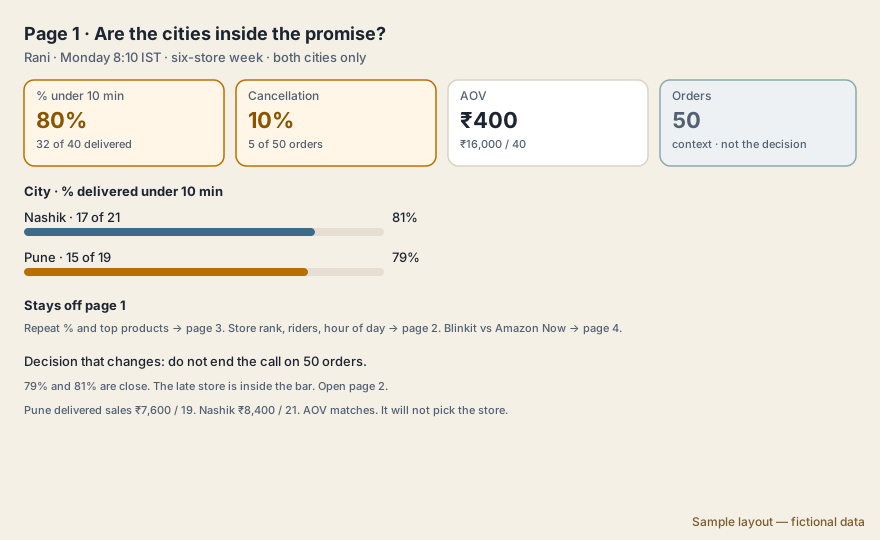
Sample layout — fictional data. Six-store week. 32 of 40 is 80%. 5 of 50 is 10%. ₹16,000 ÷ 40 is ₹400.
Page 2: Delivery Operations
- Line and column chart: Total Orders (columns) and Avg Delivery Time (line) by Order Hour – shows peak hours.
- Matrix: City › Store Name with Orders, Orders per Dark Store, Avg Delivery Time, % Under 10 Mins, Cancellation Rate, Store Speed Rank; background colour from
[Delivery Time Colour]. - Scatter chart: Orders vs Avg Delivery Time per dark store.
- Table: delivery partners (Partner Name, Vehicle Type, orders delivered, avg time).
- Drill through to a Dark Store Details page (Store Name as drill-through field, with a Back button).
Why this page exists
Page 2 exists because the city rate is not a store. This is the page that earns the project. Rani's cockpit cannot finish the job. Someone has to see Kothrud at 3 of 6 and Gangapur at 4 of 6 in the same morning, and leave Baner alone.
Who opens it on Monday. Ravindra Bagale for Pune, and Shraddha Bagale for Nashik, about 8:40 IST, after Rani's call or instead of waiting for it. Each of them should be under RLS, so Shraddha's page is the Nashik rows only. The picture below shows both cities on one layout so you can see the lesson. Do not ship that combined view to a city manager. The company role, Rani, may see both.
The decision it changes. Kothrud gets the Pune conversation: 50% under 10 minutes (3 of 6 delivered) and 25% cancelled (2 of 8). Gangapur gets the Nashik conversation: 66.7% (4 of 6) and 12.5% cancelled (1 of 8). Baner does not get a rider moved in, even though it has only 6 orders: 5 of 5 under 10 minutes and no cancels. College Road (12 orders, 9 of 10, one cancel in 12) is the pattern, not the emergency. Sort this page by the promise, not by orders. An order sort puts College Road first and teaches the wrong Monday.
KPIs that stay off page 1, and also off the top of this page. The store matrix is this page. It stays off page 1. Rider names and vehicle type stay below the matrix, or one click down. They matter after the store is named: which partner was on the two slow Kothrud orders. They do not outrank the store. Repeat % and platform share do not belong here at all. A scatter of orders versus time is useful only if Kothrud is visibly the high-time, not-high-orders store. If the scatter is a cloud with no sentence, drop it. The hour chart stays, because a store that is late only after 9 pm is a different action from a store that is late at noon.
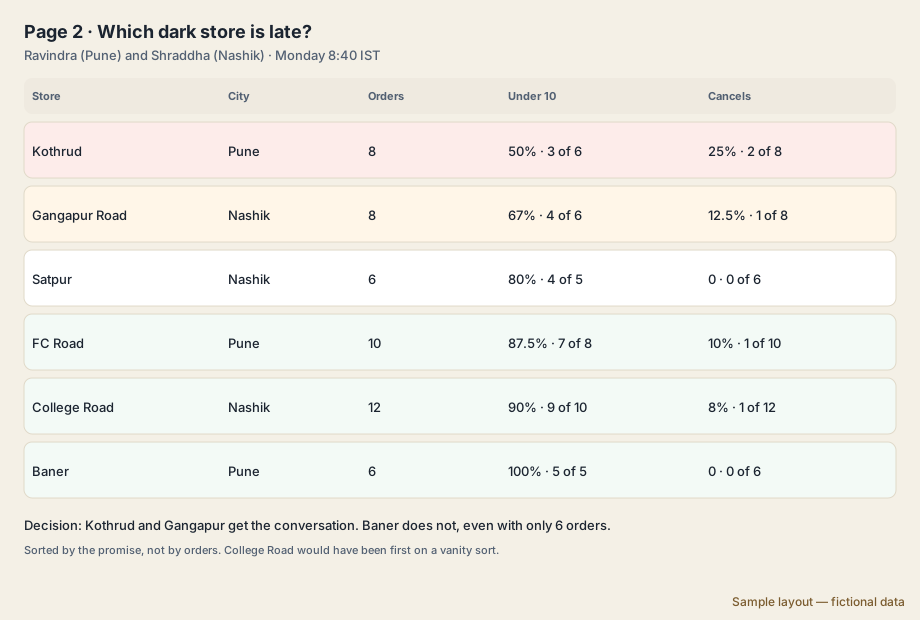
Sample layout — fictional data. Same rows as section 23.7. FC Road is 7 of 8, which is 87.5%, not a separate extract. College Road would lead an order sort and does not lead this one.
Page 3: Customers and Products
- Cards: Active Customers, Repeat Customer %.
- Bar chart: Top 10 products (Top N filter by Total Sales).
- Treemap: Sales by Category › Sub Category.
- Column chart: Active Customers by month; report-page tooltip with customer city details.
Why this page exists
Page 3 exists to change a commercial action: who to invite back, and which products actually sold. It exists so those questions have a home that is not Monday's rider meeting. A report with nowhere for them will dump them on page 1.
Who opens it on Monday. Almost nobody in the ops call. If Rani opens it at 8:10 she will talk about repeat % and walk past Kothrud. Zoya can open the Pune customer slice on Tuesday, when the question is who came back, not who was late. Shraddha opens it only after Gangapur is already named, and only if she suspects the late orders were a customer pattern rather than a rider. That is a second question, not the first.
The decision it changes. In the separate fictional slice drawn below, 6 of 18 customers bought more than once, 33%. Pune is 4 of 10. Nashik is 2 of 8. The action is a second-order offer where repeat is thin, or a hard look at a product that is being returned. It is not "add a rider at the store with fewer customers". Customer counts are not delivery capacity.
KPIs that stay off page 1. Active customers, repeat %, top products, the treemap, the cohort. All of them. They also stay off the delivery matrix. And the order count of the six-store week stays off this page. Do not divide 6 by 50. The 18 people are not the 50 orders. The caption says so because mixing files is how a portfolio project invents a fake reconciliation.
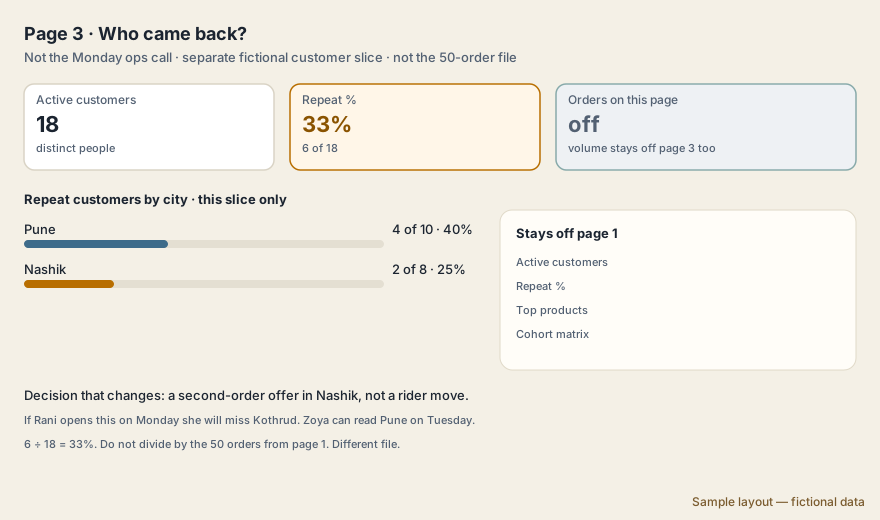
Sample layout — fictional data. 6 ÷ 18 = 33%. This slice is not section 23.7.
Page 4: Blinkit vs Amazon Now Comparison
- Clustered column: Total Orders, AOV and Avg Delivery Time by Platform (or small multiples by City).
- Line chart: daily orders by Platform (legend = Platform).
- Matrix: City rows × Platform columns with Orders, AOV, % Under 10 Mins, Cancellation Rate.
- Card: Blinkit Share of Orders %.
- A field parameter slicer to switch the comparison metric (Orders / Sales / Avg Delivery Time).
Why this page exists
Page 4 exists because "Pune is late" can still be the wrong platform. Blinkit and Amazon Now can share a city and not share a promise. The Monday store page cannot see that split unless the model is filtered, and a filter the reader forgets to clear will lie. A page whose only job is the comparison is harder to misread.
Who opens it on Monday. Not by default. Rani opens it on the platform compare — in this story, Thursday — or on a Monday only after page 2 has named a city and she still does not know which platform produced the misses. Shraddha does not need Amazon Now rows for a Gangapur rider conversation unless those rows are in her store. Do not make page 4 the home screen to look thorough.
The decision it changes. This picture uses a separate fictional slice. Do not add it to the 50 orders.
- Pune Blinkit: 19 of 22 delivered under 10 minutes, 86.4%.
- Pune Amazon Now: 9 of 14, 64.3%. Five of those 14 missed.
- Nashik Blinkit: 18 of 20, 90%.
- Nashik Amazon Now: 15 of 17, 88.2%.
Pune is the platform fight. Amazon Now is the late one there, even if its order count is smaller. Nashik is not a platform fight this week; both sit near 90%. The decision: in Pune, open Amazon Now's misses (5 of 14), and do not reward Blinkit for a larger count. The order cards on the picture are these delivered rows added up: Blinkit 22 + 20 = 42, Amazon Now 14 + 17 = 31. Forty-two is bigger. It is still the wrong reason to celebrate, because Pune's Amazon Now rate is the late one. The gap on the picture is 86% minus 64%, about 22 points, the nearest-percent version of 86.4 − 64.3.
KPIs that stay off page 1. Blinkit share of orders, either platform's AOV, this matrix, the daily line by platform. Share of orders is the vanity metric of this page. A platform can have the larger share and the worse promise. If share leads, you will staff the logo instead of the late deliveries.
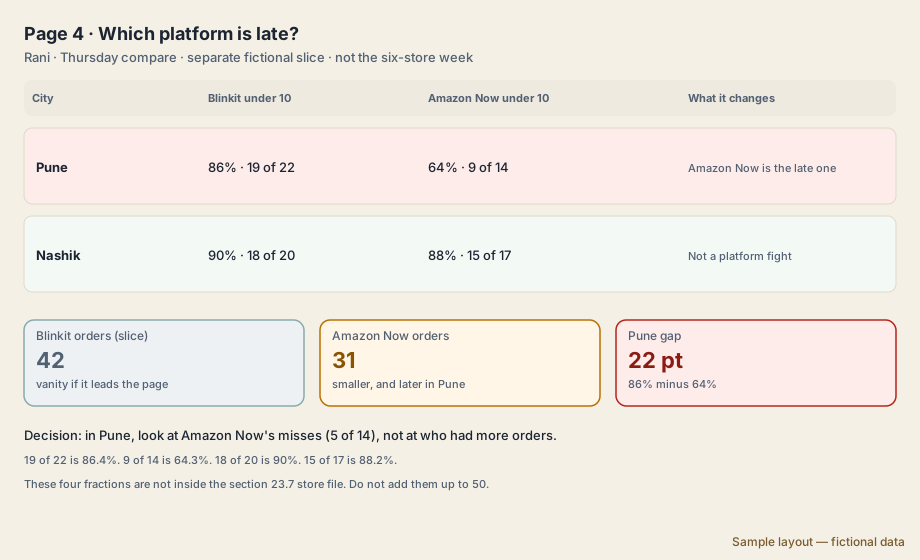
Sample layout — fictional data. Not the six-store week. 19/22, 9/14, 18/20, 15/17. Do not force them to sum to 50.
The field parameter on this page is how Rani switches the comparison without you building three reports. It does not decide the KPI. You still have to say, in the title, that the promise is % under 10 minutes and that order count is not the winner.
Navigation and interactions
- A vertical page navigator menu on every page, and a show/hide filter panel with Platform, City and Date slicers synced across pages (Modules 19.6–19.8, 22.9).
- Drill down on the Location and Date hierarchies (Module 16), and drill through from any store to the hidden Dark Store Details page (Module 17).
- A report page tooltip TT City Snapshot on city visuals (Module 18.3).
- Dynamic titles showing selected cities/platform, and delivery-time colours (red above 15 minutes) with a DAX colour measure (Module 20).
- A Metric Selector field parameter and a dynamic Top N products chart on page 3 (Module 21).
- A Region group (West, Vidarbha, North Maharashtra, Marathwada, South Maharashtra) for the map and matrix (Module 12.5).
- A Reset filters bookmark button and a chart/table toggle on the Delivery page (Module 19).
- Edit interactions so KPI cards are not cross-highlighted by the donut, if that is confusing (Module 22.10).
- Alt text on key visuals and a logical tab order (Modules 14.2, 19.3).
Ravindra Bagale's Tip
Friends, many students design all pages at once and end up with inconsistent layouts. Design the Overview page fully (theme, header, navigation, KPI cards), then copy it as the template for the other pages. Remember this rule.
Ravindra Bagale's Tip – मराठी
मित्रांनो, बरेच students सगळी pages एकदम design करतात आणि शेवटी layouts विसंगत होतात. आधी Overview page पूर्ण design करा (theme, header, navigation, KPI cards), मग इतर pages साठी template म्हणून त्याची copy करा. हा नियम लक्षात ठेवा.
Ravindra Bagale's Tip – हिंदी
दोस्तों, बहुत से students सारे pages एक साथ design करते हैं और आख़िर में layouts बेमेल हो जाते हैं. पहले Overview page पूरा design करो (theme, header, navigation, KPI cards), फिर बाकी pages के लिए template के रूप में उसकी copy करो. यह नियम याद रखो.
 Revision card