28. End-to-End Project: Blinkit Quick-Commerce Dashboard
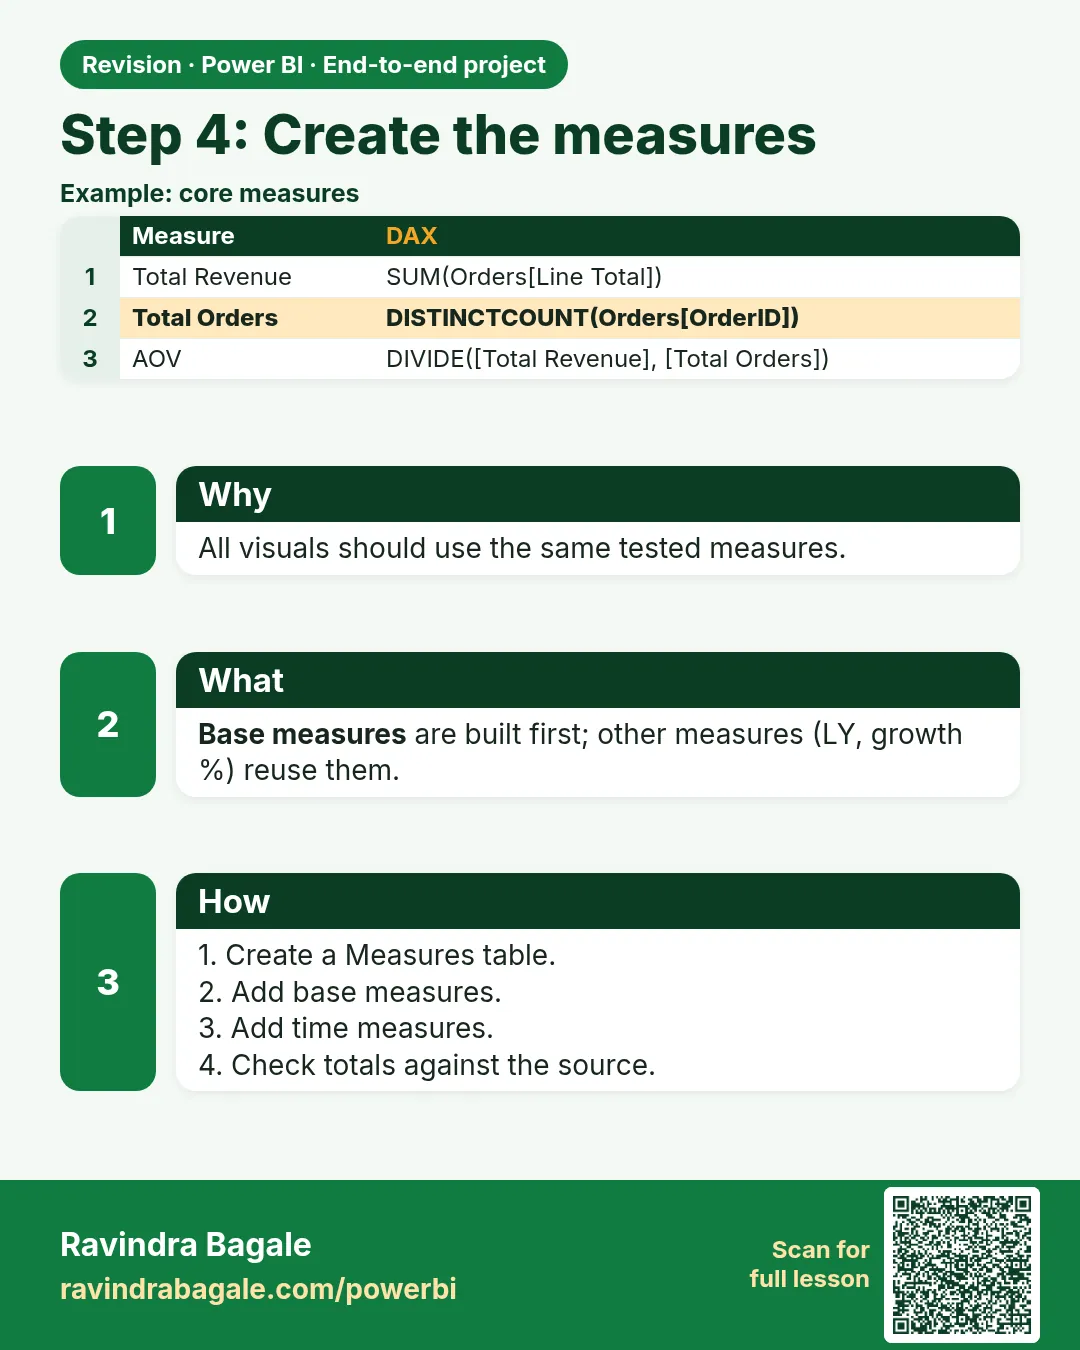
28.5 Step 4 – Create the Measures
Checkpoint D–E
Match the eight-order worked example in this section by hand before building pages. % Under 10 Mins and cancel rate first.
| Folder | Measure | DAX |
|---|---|---|
| Sales | Total Sales | SUM(Orders[Amount]) |
| Sales | Total Discount | SUM(Orders[Discount]) |
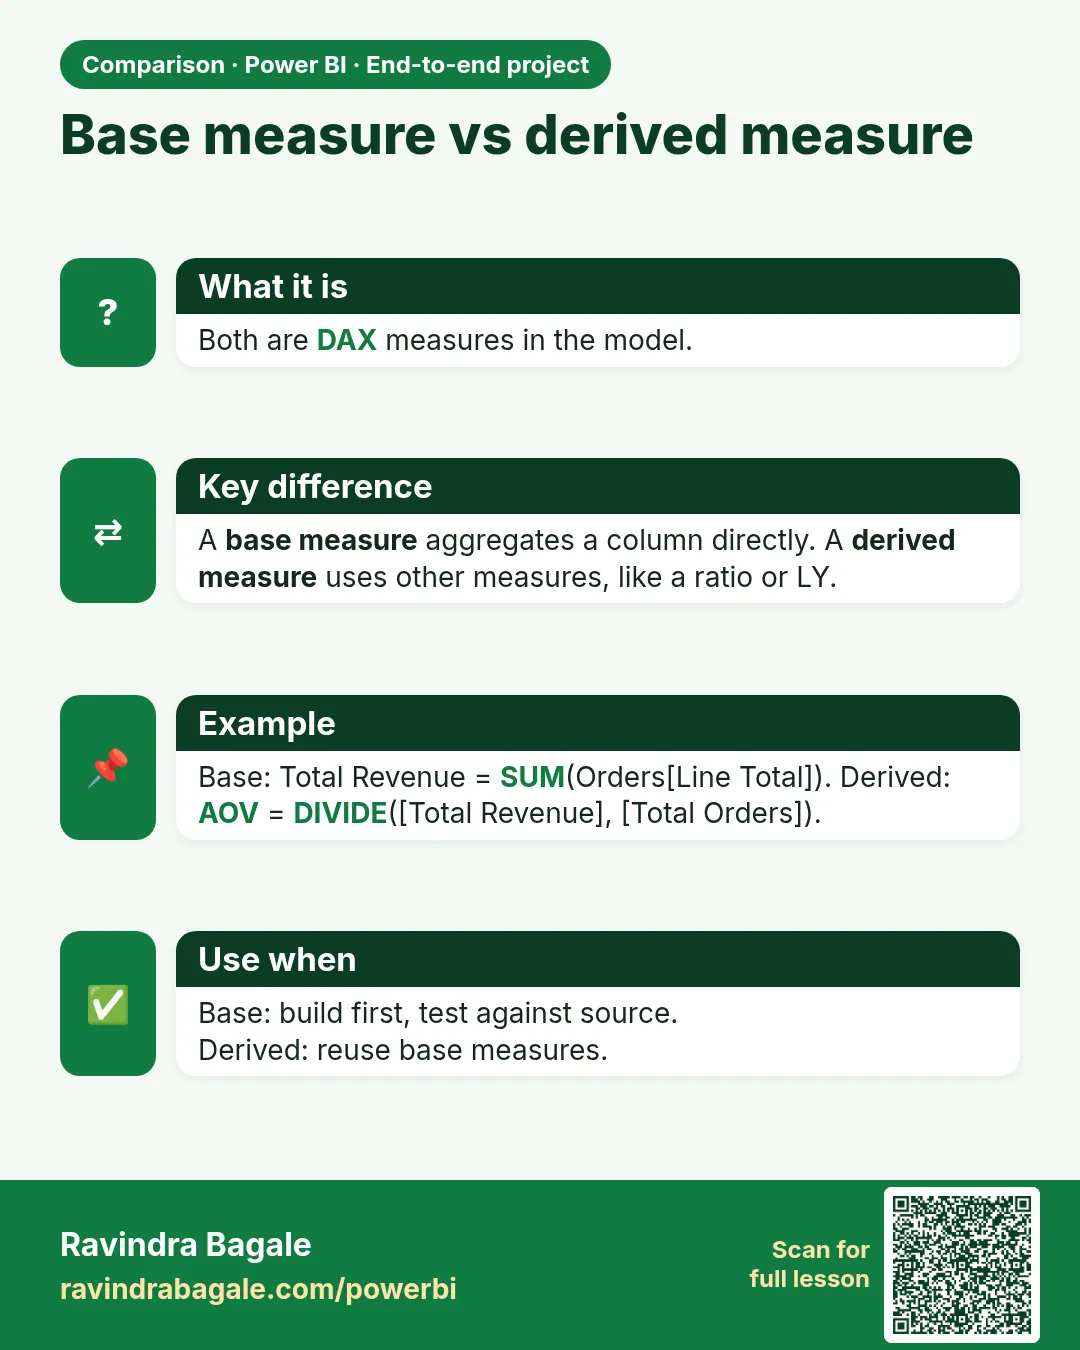
| Sales | AOV | DIVIDE([Total Sales], [Delivered Orders]) |
| Sales | Gross Margin % | DIVIDE([Gross Profit], [Total Sales]) (see Module 13.5) |
| Sales | Delivery Fee Revenue | SUMX(VALUES(Orders[Order ID]), CALCULATE(MAX(Orders[Delivery Fee]))) |
| Orders | Total Orders | DISTINCTCOUNT(Orders[Order ID]) |
| Orders | Delivered Orders | CALCULATE([Total Orders], Orders[Order Status] = "Delivered") |
| Orders | Cancelled Orders | CALCULATE([Total Orders], Orders[Order Status] = "Cancelled") |
| Orders | Cancellation Rate | DIVIDE([Cancelled Orders], [Total Orders]) |
| Orders | Orders per Dark Store | DIVIDE([Total Orders], DISTINCTCOUNT(Orders[Store ID])) |
| Delivery | Avg Delivery Time (mins) | AVERAGEX(VALUES(Orders[Order ID]), CALCULATE(MAX(Orders[Delivery Time Mins]))) |
| Delivery | % Orders Delivered Under 10 Mins | DIVIDE(CALCULATE([Delivered Orders], Orders[Delivery Time Mins] <= 10), [Delivered Orders]) |
| Delivery | Store Speed Rank | RANKX(ALL(DarkStore[Store Name]), [Avg Delivery Time (mins)], , ASC, DENSE) |
| Customers | Active Customers | DISTINCTCOUNT(Orders[Customer ID]) |
| Customers | Repeat Customer % | DIVIDE(COUNTROWS(FILTER(VALUES(Customer[Customer ID]), [Total Orders] > 1)), [Active Customers]) |
| Time | Sales LY | CALCULATE([Total Sales], SAMEPERIODLASTYEAR('Date'[Date])) |
| Time | YoY Growth % | DIVIDE([Total Sales] - [Sales LY], [Sales LY]) |
| Time | Orders Previous Month | CALCULATE([Total Orders], DATEADD('Date'[Date], -1, MONTH)) |
| Time | MoM Orders Growth % | DIVIDE([Total Orders] - [Orders Previous Month], [Orders Previous Month]) |
| Time | Sales YTD | TOTALYTD([Total Sales], 'Date'[Date]) |
| Time | Orders 7D Moving Avg | see Module 13.16 |
| Time | Festival Orders | CALCULATE([Total Orders], 'Date'[Is Festival Day] = TRUE()) |
| Platform | Blinkit Orders | CALCULATE([Total Orders], Orders[Platform] = "Blinkit") |
| Platform | Amazon Now Orders | CALCULATE([Total Orders], Orders[Platform] = "Amazon Now") |
| Platform | Blinkit Share of Orders % | DIVIDE([Blinkit Orders], CALCULATE([Total Orders], REMOVEFILTERS(Orders[Platform]))) |
| Ranking | Top 5 Products Sales | CALCULATE([Total Sales], TOPN(5, ALL(Product[Product Name]), [Total Sales])) |
| UI | Selected City | SELECTEDVALUE(DarkStore[City], "All Cities") |
| UI | Report Title | "Blinkit Operations – " & [Selected City] |
| UI | Delivery Time Colour | IF([Avg Delivery Time (mins)] <= 10, "#107C10", "#D13438") |
About this data: This table uses columns: Folder, Measure, DAX. This table uses columns: Order, Store, City, Status, Amount, Delivery mins. This table uses columns: Good KPI, Vanity metric. Values shown are the lesson examples already on this page (not a new dataset).
Format currency measures with the ₹ symbol (e.g. ₹ #,##0), time measures with one decimal place, and percentage measures with one decimal place.
Worked from eight fictional orders
The measures above are names until you divide real rows. These eight rows are fictional sample data. They are not Blinkit's figures and not Amazon Now's figures. Amount is the basket value. A blank delivery time means the order was cancelled before a rider closed it.
| Order | Store | City | Status | Amount | Delivery mins |
|---|---|---|---|---|---|
| B-01 | Kothrud | Pune | Delivered | ₹400 | 8 |
| B-02 | Kothrud | Pune | Delivered | ₹500 | 14 |
| B-03 | Kothrud | Pune | Cancelled | ₹300 | |
| B-04 | Baner | Pune | Delivered | ₹600 | 9 |
| B-05 | College Road | Nashik | Delivered | ₹300 | 7 |
| B-06 | College Road | Nashik | Delivered | ₹800 | 11 |
| B-07 | Gangapur Road | Nashik | Delivered | ₹400 | 10 |
| B-08 | Gangapur Road | Nashik | Cancelled | ₹200 |
Formulas in words, the same definitions as the measure table.
- Total Orders is the count of distinct order ids. There are 8.
- Delivered Orders are the rows with status Delivered. There are 6. Cancelled Orders are 2.
- Total Sales, as written in the table above, is the sum of Amount on every row, including cancelled. 400+500+300+600+300+800+400+200 = ₹3,500.
- AOV as written is Total Sales divided by Delivered Orders. 3,500 ÷ 6 = ₹583 (3,500 ÷ 6 = 583.33, nearest rupee ₹583).
- Cancellation rate is cancelled divided by all orders. 2 ÷ 8 = 25.0%.
- % under 10 min is delivered orders with minutes of 10 or less, divided by delivered orders. B-01 (8), B-04 (9), B-05 (7) and B-07 (10) qualify. B-02 is 14 and B-06 is 11. That is 4 ÷ 6 = 66.7%.
Read the trap before you put ₹583 on a card. Delivered baskets alone are ₹400+₹500+₹600+₹300+₹800+₹400 = ₹3,000. Divided by 6 delivered orders that is ₹500. The ₹83 gap is the cancelled ₹500 (₹300+₹200) sitting in Total Sales. If the city manager's question is "what did a delivered basket cost the customer", label the card ₹500 and filter Amount to Delivered. If you keep the measure exactly as in the table, label the card so nobody thinks cancelled baskets were delivered.
| Good KPI | Vanity metric | |
|---|---|---|
| From the same rows | Cancellation 25% and 66.7% under 10 min | ₹3,500 sales |
| Why | Two of eight orders never arrived, and two of the six that did arrive missed 10 minutes. | ₹3,500 counts B-03 and B-08. A manager who reports that number will say the week was bigger than the baskets customers received. |
Pune delivered sales are ₹1,500 on 3 orders (AOV ₹500) and Nashik delivered sales are ₹1,500 on 3 orders (AOV ₹500). AOV will not pick the store. Kothrud has the cancel of ₹300 and the 14-minute delivery. Nashik's miss is B-06 at 11 minutes and a ₹200 cancel at Gangapur.
What the manager does. The Pune manager (in this project, the Kothrud role) opens B-02 and B-03: was the slow order a missing SKU, and was the cancel a rider or a stockout. The Nashik manager does not relax because AOV matches Pune. B-06 took 11 minutes on an ₹800 basket. That is the Nashik conversation. Module 36 uses the same three KPIs on a store table for other industries.
Ravindra Bagale's Tip
A common mistake is writing every KPI from scratch instead of reusing base measures. Build Total Sales, Total Orders and Delivered Orders first, then build AOV, Cancellation Rate and YoY on top. Put all measures in a measure table with display folders. Don't worry – after doing it two or three times, it becomes a habit.
Ravindra Bagale's Tip – मराठी
एक common चूक म्हणजे base measures पुन्हा वापरण्याऐवजी प्रत्येक KPI शून्यापासून लिहिणं. आधी Total Sales, Total Orders आणि Delivered Orders बनवा, मग त्यांच्यावर AOV, Cancellation Rate आणि YoY बांधा. सगळे measures display folders असलेल्या measure table मध्ये ठेवा. घाबरू नका, दोन-तीन वेळा केलं की सवय होते.
Ravindra Bagale's Tip – हिंदी
एक common गलती है base measures दोबारा इस्तेमाल करने की जगह हर KPI शुरू से लिखना. पहले Total Sales, Total Orders और Delivered Orders बनाओ, फिर उन पर AOV, Cancellation Rate और YoY बनाओ. सारे measures को display folders वाली measure table में रखो. घबराओ मत, दो-तीन बार करने पर आदत हो जाती है.
Loading DAX practice tasks...
- Total Qty (Easy): Measure: Qty Sum = SUM of Qty.
- Rows per Store (Easy): Shown per Store StoreName. Measure: Row Count = number of Orders rows.
- Average delivery minutes per country (Easy): Shown per State. Measure: Avg DeliveryMins = AVERAGE of DeliveryMins.
- Highest delivery minutes per Platform (Easy): Shown per Platform. Measure: Max DeliveryMins = MAX of DeliveryMins.
- Qty for Blinkit only (Medium): Shown per City. Measure: Qty Blinkit = SUM of Qty where Platform is "Blinkit".
- Share of Qty (Medium): Shown per Store StoreName. Measure: Qty Share = SUM of Qty ÷ SUM of Qty for all of Store.
- How many store per Platform (Medium): Shown per Platform. Measure: Store Count = distinct count of ProductID in Orders.
- Rows with high delivery minutes (Medium): Shown per State. Measure: High DeliveryMins Rows = number of rows where DeliveryMins is more than 15.
- Average Qty per row (Medium): Shown per Store StoreName. Measure: Qty per Row = SUM of Qty ÷ number of rows.
- Rank by Qty (Hard): Shown per Store StoreName. Measure: Qty Rank = rank of [Total Qty] among all Store StoreName values.
- Top 3 only (Hard): Shown per Store StoreName. Measure: Top 3 Qty = [Total Qty] when the rank is 3 or better, else blank.
 Revision card
 Comparison card