28. End-to-End Project: Blinkit Quick-Commerce Dashboard
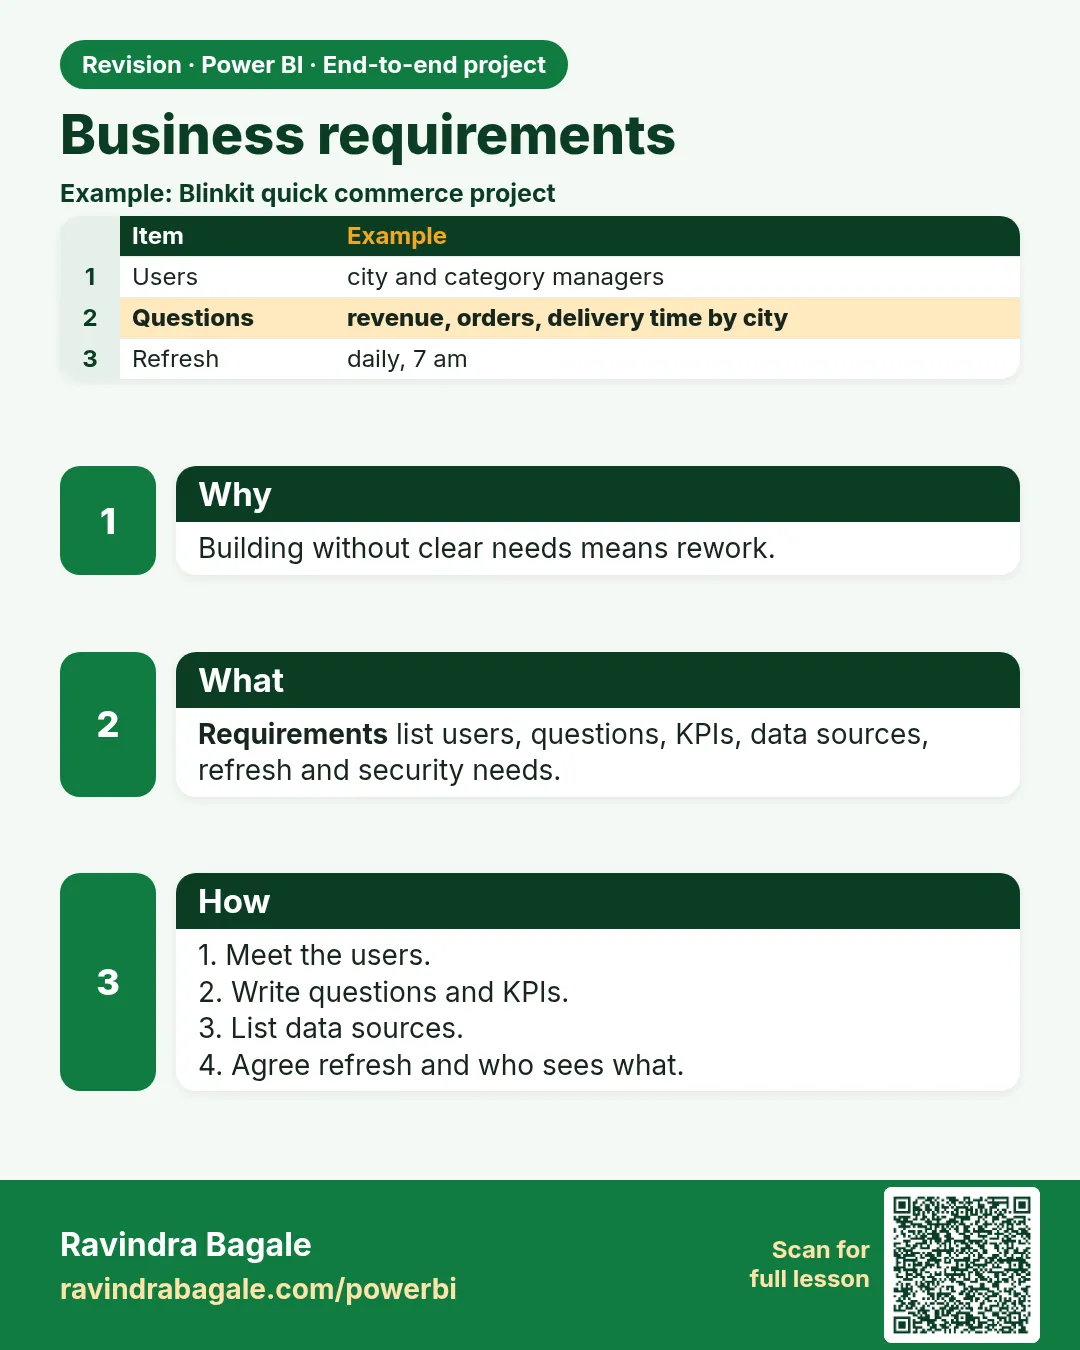
28.1 Business Requirements
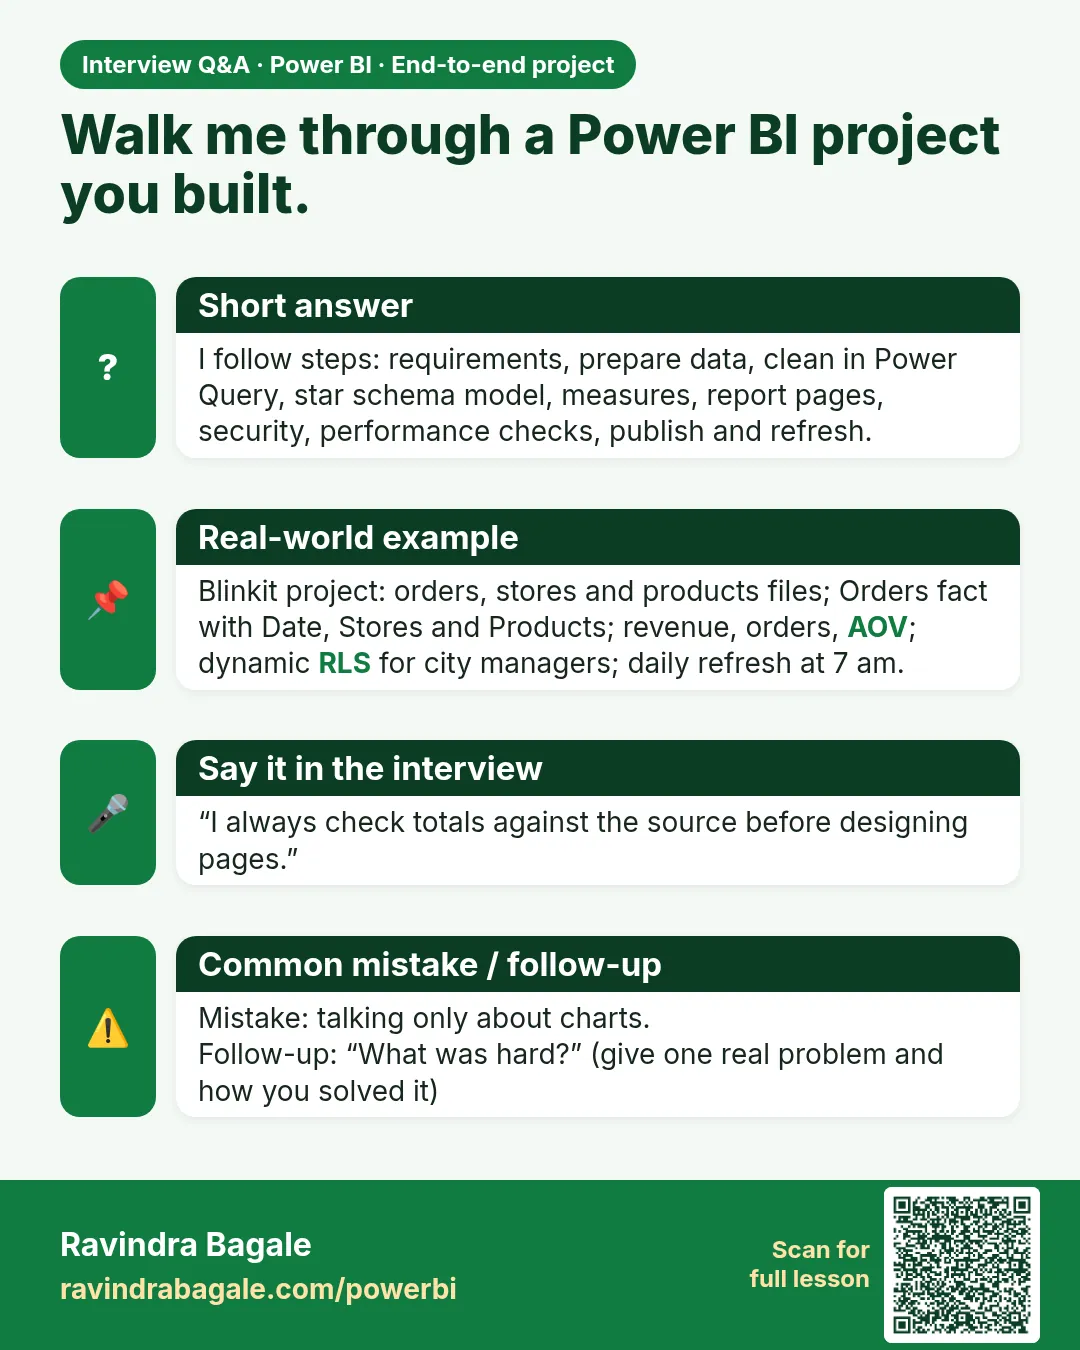
The (fictional) operations head wants to answer:
- How many orders did we receive, what were sales (₹) and AOV, and how do they compare with last year and last month?
- How fast are we delivering? What is the average delivery time and the % of orders delivered under 10 minutes, by city, dark store and hour of day?
- Where and when do cancellations happen (city, dark store, hour of day in IST)? Which payment modes are used?
- Which categories and products drive sales? How many customers come back (repeat customer %)?
- How does Blinkit compare with Amazon Now on orders, AOV and delivery speed?
- City managers must see only their own city. The report must update automatically every morning.
Ravindra Bagale's Tip
Friends, many students start building before the requirements are clear, then rebuild pages when the manager asks for something else. Write the KPI definitions and the page list first and get them agreed, even informally, before opening Power BI Desktop. Practise, and it will feel very easy.
Ravindra Bagale's Tip – मराठी
मित्रांनो, बरेच students requirements स्पष्ट होण्याआधीच बनवायला सुरुवात करतात, आणि manager ने दुसरंच काही मागितलं की pages पुन्हा बनवतात. Power BI Desktop उघडण्याआधी KPI च्या व्याख्या आणि pages ची list लिहून काढा आणि अनौपचारिकपणे का होईना, त्यावर सहमती घ्या. Practice करा, मग एकदम सोपं वाटेल.
Ravindra Bagale's Tip – हिंदी
दोस्तों, बहुत से students requirements साफ़ होने से पहले ही बनाना शुरू कर देते हैं, फिर manager के कुछ और माँगने पर pages दोबारा बनाते हैं. Power BI Desktop खोलने से पहले KPI की परिभाषाएँ और pages की list लिखो और उस पर सहमति ले लो, भले ही अनौपचारिक रूप से. Practice करो, फिर बहुत आसान लगेगा.
Why this report exists
The project is not "make a Blinkit-looking file for a portfolio". The fictional operations lead has a Monday, in IST, across six cities: Pune, Nashik, Nagpur, Kolhapur, Mumbai, and Sambhaji Nagar. Orders are already in. The question is what to do before the next peak. A page that cannot change that action is a screenshot. Interviewers can hear the difference. "I added a donut" is a tool list. "Rani calls Ravindra because Pune's 79% can hide a store, and Ravindra opens Kothrud" is a project.
All of the numbers in this chapter are fictional sample data. They are not Blinkit's results and not Amazon Now's results. When two pictures disagree, read the caption. The six-store week from section 23.7 is the source for pages 1 and 2 below. Pages 3 and 4 use smaller slices that are labelled as separate files, so you do not add them into 50 and pretend it balances.
What the business gets if you finish the project honestly:
- One definition of an order, of a delivered order, and of "under 10 minutes", used by every city.
- A morning page that refuses to celebrate total orders while the promise is missed.
- A store page that names who is late, with a count, not only a red cell.
- RLS so Shraddha does not see Pune, and Ravindra does not see Nashik, tested with View as before anyone is impressed.
- A refresh at 7:00 IST so Monday's decision is not Thursday's file.
What it does not get: a forecast, a real company's performance, or a ribbon full of charts. The layout pictures later in this module are layouts. They are not the product's menus.
Each question is a decision, or it does not get a page
The six questions above are not a backlog. Each one is allowed to change one kind of action. If you cannot name the action, do not build the visual yet.
- Orders, sales, AOV, last year, last month. This decides whether the week is a demand story. Sales up and the promise down means you do not "scale what is working". You fix service. AOV matching across cities, as in the ₹400 week, decides that money will not pick the store. Last year matters only after you trust this year. A wrong growth card is worse than no growth card.
- Speed by city, store, and hour. This decides where a rider hour goes today. It is Shraddha's and Ravindra's page. The hour stops a daily average from blaming a store for a single peak.
- Cancellations, and payment mode. This decides whether the failure happened before a rider closed the order. A cancel must not hide inside the speed rate. Payment mode is a cause you check after the store is named. It is not the title of Monday.
- Category, product, repeat customers. This decides a reorder or a second-order offer. It does not decide a rider. If it leads Monday, Kothrud waits.
- Blinkit beside Amazon Now. This decides which promise is breaking in which city. It is a platform meeting. It becomes a Monday meeting only when the city page is already bad and you still do not know which platform made it bad.
- City managers see only their city, and the file refreshes every morning. This decides whether the name on the page is a name they are allowed to act on, and whether the name is from this morning. A perfect report on stale data is a confident mistake.
What stays off page 1
Page 1 is Rani's first ten seconds. It is not the project. These stay off it even if a stakeholder asks "can we also see":
- Repeat customer %, active customers, top products, the cohort. They answer question 4. Page 3.
- Rider names, store speed rank, the hour curve, the dark-store matrix. They answer question 2. Page 2. The matrix is the point of page 2, and it is too much for the first screen.
- Blinkit share, Amazon Now AOV, the platform matrix. Question 5. Page 4.
- Payment-mode detail, once you know it is not the cause. A donut of four payment types does not name a store. If page 1 is crowded, the donut leaves before the promise card does.
The build list under section 28.6 still shows a full executive page, including a category bar and a donut, because you should know how to build them. The Monday read is stricter than the build list. Lead with the promise, the cancel rate, and the city comparison. Treat total orders as context. Do not add page 2, 3, or 4 KPIs on top "so the boss sees everything". The boss then sees nothing.
Total orders is the vanity metric next to % under 10 minutes, same lesson as section 23.8. In the six-store week the company card says 50 orders. The promise says 32 of 40 delivered orders inside 10 minutes, 80%. Both can be true. Only one tells Rani to keep the call going. Nashik at 17 of 21 (about 81%) and Pune at 15 of 19 (about 79%) are close enough to fool a city bar. The late stores are inside those bars. Page 1's job is to refuse the celebration and send her to page 2, not to pretend it already found Kothrud.
 Revision card
 Interview card