28. End-to-End Project: Blinkit Quick-Commerce Dashboard
28.4 Step 3 – Build the Data Model
Project data model (star schema) with example — in 30 seconds
What: The project model is a star: one Orders fact table in the middle, with DarkStore, Product, Customer and Date around it.
Why: Every measure in the project depends on these relationships. A wrong direction or a missing date table breaks the cards.
Tiny example: Orders has Store ID, Product ID, Customer ID and Order Date. Each one links to one dimension table.
Project data model (star schema) with example — 30 सेकंदात
काय: Project चं model एक star आहे: मधोमध एक Orders fact table, आणि भोवती DarkStore, Product, Customer आणि Date.
का: Project मधला प्रत्येक measure या relationships वर अवलंबून असतो. चुकीची direction किंवा date table नसणं cards बिघडवतं.
छोटं उदाहरण: Orders मध्ये Store ID, Product ID, Customer ID आणि Order Date आहेत. प्रत्येक एका dimension table ला जोडतो.
Project data model (star schema) with example — 30 सेकंड में
क्या: Project का model एक star है: बीच में एक Orders fact table, और चारों ओर DarkStore, Product, Customer और Date.
क्यों: Project का हर measure इन relationships पर निर्भर है. ग़लत direction या date table का न होना cards बिगाड़ देता है.
छोटा उदाहरण: Orders में Store ID, Product ID, Customer ID और Order Date हैं. हर एक, एक dimension table से जुड़ता है.
First look at the data (before → after):
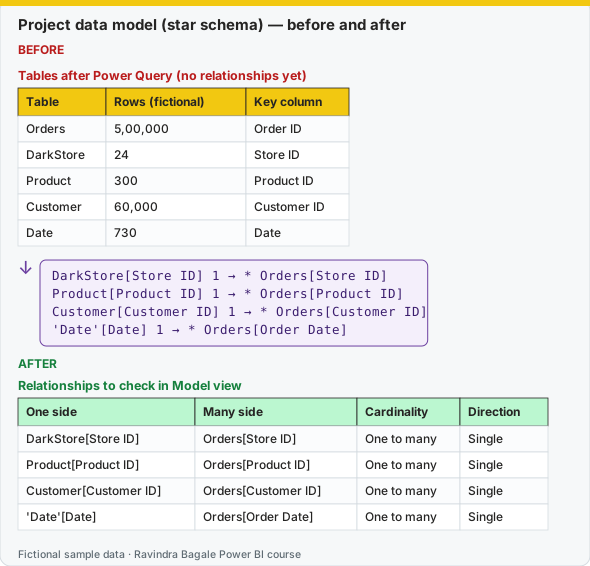
Same before / after tables as text
Before — Tables after Power Query (no relationships yet)
| Table | Rows (fictional) | Key column |
|---|---|---|
| Orders | 5,00,000 | Order ID |
| DarkStore | 24 | Store ID |
| Product | 300 | Product ID |
| Customer | 60,000 | Customer ID |
| Date | 730 | Date |
About this data: This table uses columns: Table, Rows (fictional), Key column. This table uses columns: One side, Many side, Cardinality, Direction. Values shown are the lesson examples already on this page (not a new dataset).
Formula / click path
DarkStore[Store ID]     1 → * Orders[Store ID]
Product[Product ID]     1 → * Orders[Product ID]
Customer[Customer ID]   1 → * Orders[Customer ID]
'Date'[Date]            1 → * Orders[Order Date]
After — Relationships to check in Model view
| One side | Many side | Cardinality | Direction |
|---|---|---|---|
| DarkStore[Store ID] | Orders[Store ID] | One to many | Single |
| Product[Product ID] | Orders[Product ID] | One to many | Single |
| Customer[Customer ID] | Orders[Customer ID] | One to many | Single |
| 'Date'[Date] | Orders[Order Date] | One to many | Single |
Do it step by step:
- Open Model view.
- Drag DarkStore[Store ID] onto Orders[Store ID]. Check: one to many, single direction.
- Do the same for Product ID and Customer ID.
- Drag Date[Date] onto Orders[Order Date].
- Select the Date table. Click Table tools › Mark as date table and pick the Date column.
- Hide the key columns on the Orders side, so users pick fields from the dimension tables.
एक-एक step करून बघा:
- Model view उघडा.
- DarkStore[Store ID] ओढून Orders[Store ID] वर टाका. तपासा: one to many, single direction.
- Product ID आणि Customer ID साठी पण तसंच करा.
- Date[Date] ओढून Orders[Order Date] वर टाका.
- Date table निवडा. Table tools › Mark as date table वर click करा आणि Date column निवडा.
- Orders बाजूचे key columns hide करा, म्हणजे users dimension tables मधून fields निवडतील.
एक-एक step करके देखिए:
- Model view खोलिए.
- DarkStore[Store ID] को खींचकर Orders[Store ID] पर डालिए. जाँचिए: one to many, single direction.
- Product ID और Customer ID के लिए भी ऐसा ही कीजिए.
- Date[Date] को खींचकर Orders[Order Date] पर डालिए.
- Date table चुनिए. Table tools › Mark as date table पर click कीजिए और Date column चुनिए.
- Orders की तरफ़ के key columns hide कीजिए, ताकि users dimension tables से fields चुनें.
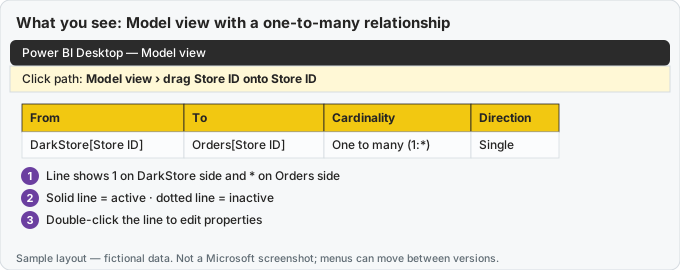
What you should see on screen after the steps (sample layout — fictional data, not a Microsoft screenshot).
Checkpoint C
Manage relationships: Orders many-to-one to each dimension. Mark Date as date table. Hide foreign keys on the fact if you teach star schema hygiene.
- Create the Date table with DAX (Module 11) covering the years in the data, with Year, Quarter, Month Number, Month Name, Year Month, Fiscal Year, Day Name, Is Weekend, and the Festival / Is Festival Day columns from a small Festivals table.
- Mark as date table; sort Month Name by Month Number; turn off Auto date/time.
- Create relationships (Model view), all one-to-many and single direction:
Product[Product ID]1:*Orders[Product ID]Customer[Customer ID]1:*Orders[Customer ID]DarkStore[Store ID]1:*Orders[Store ID]DeliveryPartner[Delivery Partner ID]1:*Orders[Delivery Partner ID]Date[Date]1:*Orders[Order Date](active)Date[Date]1:*Orders[Delivered Date](inactive)
- Hide all key columns in
Orders. - Create hierarchies: Date (Year › Quarter › Month Name › Date), Product (Category › Sub Category › Product Name), Location (State › City › Area › Store Name). Set data categories for City, State and Country.
- Create a
_Measurestable with display folders Sales, Orders, Delivery, Customers, Time, Platform, UI.
Model tayar jhala? Shabbas! Aata measures lihuya.
Ravindra Bagale's Tip
Friends, many students forget to mark the Date table or leave Auto date/time on, and time intelligence later gives strange results. Build the star schema, mark the Date table, set single-direction relationships and hide the keys before you write any measure. This matters for both exams and interviews.
Ravindra Bagale's Tip – मराठी
मित्रांनो, बरेच students Date table mark करायला विसरतात किंवा Auto date/time चालू ठेवतात, आणि नंतर time intelligence विचित्र results देतं. कोणताही measure लिहिण्याआधी star schema बनवा, Date table mark करा, single-direction relationships set करा आणि keys hide करा. हे exam आणि interview दोन्हीसाठी important आहे.
Ravindra Bagale's Tip – हिंदी
दोस्तों, बहुत से students Date table mark करना भूल जाते हैं या Auto date/time चालू छोड़ देते हैं, और बाद में time intelligence अजीब results देता है. कोई भी measure लिखने से पहले star schema बनाओ, Date table mark करो, single-direction relationships set करो और keys hide करो. यह exam और interview दोनों के लिए ज़रूरी है.
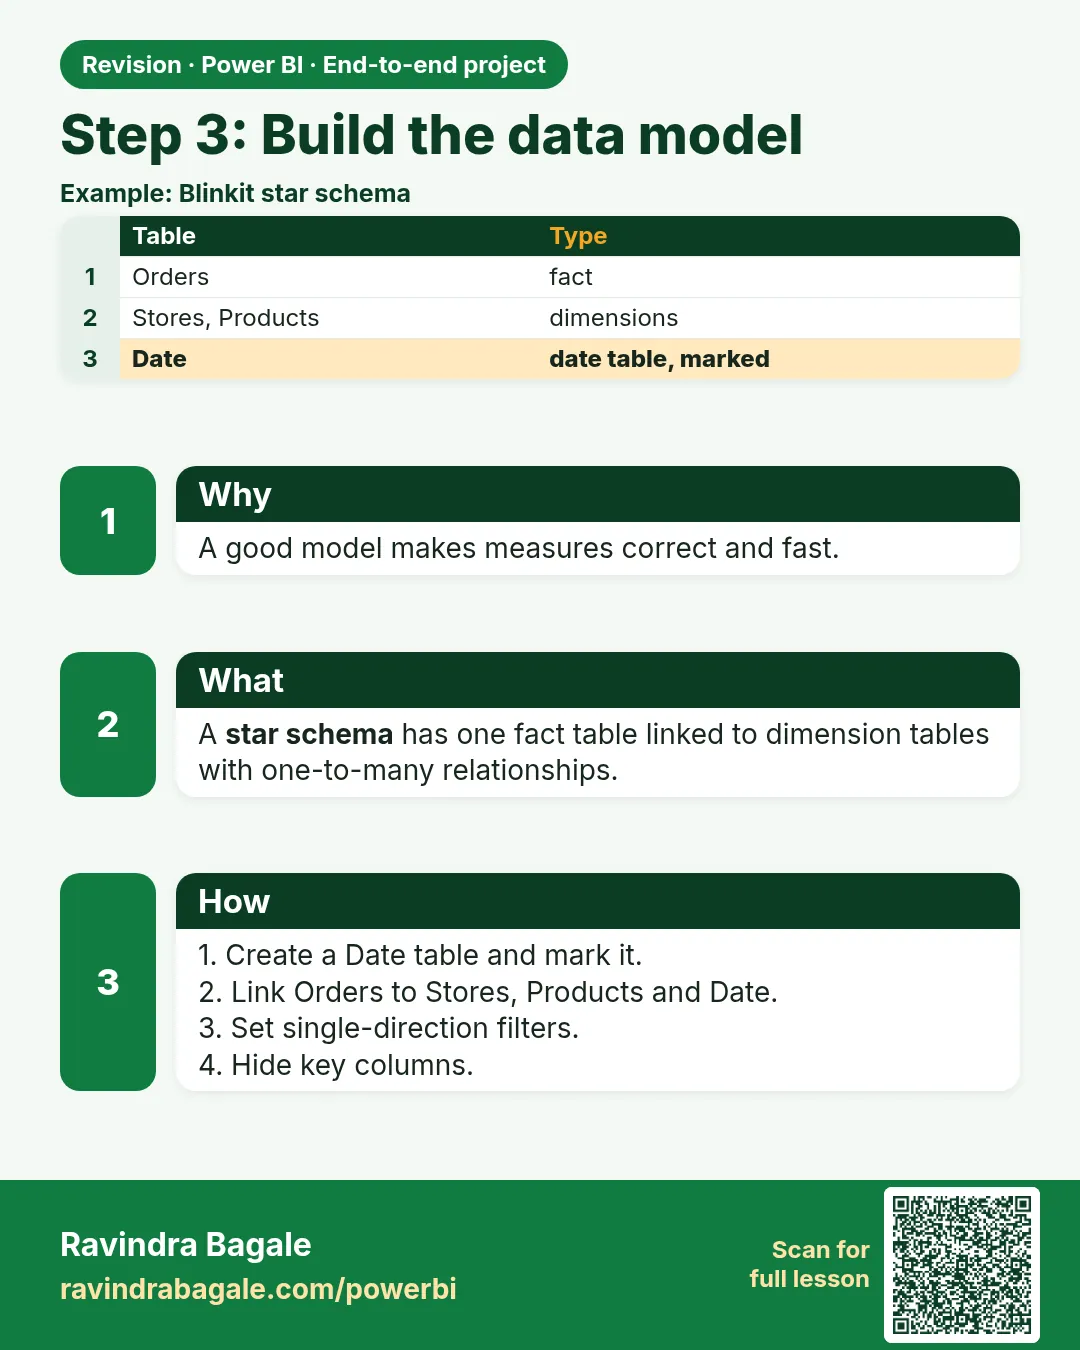 Revision card