28. End-to-End Project: Blinkit Quick-Commerce Dashboard
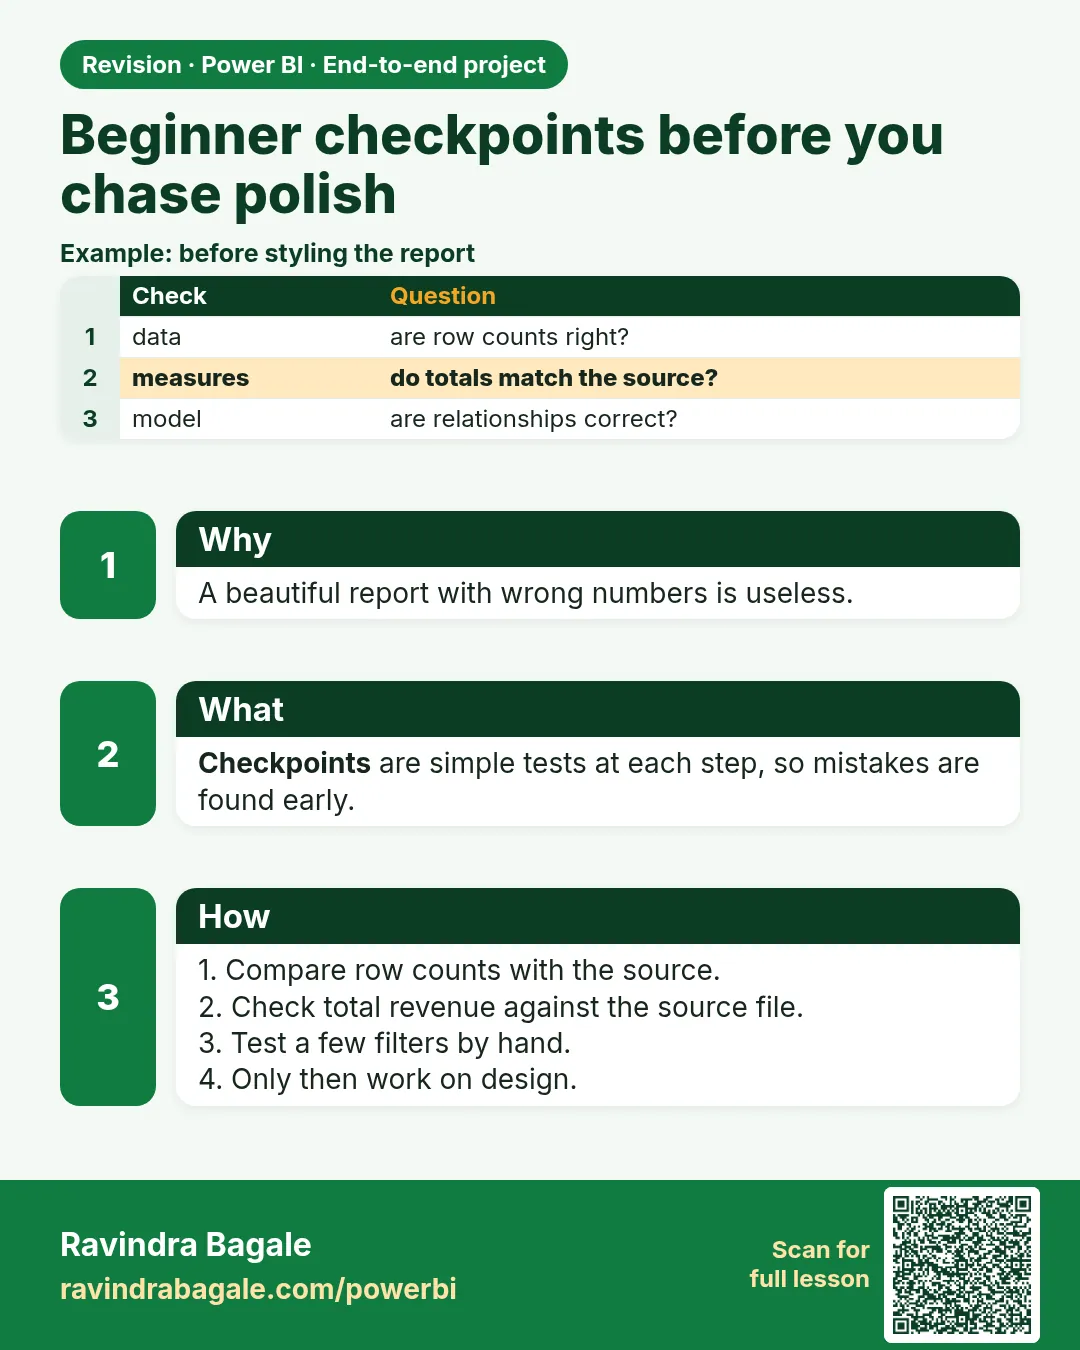
28.0 Beginner checkpoints (before you chase polish)
Use these gates so the project stays teachable. All numbers are fictional sample data.
| Gate | You can show | If stuck, revisit |
|---|---|---|
| A · Files | Folder of monthly Blinkit CSVs + Amazon Now file open in Explorer | 28.2, Module 9 |
| B · Append | Orders row count = Blinkit rows + Amazon rows; Platform column filled | 7.21, practice CSVs |
| C · Model | Orders ★ DarkStore / Product / Customer / Date; one-to-many | 28.4, ch11–12 |
| D · Base measures | Total Sales, Total Orders, Delivered Orders match a 10-row hand sample | 13.5, 28.5 |
| E · Promise KPI | % Under 10 Mins on a card equals hand fraction for the week | 13.8, 23.7 week |
| F · Page 1 | Title states the decision; total orders is not the hero | 28.1, 28.6 |
| G · RLS | View as city manager hides other cities | 28.7, ch26 |
| H · Refresh | Scheduled 7:00 IST plan written (even if Service comes later) | 28.9 |
Practise independently — Gate D sample
Take eight fictional delivered orders from section 28.5. Write Total Sales and % Under 10 on paper, then match the measures.
Hints
- Cancelled orders: Amount 0; do not count them in the under-10 denominator if the KPI is among delivered only.
- Use DISTINCTCOUNT on Order ID when grain is order line.
Fix common mistakes (project)
| Wrong result | Reason | Correction |
|---|---|---|
| City slicer blank | Relationship missing or City only on fact with broken key | Fix model; City from DarkStore |
| % Under 10 changes when Category slicer moves oddly | Delivery time repeated on lines — wrong grain | One value per Order ID pattern from 13.5 |
| Manager sees all cities | RLS not tested | Modeling › View as |
Think like a professional
Portfolio story: name the Monday decision (e.g. Kothrud / Gangapur late), not the visual count. Keep page 1 cruelly short.
 Revision card