24.9 Apps and Sharing (Brief)
Quick answer: the short, self-contained version of this lesson is the guide Power BI Apps for Sharing Reports.
For many users, publish reports and dashboards together as an app:
- In the workspace, click Create app.
- Setup: add a name, description, logo and colour.
- Content: add the Operations report, the Maharashtra Cockpit dashboard and navigation sections.
- Audience: for example, city managers see everything, and a Finance audience sees only the finance report.
- Click Publish app.
After you change content, click Update app. Module 25.5 compares all sharing methods (share links, Teams, embed, export).
Practice task
Friends, publish the four-page QC report. Build Maharashtra Cockpit with 6 pinned tiles (including a live page and a Q&A tile), add an alert for Avg Delivery Time > 15 minutes, create a mobile layout for the Executive page and the dashboard, and add both to an app with two audiences.
Ravindra Bagale's Tip
Friends, many students share reports one by one with dozens of colleagues and lose track of who has access. For wider audiences, publish an app from the workspace and manage audiences there. Share individual items only for small, temporary needs. Clear?
Ravindra Bagale's Tip – मराठी
मित्रांनो, बरेच students डझनभर सहकाऱ्यांना एक-एक करून reports share करतात आणि कोणाकडे access आहे याचा हिशोब हरवतात. मोठ्या audience साठी workspace मधून app publish करा आणि audiences तिथेच manage करा. Items एक-एक करून फक्त छोट्या, तात्पुरत्या गरजांसाठी share करा. समजलं का?
Ravindra Bagale's Tip – हिंदी
दोस्तों, बहुत से students दर्जनों साथियों के साथ reports एक-एक करके share करते हैं और भूल जाते हैं कि किसके पास access है. बड़ी audience के लिए workspace से app publish करो और audiences वहीं manage करो. अलग-अलग items सिर्फ़ छोटी, अस्थायी ज़रूरतों के लिए share करो. समझ आया?
Fix common mistakes
| Wrong result | Reason | Correction |
|---|---|---|
| Sharing one by one with 40 people | No app | Publish an app with audiences |
| Readers see unfinished pages | Workspace access given | Use app |
About this data: This table uses columns: Wrong result, Reason, Correction. Values shown are the lesson examples already on this page (not a new dataset).
Practise independently
Practice task
Choose sharing for 40 store managers.
Practice file (fictional): visuals_orders_apr_may_2026.csv
Hints
- Read-only, large audience.
Solution
Workspace app with a Store managers audience.
Thodkyaat sangaycha tar (quick recap)
A report is multi-page and interactive; a dashboard is a single page of tiles. Build the mobile layout separately, and use an app for a big audience. Now let us move on to the Power BI Service. Publishing a report does not mean the dashboard is ready. Rani taps on the cockpit. Shraddha drills down to the store in the report.
Report multi-page आणि interactive, dashboard single page tiles; mobile layout वेगळा बनवा; आणि मोठ्या audience साठी app वापरा. आता पुढे जाऊया Power BI Service कडे. Report publish केला म्हणजे dashboard तयार झाला असं नाही. Rani cockpit वर tap करते. Shraddha report मध्ये store पर्यंत drill करते.
Report multi-page और interactive है, dashboard single page tiles; mobile layout अलग बनाइए; और बड़ी audience के लिए app इस्तेमाल कीजिए. अब आगे बढ़ते हैं Power BI Service की ओर. Report publish करने का मतलब dashboard तैयार होना नहीं है. Rani cockpit पर tap करती है. Shraddha report में store तक drill करती है.
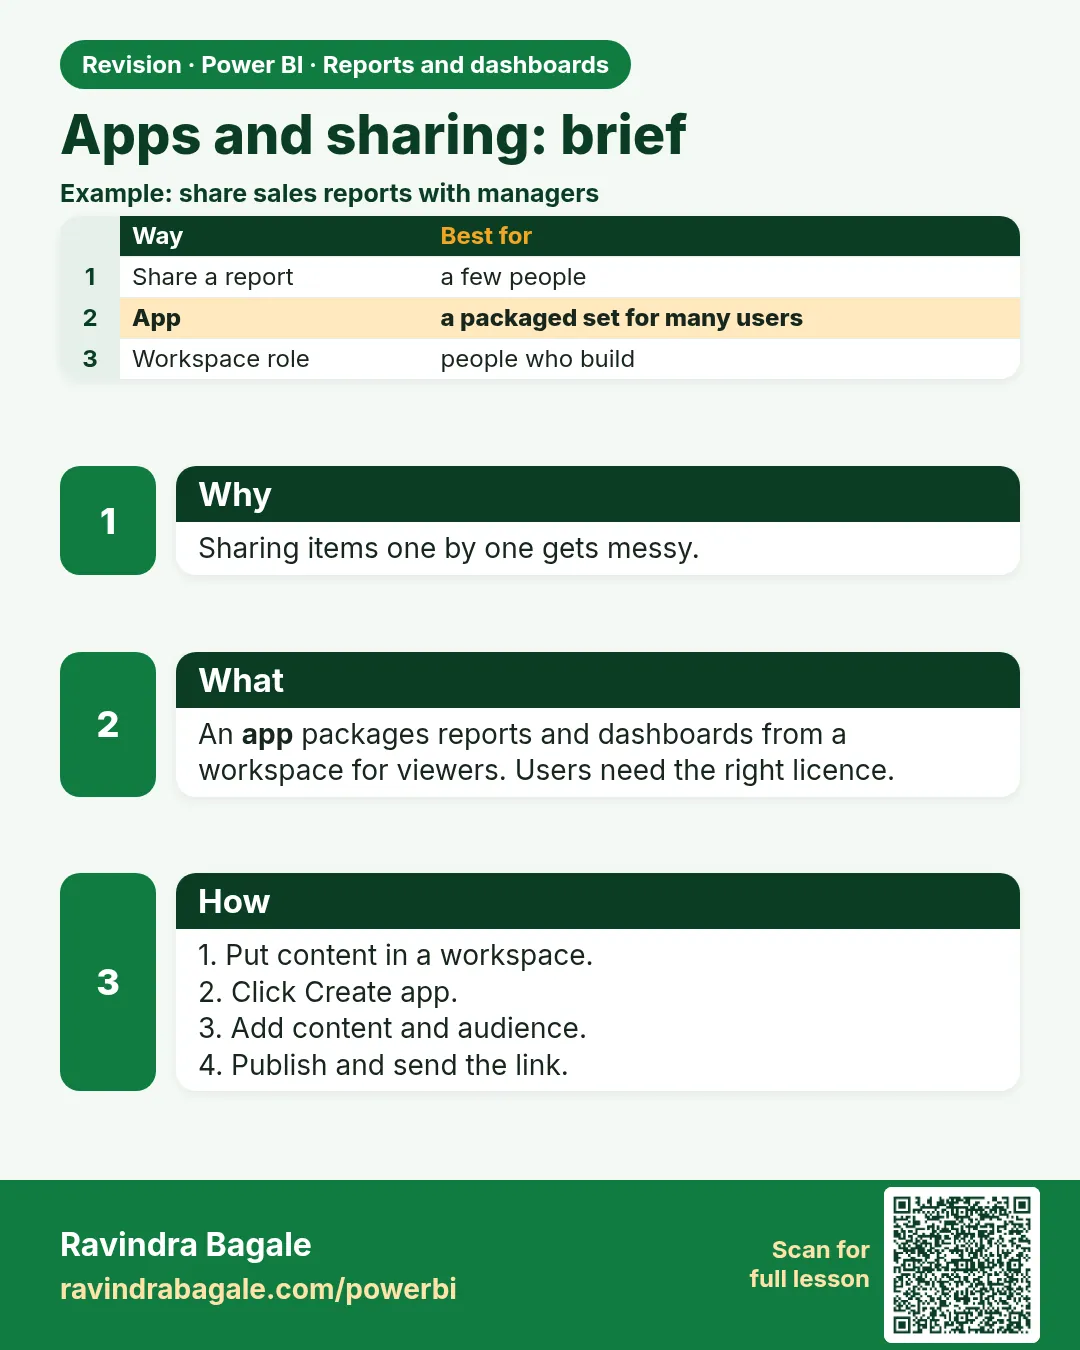 Revision card
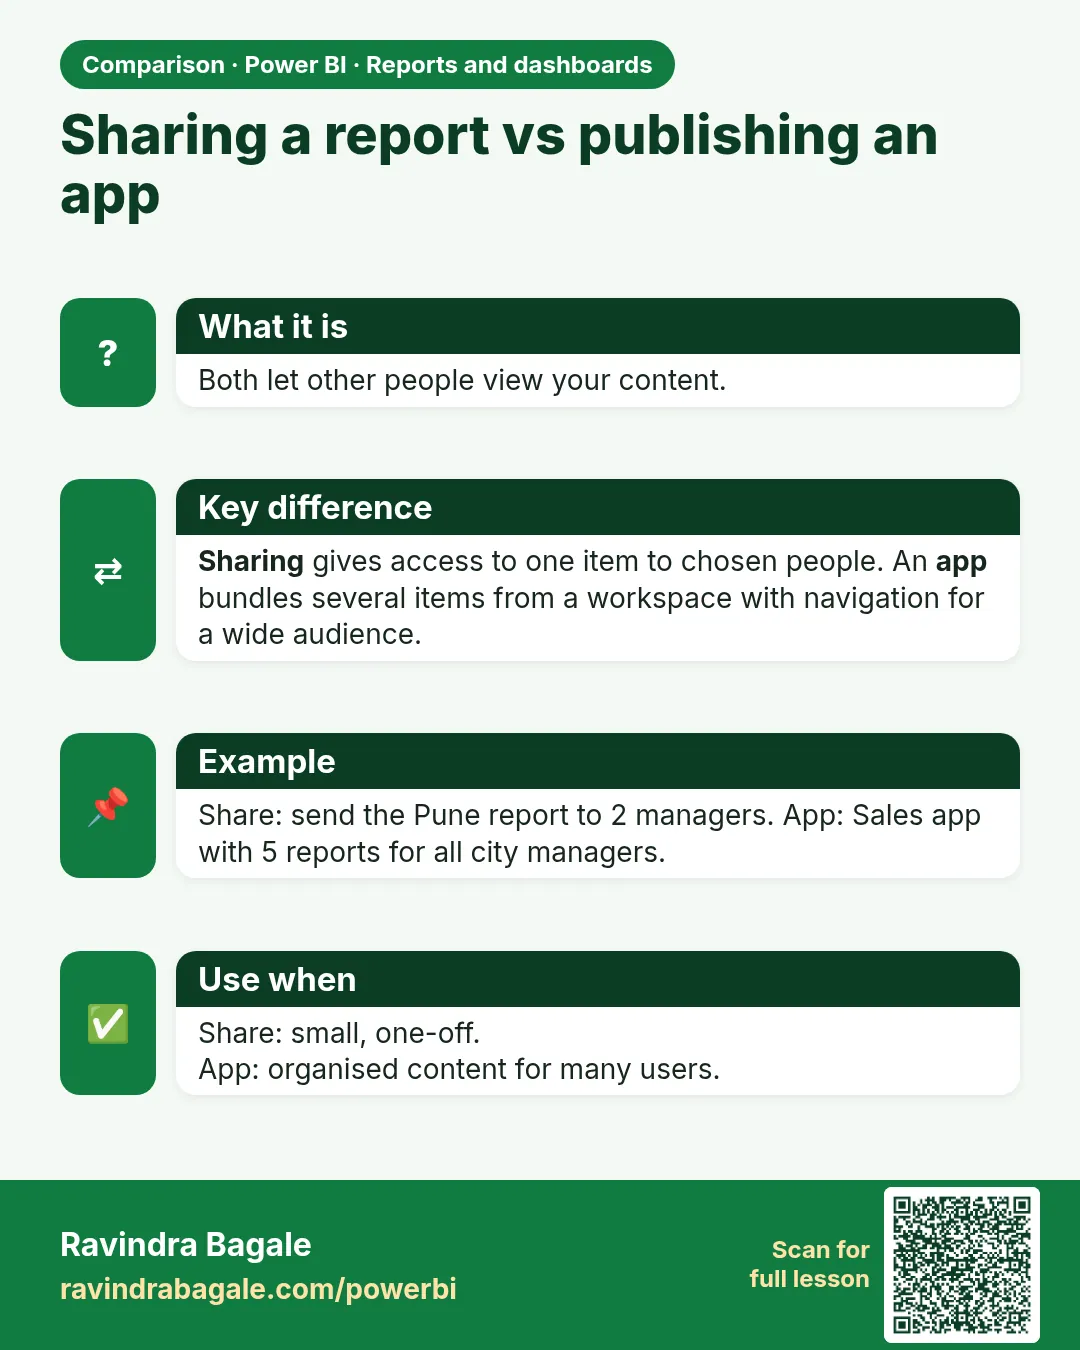 Comparison card