24.4 Dashboards in the Power BI Service
Quick answer: the short, self-contained version of this lesson is the guide Power BI Dashboard vs Report.
Steps in the Power BI Service – build Rani's Maharashtra Cockpit
- Publish the report (Home › Publish in Desktop) to the workspace QC – Maharashtra.
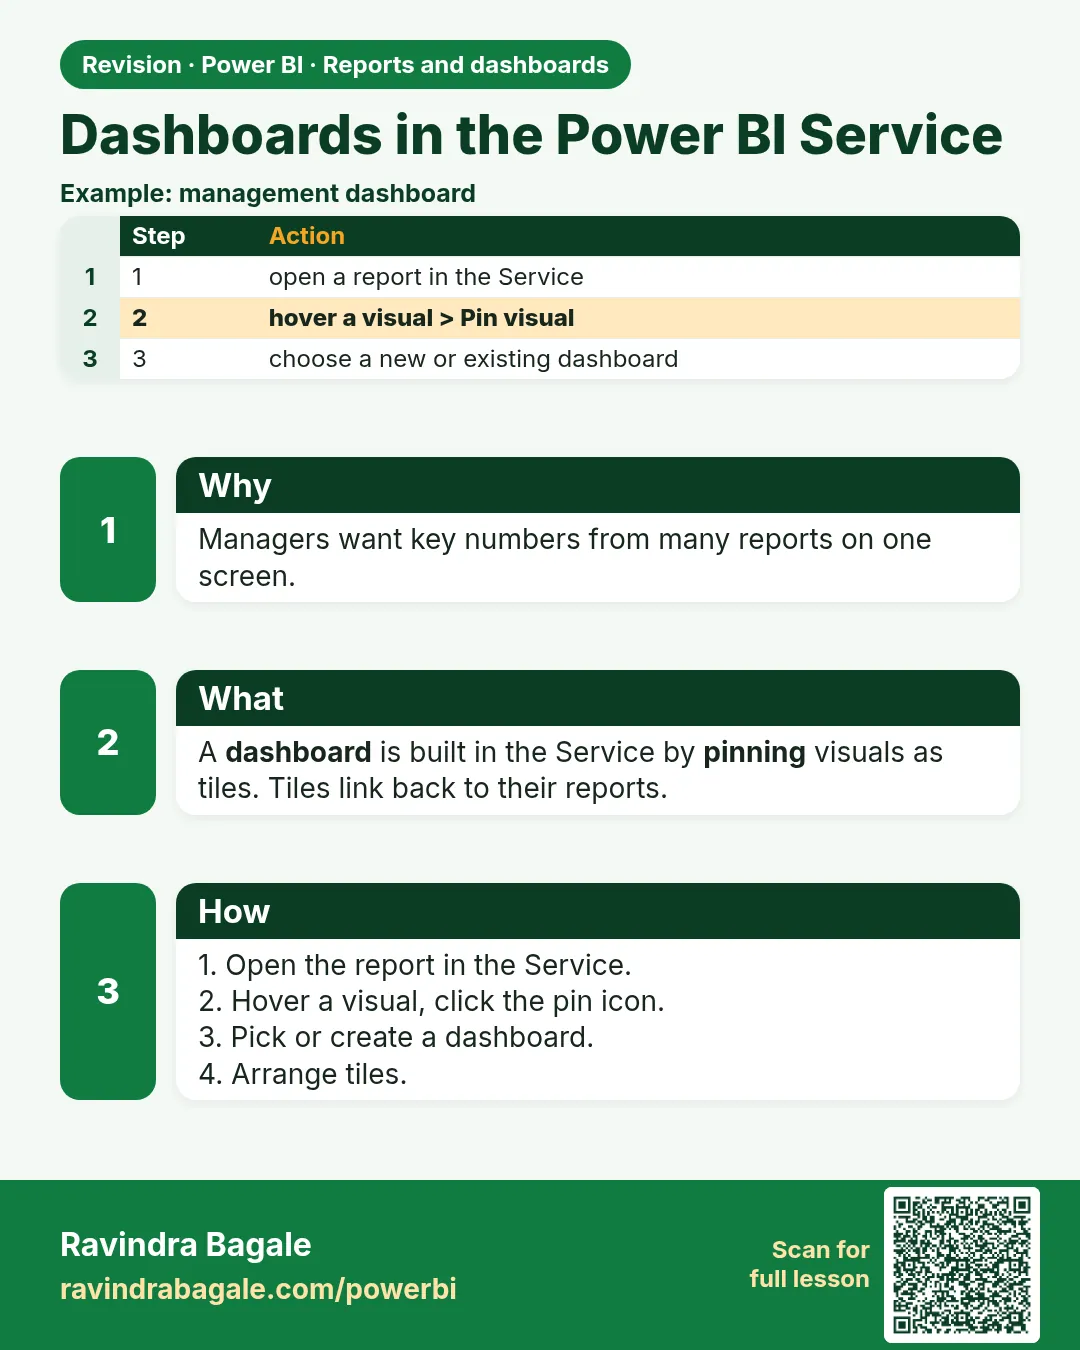
- In the Service, open the report. Hover over the Total Orders card › click the Pin visual (pin) icon.
- Choose New dashboard › name
Maharashtra Cockpit› Pin. For later visuals, choose Existing dashboard. - Pin more visuals: AOV, Avg Delivery Time, % Under 10 Mins, Orders by City, daily trend.
- Pin a live page: in the report, … (More options) › Pin to a dashboard (the page tile stays interactive, with slicers).
- Q&A tile: open the dashboard › type in Ask a question about your data (e.g. "average delivery time by city as bar chart") › click Pin visual in the Q&A window.
- Add a tile: dashboard Edit › Add a tile › Web content, Image, Text box, Video, Custom streaming data. For example, a text tile "Fictional data – training only".
- Arrange: drag tiles, and resize from the bottom-right corner.
Tile details: hover over a tile › … › Edit details › Title, Subtitle, Display last refresh time, Set custom link (open another report page or a URL instead of the source). Other tile menu items include View insights, Pin tile (to another dashboard), Delete tile and Manage alerts (for card/KPI/gauge).
Dashboard settings and theme: Edit › Dashboard theme (Light, Dark, Color-blind friendly, Custom). In the dashboard Settings you can turn Q&A, tile flow and comments on or off.
Pinned tiles keep their filters
A pinned visual keeps the filters/slicer state it had when it was pinned. If you pinned "Orders by City" while Platform = Blinkit, the tile shows Blinkit only (check the tile's subtitle). Pin from the default state, or re-pin after changes.
Ravindra Bagale's Tip
Friends, many students expect clicking a dashboard tile to filter the other tiles, as in a report. It doesn't: clicking a tile opens the underlying report or page. If users need slicers and cross-filtering, send them to the report, and use the dashboard as a summary. This matters for both exams and interviews.
Ravindra Bagale's Tip – मराठी
मित्रांनो, बऱ्याच students ना वाटतं dashboard tile वर click केलं की report सारखे इतर tiles filter होतील. तसं होत नाही: tile वर click केलं की त्यामागचा report किंवा page उघडतो. Users ना slicers आणि cross-filtering लागत असेल तर त्यांना report कडे पाठवा, आणि dashboard summary म्हणून वापरा. हे exam आणि interview दोन्हीसाठी important आहे.
Ravindra Bagale's Tip – हिंदी
दोस्तों, बहुत से students उम्मीद करते हैं कि dashboard tile पर click करने से report की तरह बाकी tiles filter होंगी. ऐसा नहीं होता: tile पर click करने से उसके पीछे की report या page खुलता है. Users को slicers और cross-filtering चाहिए तो उन्हें report पर भेजो, और dashboard को summary की तरह इस्तेमाल करो. यह exam और interview दोनों के लिए ज़रूरी है.
Before you pin, decide what Rani is allowed to see without the report. In this fictional week the honest set is % under 10 minutes (80%, 32 of 40), cancellation (10%, 5 of 50), AOV (₹400), and the city rates (Pune about 79%, Nashik about 81%). Total orders (50) may be pinned only with a subtitle that says context. If the first tile is 50, you have built a cockpit that cannot see Gangapur or Kothrud, and you have trained the boss to feel good.
Pinning is a second editorial pass. The report can hold the store matrix. The dashboard should not be a photograph of every visual you were proud of. Six tiles is already a lot on a phone. A live page is for the person who truly needs slicers in the cockpit. It is not a way to avoid choosing.
When you demo the click, say the sentence: "This opens the report. It does not filter the tile next to it." The room relaxes, and nobody files a bug against the product for working as designed. If the room needed filtering, you sent them to the wrong object. Send the link to the report page, and keep the dashboard as the alarm and the summary.
Fix common mistakes
| Wrong result | Reason | Correction |
|---|---|---|
| Clicking tile does not filter others | Dashboards don't cross-filter | Clicking opens the report |
| Tile shows old value | Cache | Refresh dashboard tiles |
About this data: This table uses columns: Wrong result, Reason, Correction. Values shown are the lesson examples already on this page (not a new dataset).
Practise independently
Practice task
Pin the Total Sales card and the City chart to a new dashboard.
Practice file (fictional): visuals_orders_apr_may_2026.csv
Hints
- Pin icon on hover.
Solution
Dashboard with ₹2,100 tile and City chart tile (Pune 850, Nashik 800, Kolhapur 450).
 Revision card