22.3 Measure Filters (Visual Level)
Start with a problem
Raja wants the City chart to show only cities with sales above ₹500.
Explain simply
A measure filter (visual level only) keeps items where a measure meets a condition, evaluated per item.
Show the data
| City | Total Sales (₹) |
|---|---|
| Pune | 850 |
| Nashik | 800 |
| Kolhapur | 450 |
| Total | 2,100 |
About this data: This table uses columns: City, Total Sales (₹). This table uses columns: City, Total Sales, Shown?. This table uses columns: Wrong result, Reason, Correction. Values shown are the lesson examples already on this page (not a new dataset).
Fictional sample data. Practice file: visuals_orders_apr_may_2026.csv (source: src/practice/).
Demonstrate
- Select the City chart.
- Drag
Total Salesinto Filters on this visual. - Show items when the value is greater than 500 › Apply filter.
Show the result
Your result should look like this (fictional sample):
| City | Total Sales | Shown? |
|---|---|---|
| Pune | 850 | Yes |
| Nashik | 800 | Yes |
| Kolhapur | 450 | No |
Explain what happened
Power BI evaluates Total Sales for each city and hides those failing the condition.
Explore further
- Measure filters exist only at visual level, because the measure needs the visual's items.
Detailed reference for this lesson:
At the visual level you can filter by a measure, for example show only stores where Total Orders is greater than 500. Drag the measure into Filters on this visual › choose Show items when the value is greater than 500 › Apply filter. Measure filters are evaluated per item of the visual, after other filters.
Ravindra Bagale's Tip
Friends, many students try to use a measure in the page-level filter well and can't. Measure filters work only at the visual level. If many visuals need the same condition, consider a calculated column or put the condition inside the measures. Don't worry – after doing it two or three times, it becomes a habit.
Ravindra Bagale's Tip – मराठी
मित्रांनो, बरेच students page-level filter well मध्ये measure वापरायचा प्रयत्न करतात आणि ते जमत नाही. Measure filters फक्त visual level वरच चालतात. अनेक visuals ना तीच condition लागत असेल तर calculated column चा विचार करा किंवा condition measures मध्येच टाका. घाबरू नका, दोन-तीन वेळा केलं की सवय होते.
Ravindra Bagale's Tip – हिंदी
दोस्तों, बहुत से students page-level filter well में measure इस्तेमाल करने की कोशिश करते हैं और नहीं कर पाते. Measure filters सिर्फ़ visual level पर काम करते हैं. कई visuals को एक ही condition चाहिए तो calculated column पर विचार करो या condition को measures के अंदर ही डालो. घबराओ मत, दो-तीन बार करने पर आदत हो जाती है.
Fix common mistakes
| Wrong result | Reason | Correction |
|---|---|---|
| Cannot add the measure at page level | Measures filter per item | Use visual level |
| Total row still 2,100? | Total recalculated on visible items | Check: it becomes ₹1,650 |
| Filter breaks when slicer changes | Expected – re-evaluated per filter | Explain to users |
Practise independently
Practice task
Change the condition to ≥ 450. Which cities show?
Hints
- Kolhapur is exactly 450.
Solution
All three.
Think like a professional
Measure filters are handy but hidden. Mention them in the visual title (cities above ₹500).
Loading DAX practice tasks...
- Only big campaigns (Medium): Shown per Campaigns Name. Measure: Big Clicks = [Total Clicks] when it is more than 15000, else blank.
- Conversion Rate (Medium): Shown per Campaigns Name. Measure: Conversion Rate = SUM of Conversions ÷ SUM of Clicks.
- Conversion Rate against target (Hard): Shown per Campaigns Name. Measure: Conversion Rate Status = "On target" when Conversion Rate is >= 0.06, else "Check".
- Clicks for Search only (Medium): Shown per City. Measure: Clicks Search = SUM of Clicks where Channel is "Search".
- Rows with high spend (Medium): Shown per Country. Measure: High Spend Rows = number of rows where Spend is more than 40000.
- Rows per Campaign (Easy): Shown per Campaigns Name. Measure: Row Count = number of AdStats rows.
- Total Conversions per Channel (Easy): Shown per Channel. Measure: Total Conversions = SUM of Conversions.
- Average spend per country (Easy): Shown per Country. Measure: Avg Spend = AVERAGE of Spend.
- Conversion Rate for Search (Hard): Shown per Country. Measure: Conversion Rate Search = Conversion Rate where Channel is "Search".
- Top 3 only (Hard): Shown per Campaigns Name. Measure: Top 3 Clicks = [Total Clicks] when the rank is 3 or better, else blank.
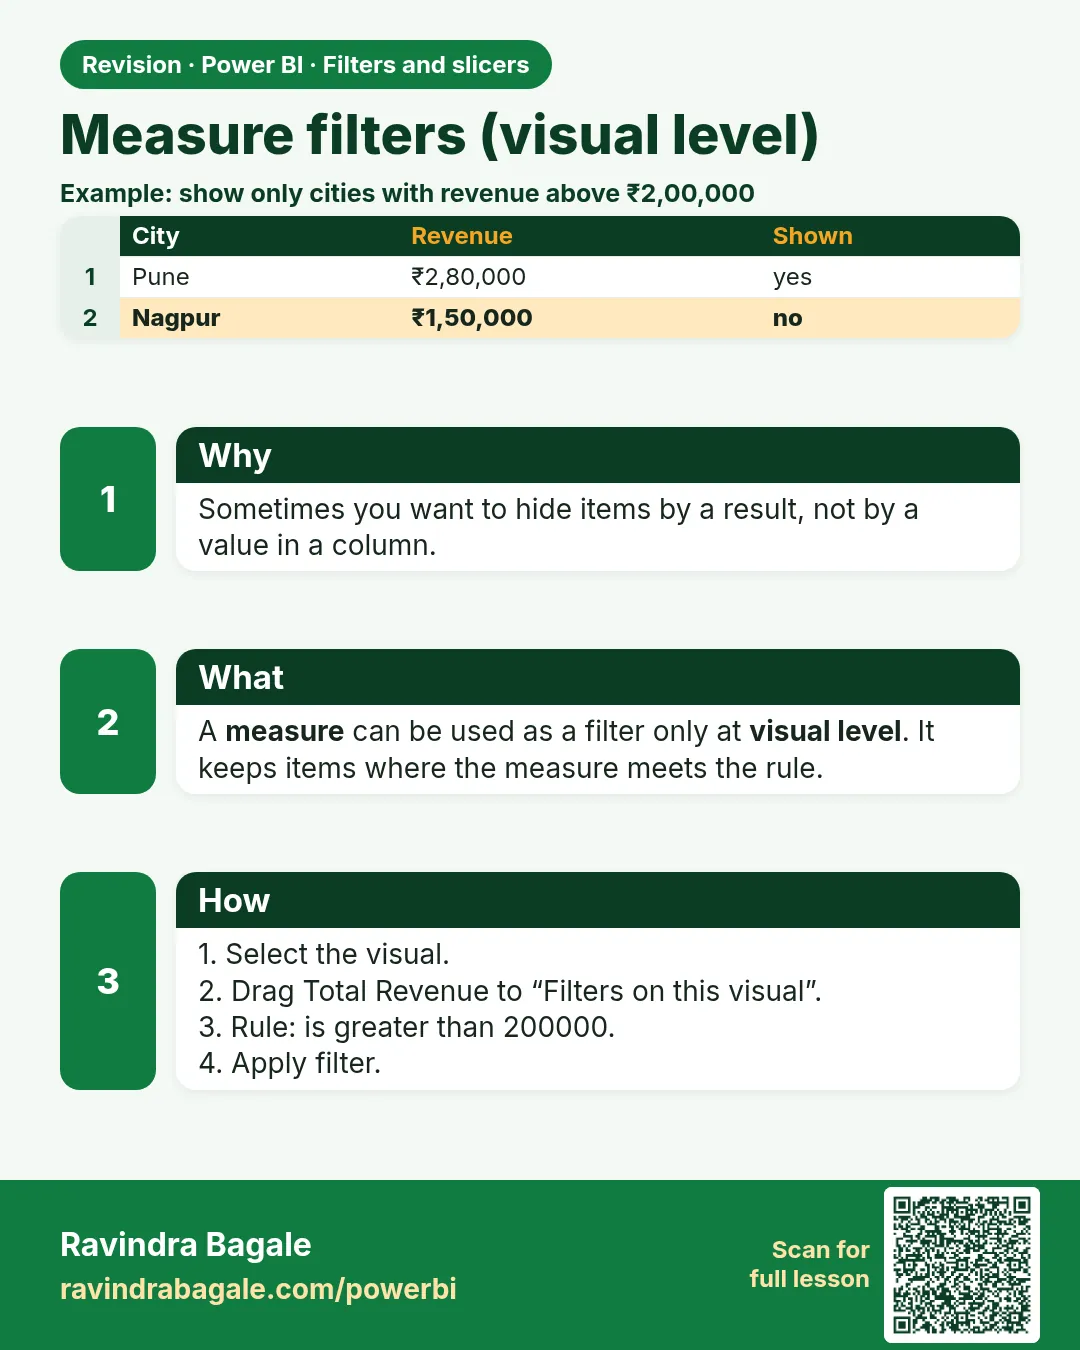 Revision card
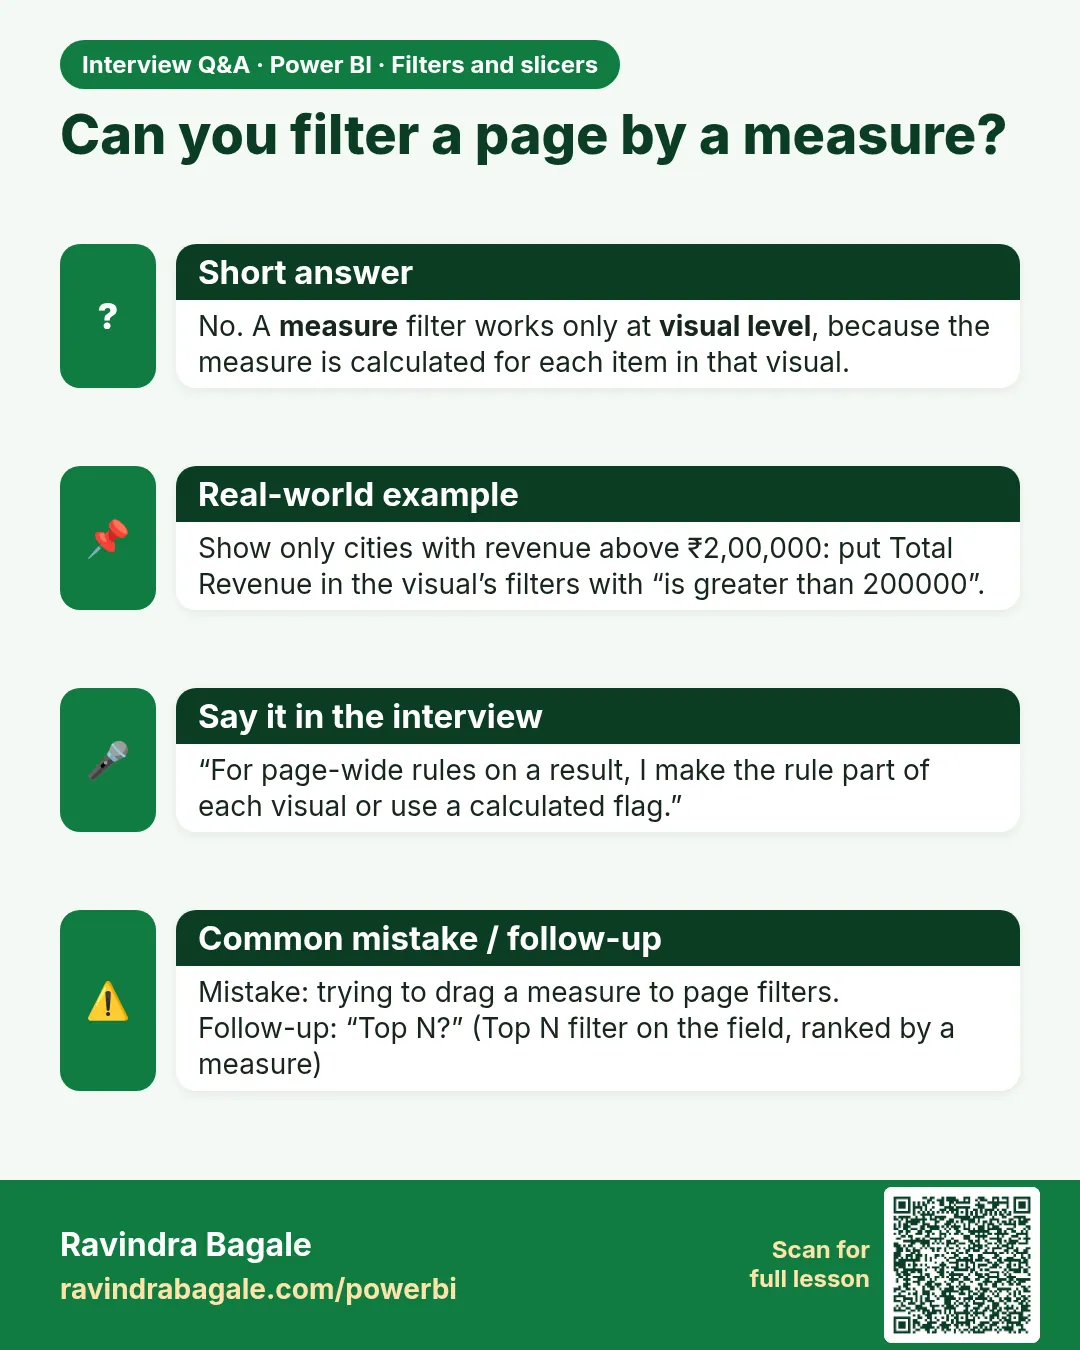 Interview card