22.12 How All Filters Combine
Start with a problem
Ravindra (Pune city manager, RLS role Pune) opens a page with report filter Blinkit, page filter May, and selects Nashik in the slicer. His card is blank and he thinks the report is broken.
Explain simply
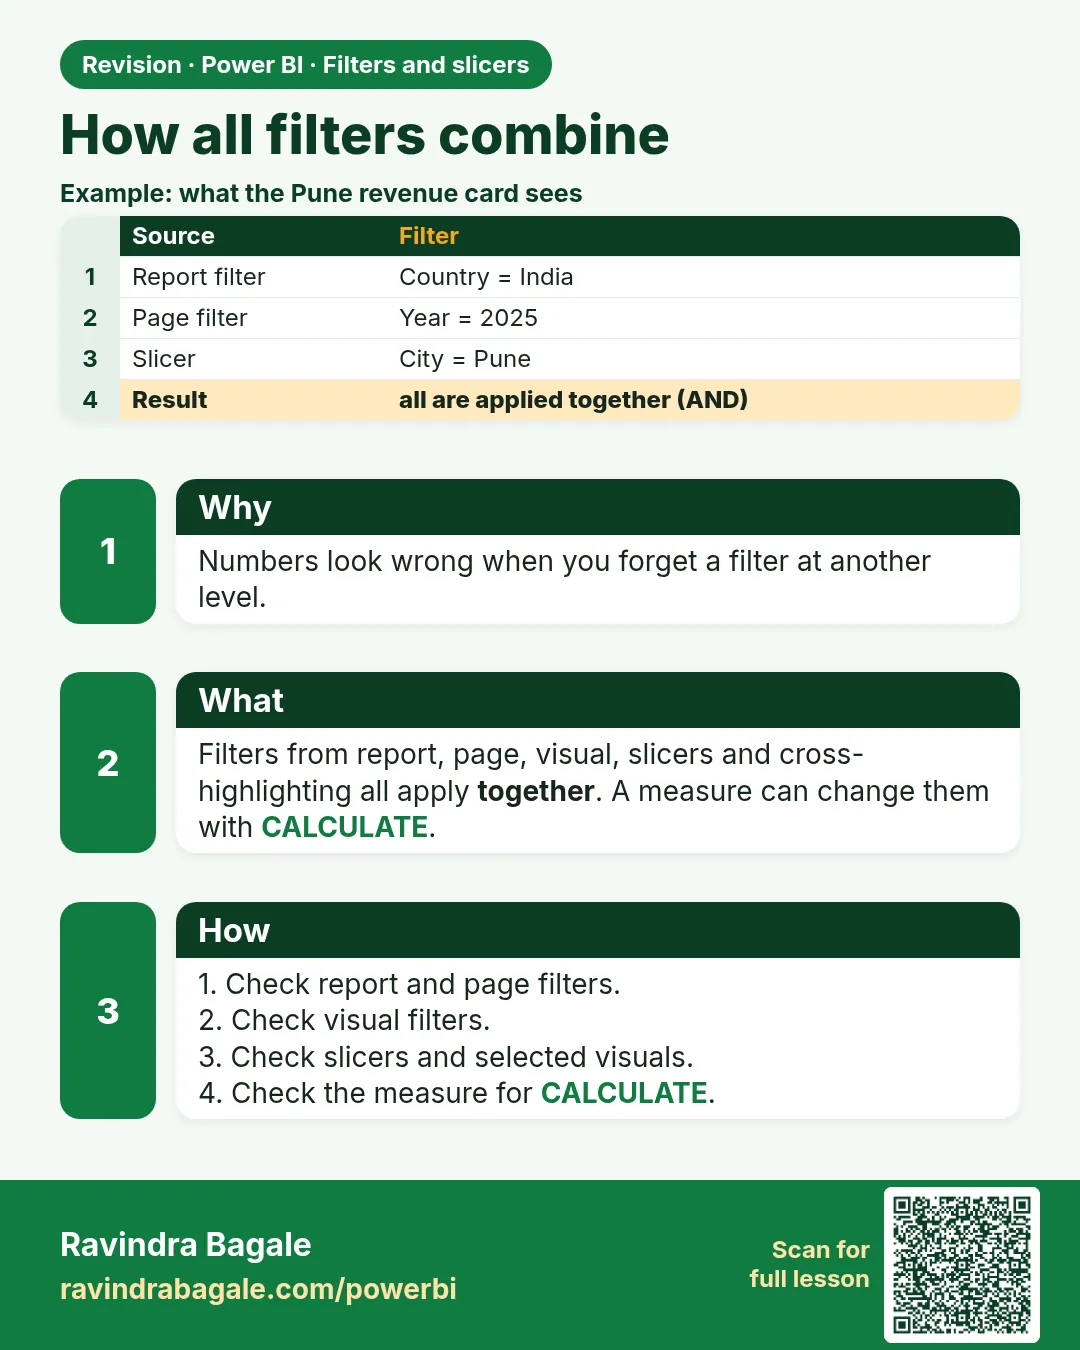
All filters – report, page, visual, slicers, cross-filters, drill-through and RLS – combine with AND. Only rows passing every layer reach the measure. RLS can never be removed by a measure.
Show the data
| Order ID | Order Date | City | Store | Platform | Category | Amount (₹) | Delivery mins | Status |
|---|---|---|---|---|---|---|---|---|
| 301 | 06-Apr-2026 | Pune | Kothrud | Blinkit | Dairy | 400 | 8 | Delivered |
| 302 | 06-Apr-2026 | Pune | Baner | Amazon Now | Snacks | 200 | 12 | Delivered |
| 303 | 07-Apr-2026 | Nashik | Gangapur | Blinkit | Dairy | 300 | 14 | Delivered |
| 304 | 04-May-2026 | Nashik | College Road | Blinkit | Fruits | 150 | 9 | Delivered |
| 305 | 04-May-2026 | Kolhapur | Rajarampuri | Amazon Now | Snacks | 450 | 7 | Delivered |
| 306 | 05-May-2026 | Pune | Kothrud | Blinkit | Fruits | 250 | 16 | Delivered |
| 307 | 05-May-2026 | Nashik | College Road | Amazon Now | Dairy | 350 | 11 | Delivered |
| 308 | 05-May-2026 | Kolhapur | Rajarampuri | Blinkit | Dairy | 0 | Cancelled |
About this data: This table uses columns: Order ID, Order Date, City, Store, Platform, Category, Amount (₹), Delivery mins, Status. This table uses columns: Layers, Rows, Total Sales. This table uses columns: Order, City, Platform, Status, Amount (₹). This table uses columns: Layer, Rows left, Total Sales. Values shown are the lesson examples already on this page (not a new dataset).
Fictional sample data. Practice file: visuals_orders_apr_may_2026.csv (source: src/practice/).
Demonstrate
- Apply report filter Platform = Blinkit (₹1,100).
- Apply page filter Month = May (₹400: 304, 306, 308).
- Slicer City = Nashik, then ₹150 (304).
- Modeling › View as role Pune with slicer still Nashik, then blank.
- Clear the slicer while viewing as Pune, then ₹250 (306).
Show the result
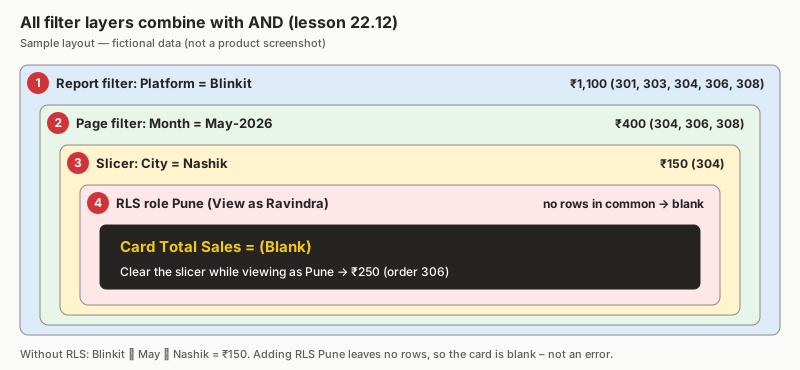
Your result should look like this (fictional sample):
| Layers | Rows | Total Sales |
|---|---|---|
| Blinkit | 301, 303, 304, 306, 308 | ₹1,100 |
| + May | 304, 306, 308 | ₹400 |
| + Slicer Nashik | 304 | ₹150 |
| + RLS Pune | none | blank |
| RLS Pune, slicer cleared | 306 | ₹250 |
Explain what happened
RLS Pune and slicer Nashik have no rows in common (AND), so the result is empty – not an error.
Explore further
CALCULATE([Total Sales], ALL(Orders[City]))can remove the slicer City filter but not RLS.
Detailed reference for this lesson:
How filters combine in Power BI with example — in 30 seconds
What: All filters work together with AND: filters on all pages, on this page, on this visual, slicers and clicks on visuals.
Why: A card shows less than expected because a hidden page or report filter is also working.
Tiny example: Report filter Blinkit AND slicer Pune AND visual filter Delivered, then only rows that pass all three are counted.
How filters combine in Power BI with example — 30 सेकंदात
काय: सगळे filters AND ने एकत्र काम करतात: all pages, this page, this visual वरचे filters, slicers आणि visuals वरचे clicks.
का: एखादा card अपेक्षेपेक्षा कमी दाखवतो, कारण एखादा लपलेला page किंवा report filter पण चालू असतो.
छोटं उदाहरण: Report filter Blinkit AND slicer Pune AND visual filter Delivered, then फक्त तिन्ही पास करणाऱ्या rows मोजल्या जातात.
How filters combine in Power BI with example — 30 सेकंड में
क्या: सारे filters AND से साथ काम करते हैं: all pages, this page, this visual के filters, slicers और visuals पर clicks.
क्यों: कोई card उम्मीद से कम दिखाता है, क्योंकि कोई छिपा page या report filter भी चालू होता है.
छोटा उदाहरण: Report filter Blinkit AND slicer Pune AND visual filter Delivered, then सिर्फ़ तीनों पास करने वाली rows गिनी जाती हैं.
First look at the data (before, then after):
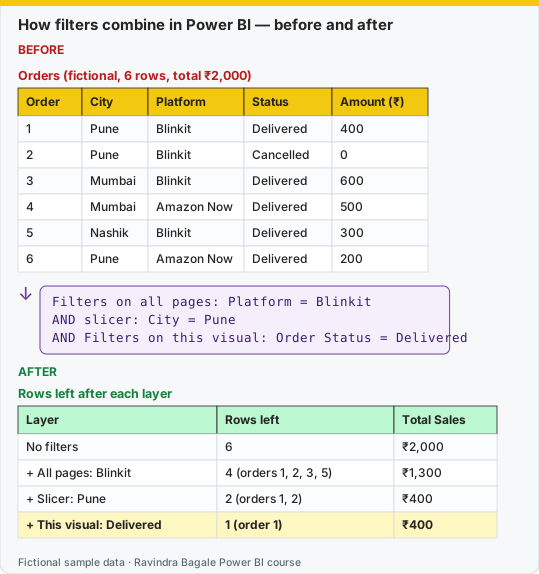
Same before / after tables as text
Before — Orders (fictional, 6 rows, total ₹2,000)
| Order | City | Platform | Status | Amount (₹) |
|---|---|---|---|---|
| 1 | Pune | Blinkit | Delivered | 400 |
| 2 | Pune | Blinkit | Cancelled | 0 |
| 3 | Mumbai | Blinkit | Delivered | 600 |
| 4 | Mumbai | Amazon Now | Delivered | 500 |
| 5 | Nashik | Blinkit | Delivered | 300 |
| 6 | Pune | Amazon Now | Delivered | 200 |
Formula / click path
Filters on all pages: Platform = Blinkit
AND slicer: City = Pune
AND Filters on this visual: Order Status = Delivered
After — Rows left after each layer
| Layer | Rows left | Total Sales |
|---|---|---|
| No filters | 6 | ₹2,000 |
| + All pages: Blinkit | 4 (orders 1, 2, 3, 5) | ₹1,300 |
| + Slicer: Pune | 2 (orders 1, 2) | ₹400 |
| + This visual: Delivered | 1 (order 1) | ₹400 |
Do it step by step:
- Open the Filters pane. Find the three levels: this visual, this page, all pages.
- Add Platform = Blinkit under Filters on all pages.
- Add a City slicer. Select Pune.
- Select the card. Add Order Status = Delivered under Filters on this visual.
- Check the card: ₹400.
- When a number looks wrong, check every level, including hidden and locked filters.
एक-एक step करून बघा:
- Filters pane उघडा. तीन levels शोधा: this visual, this page, all pages.
- Filters on all pages खाली Platform = Blinkit जोडा.
- एक City slicer टाका. Pune निवडा.
- Card निवडा. Filters on this visual खाली Order Status = Delivered जोडा.
- Card तपासा: ₹400.
- एखादा number चुकीचा वाटला तर लपलेले आणि locked filters धरून प्रत्येक level तपासा.
एक-एक step करके देखिए:
- Filters pane खोलिए. तीन levels ढूँढिए: this visual, this page, all pages.
- Filters on all pages के नीचे Platform = Blinkit जोड़िए.
- एक City slicer लगाइए. Pune चुनिए.
- Card चुनिए. Filters on this visual के नीचे Order Status = Delivered जोड़िए.
- Card जाँचिए: ₹400.
- कोई number ग़लत लगे तो छिपे और locked filters समेत हर level जाँचिए.
Slicers, Filters pane filters (all levels), cross-filtering, drill-through and RLS are combined with AND logic into the filter context (the full set of filters active when the measure runs) of every measure (Module 13.3). CALCULATE with ALL/REMOVEFILTERS can ignore some of them inside a measure. RLS can never be ignored.
In simple words (sopya bhashet)
In simple words: every filter in Power BI is one layer. Report filter, page filter, visual filter, slicer, cross-filter and RLS are stacked one under another. Only the rows that pass through every layer appear in the visual. That is why one very strict filter can make a visual blank. This is AND logic.
सोप्या भाषेत: Power BI मधला प्रत्येक filter म्हणजे एक layer. Report filter, page filter, visual filter, slicer, cross-filter आणि RLS एकाखाली एक लावलेले असतात. जे rows प्रत्येक layer मधून पास होतात, तेच visual मध्ये दिसतात. म्हणूनच एखादा खूप strict filter असला तर visual blank येतो. हेच AND logic आहे.
आसान शब्दों में: Power BI में हर filter एक layer है. Report filter, page filter, visual filter, slicer, cross-filter और RLS एक के नीचे एक लगे होते हैं. जो rows हर layer से पास होती हैं, सिर्फ़ वही visual में दिखती हैं. इसीलिए एक बहुत strict filter से visual blank हो सकता है. यही AND logic है.
Step by step: how Power BI decides what a visual shows
- Start with every row of the fact table (for example all order rows).
- RLS keeps only the rows this user is allowed to see (Module 26). A measure cannot remove this layer.
- Report-level filters (Filters on all pages) remove more rows.
- Page-level filters (Filters on this page) remove more rows.
- Slicers and cross-filtering from other visuals remove more rows, depending on Edit interactions (22.10).
- Visual-level filters (Filters on this visual) remove the last rows.
- The measure is calculated on whatever is left. Inside the measure,
CALCULATEcan remove or change some of these filters (not RLS).
One important detail: filters on different fields combine with AND, but several values ticked in the same slicer combine with OR (Pune or Nashik). Mhanje: across filters AND, inside one slicer OR.
Worked example 1 – Blinkit dairy orders, Pune (fictional): peeling the layers
Suppose we are the Blinkit dairy category team in Pune (fictional practice data). Orders come from two apps: Blinkit and Swiggy Instamart. The table DairyOrders has 8 rows:
| Order ID | City | App | Product | Amount (₹) |
|---|---|---|---|---|
| DO-101 | Pune | Blinkit | Milk | 240 |
| DO-102 | Pune | Instamart | Paneer | 360 |
| DO-103 | Pune | Blinkit | Milk | 90 |
| DO-104 | Satara | Blinkit | Milk | 300 |
| DO-105 | Pune | Instamart | Milk | 180 |
| DO-106 | Satara | Instamart | Ghee | 650 |
| DO-107 | Pune | Blinkit | Ghee | 520 |
| DO-108 | Pune | Instamart | Milk | 120 |
The "Milk Sales" card sits on a page with a page filter Product = Milk, a City slicer set to Pune, and a visual filter Amount ≥ 100 on the card. Watch what each layer does to Total Amount = SUM(DairyOrders[Amount]):
| Layer applied | Rows left | Total Amount |
|---|---|---|
| No filters | 8 | ₹2,460 |
| + Page filter Product = Milk | 5 (101, 103, 104, 105, 108) | ₹930 |
| + Slicer City = Pune | 4 (101, 103, 105, 108) | ₹630 |
| + Visual filter Amount ≥ 100 | 3 (101, 105, 108) | ₹540 |
The card shows ₹540 because a row must pass all filters (AND). Now set the card to None for the City slicer (Format › Edit interactions). The card skips the slicer. Rows 101, 104, 105 and 108 remain, and the card shows ₹840.
Worked example 2 – Nashik Valley Grapes (fictional exporter): OR inside a slicer, AND across slicers
A fictional Nashik grape exporter tracks shipments in the table Shipments:
| Shipment | Variety | Market | Tonnes |
|---|---|---|---|
| S1 | Thompson Seedless | Europe | 12 |
| S2 | Sharad Seedless | Europe | 8 |
| S3 | Thompson Seedless | Middle East | 10 |
| S4 | Flame Seedless | Europe | 6 |
| S5 | Sharad Seedless | Middle East | 5 |
- Variety slicer: Thompson Seedless and Sharad Seedless both ticked, then inside the slicer this means Thompson OR Sharad (S1, S2, S3, S5 = 35 tonnes).
- Add a Market slicer = Europe, then now Variety (Thompson or Sharad) AND Market = Europe, then S1 + S2 = 20 tonnes.
To show "all markets" next to it while the Market slicer stays on the page, remove only that one filter inside a measure:
Total Tonnes = SUM(Shipments[Tonnes])
All Markets Tonnes = CALCULATE([Total Tonnes], REMOVEFILTERS(Shipments[Market]))
With the same selections, All Markets Tonnes returns 35 (the Variety filter still applies, only Market is removed). If an RLS role limited this user to Europe, even REMOVEFILTERS could not bring the Middle East rows back.
Common mistake – Panchganga Gul Bhandar, Kolhapur (fictional): the blank card
The owner of a fictional Kolhapur jaggery shop opens the report, picks 2025 in the Year slicer, and the "Sales" card says (Blank). The data is fine. The cause: while designing, someone added a hidden page filter Year = 2024 and forgot it. Year = 2024 AND Year = 2025 can never both be true, so no row survives.
How to find it, layer by layer:
- Open the Filters pane in Desktop and look at Filters on this visual, on this page and on all pages (hidden filters are visible to you as the author).
- Check the slicers on the page, and synced slicers from other pages (22.9).
- Check Edit interactions: is another visual cross-filtering this card?
- If the report has RLS, use Modeling › View as with the role to test (Module 26).
Remove the forgotten Year = 2024 page filter and the card shows 2025 sales again.
Practice task
On the Executive page: add Platform (tile), City (dropdown, multi-select), Order Date (between) and Category (hierarchy with Product) slicers. Sync Platform and Order Date to all pages (visible only on Executive). Add a hidden page filter excluding test stores and a locked filter State = Maharashtra. Set the "All platforms" card to ignore the Platform slicer, and add a Top 5 products filter on a bar chart.
Got it? All filters combine with AND. If not, read this section once more.
समजलं का? सगळे फिल्टर्स AND ने कम्बाइन होतात. नसेल तर हा सेक्शन पुन्हा एकदा वाचा.
समझ आया? सारे फ़िल्टर्स AND से कम्बाइन होते हैं. नहीं तो यह सेक्शन एक बार फिर पढ़ो.
Ravindra Bagale's Tip
Friends, many students forget that all filters combine with AND: report filter, page filter, visual filter, slicers, cross-filters and RLS. When a visual shows blank, check each layer one by one, starting with the Filters pane and then the slicers. This matters for both exams and interviews.
Ravindra Bagale's Tip – मराठी
मित्रांनो, बरेच students विसरतात की सगळे filters AND ने एकत्र येतात: report filter, page filter, visual filter, slicers, cross-filters आणि RLS. Visual blank दिसला तर प्रत्येक लेयर एक-एक करून चेक करा, आधी Filters pane आणि मग slicers. हे exam आणि interview दोन्हीसाठी important आहे.
Ravindra Bagale's Tip – हिंदी
दोस्तों, बहुत से students भूल जाते हैं कि सारे filters AND से मिलते हैं: report filter, page filter, visual filter, slicers, cross-filters और RLS. Visual blank दिखे तो हर परत एक-एक करके check करो, पहले Filters pane और फिर slicers. यह exam और interview दोनों के लिए ज़रूरी है.
Fix common mistakes
| Wrong result | Reason | Correction |
|---|---|---|
| Blank card bug | Contradictory filters (RLS Pune + slicer Nashik) | Show the active filters; let RLS users see only their cities in the slicer |
| Measure with ALL shows other cities to a restricted user | Impossible – RLS applies first | Explain RLS cannot be bypassed |
| Totals differ between pages | Different page filters | Document scopes |
Practise independently
Practice task
Viewing as Pune with no slicer and no page filter, but report filter Blinkit – what is the card?
Hints
- Pune Blinkit orders: 301, 306.
Solution
₹650.
Think like a professional
Explaining AND logic calmly to a worried manager is a real job skill. Walk the layers in order, exactly as in the table.
 Revision card