20. Dynamic Text and Dynamic Colour (Conditional Formatting)
20.4 Text Box with Dynamic Values and Smart Narrative
Start with a problem
Zoya wants a sentence at the top: This FY, 8 orders brought ₹2,100. – and it must update with slicers.
Explain simply
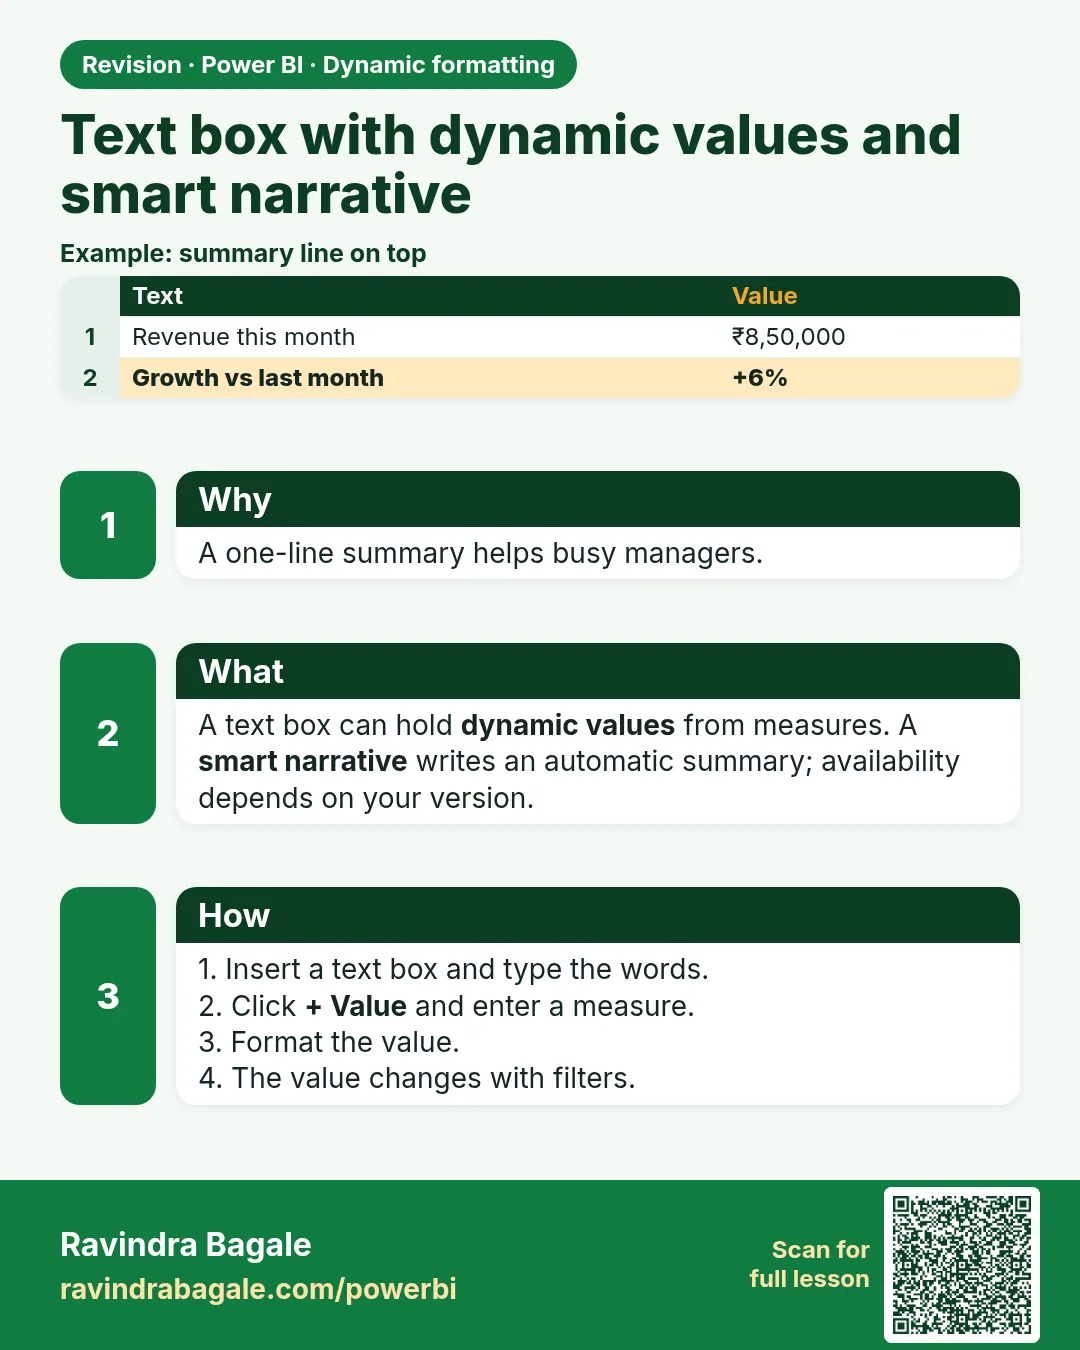
A text box can include dynamic values: type text, then insert a value from a measure. The value follows the page filters.
Show the data
| KPI | Value | Hand calculation |
|---|---|---|
| Total Sales | ₹2,100 | 400+200+300+150+450+250+350+0 |
| Orders | 8 | 301 to 308 |
| Delivered orders | 7 | all except 308 |
| AOV | ₹300 | 2,100 ÷ 7 |
| % under 10 min | 42.9% | 3 ÷ 7 (301, 304, 305) |
| Cancellation rate | 12.5% | 1 ÷ 8 |
About this data: This table uses columns: KPI, Value, Hand calculation. This table uses columns: Slicer, Sentence. This table uses columns: Wrong result, Reason, Correction. Values shown are the lesson examples already on this page (not a new dataset).
Fictional sample data. Practice file: visuals_orders_apr_may_2026.csv (source: src/practice/).
Demonstrate
- Insert › Text box › type This FY,
- Click + Value › type or choose
Total Orders› Save. - Continue orders brought › + Value ›
Total Sales. - Select Nashik in the slicer.
Show the result
Your result should look like this (fictional sample):
| Slicer | Sentence |
|---|---|
| None | This FY, 8 orders brought ₹2,100. |
| Nashik | This FY, 3 orders brought ₹800. |
Explain what happened
Each inserted value is a measure evaluated with the page filters.
Explore further
- Smart narrative can generate sentences automatically, but check its wording.
Detailed reference for this lesson:
Steps in Power BI – text box with values
- Insert › Text box. Type: "This period, total orders were ".
- Click + Value on the text box toolbar. In How would you calculate this value? type or pick
Total Orders. Set its Format and Name › Save. - Continue typing: " with an average delivery time of ", then + Value ›
Avg Delivery Time (mins), and " minutes." - The values update with slicers. Format fonts as usual.
Smart narrative / Narrative: Insert › Smart narrative (in newer versions, the Narrative visual, with Copilot where available and enabled). It generates a text summary of the page or visual, with key trends and values. You can edit the text and add your own values with + Value. Always read the generated text before publishing.
A measure-based narrative (full control):
Narrative Text =
"In " & [Selected Cities] & ", " & FORMAT([Total Orders], "#,##0") & " orders were delivered in "
& FORMAT([Avg Delivery Time (mins)], "0.0") & " minutes on average; "
& FORMAT([% Orders Delivered Under 10 Mins], "0.0%") & " arrived within 10 minutes."
Show it in a Card (Callout value) or a Card (new) with the category label off.
Ravindra Bagale's Tip
Friends, many students type a number into a text box and forget to update it next month. Insert dynamic values (measures) into the text box so the sentence updates with the data, and review the text of smart narratives before publishing. Never forget this.
Ravindra Bagale's Tip – मराठी
मित्रांनो, बरेच students text box मध्ये number टाइप करतात आणि पुढच्या महिन्यात तो update करायला विसरतात. Text box मध्ये dynamic values (measures) टाका म्हणजे वाक्य data सोबत update होईल, आणि publish करण्याआधी smart narratives चा text चेक करा. हे अजिबात विसरू नका.
Ravindra Bagale's Tip – हिंदी
दोस्तों, बहुत से students text box में number type कर देते हैं और अगले महीने उसे update करना भूल जाते हैं. Text box में dynamic values (measures) डालो ताकि वाक्य data के साथ update हो, और publish करने से पहले smart narratives का text check करो. यह बिल्कुल मत भूलना.
Fix common mistakes
| Wrong result | Reason | Correction |
|---|---|---|
| Value shows 2100 without ₹ | Measure format not set | Format the measure as ₹ |
| + Value missing | Older version | Use a card with a text measure |
| Sentence ignores slicer | Interaction off | Check Edit interactions |
Practise independently
Practice task
What does the sentence show for Kolhapur?
Hints
- 2 orders.
Solution
This FY, 2 orders brought ₹450.
Think like a professional
One plain sentence often communicates better than three charts. Executives read the top line first.
 Revision card