27.6 Report Design
Start with a problem
The page has 25 visuals, including a matrix with every column.
Explain simply
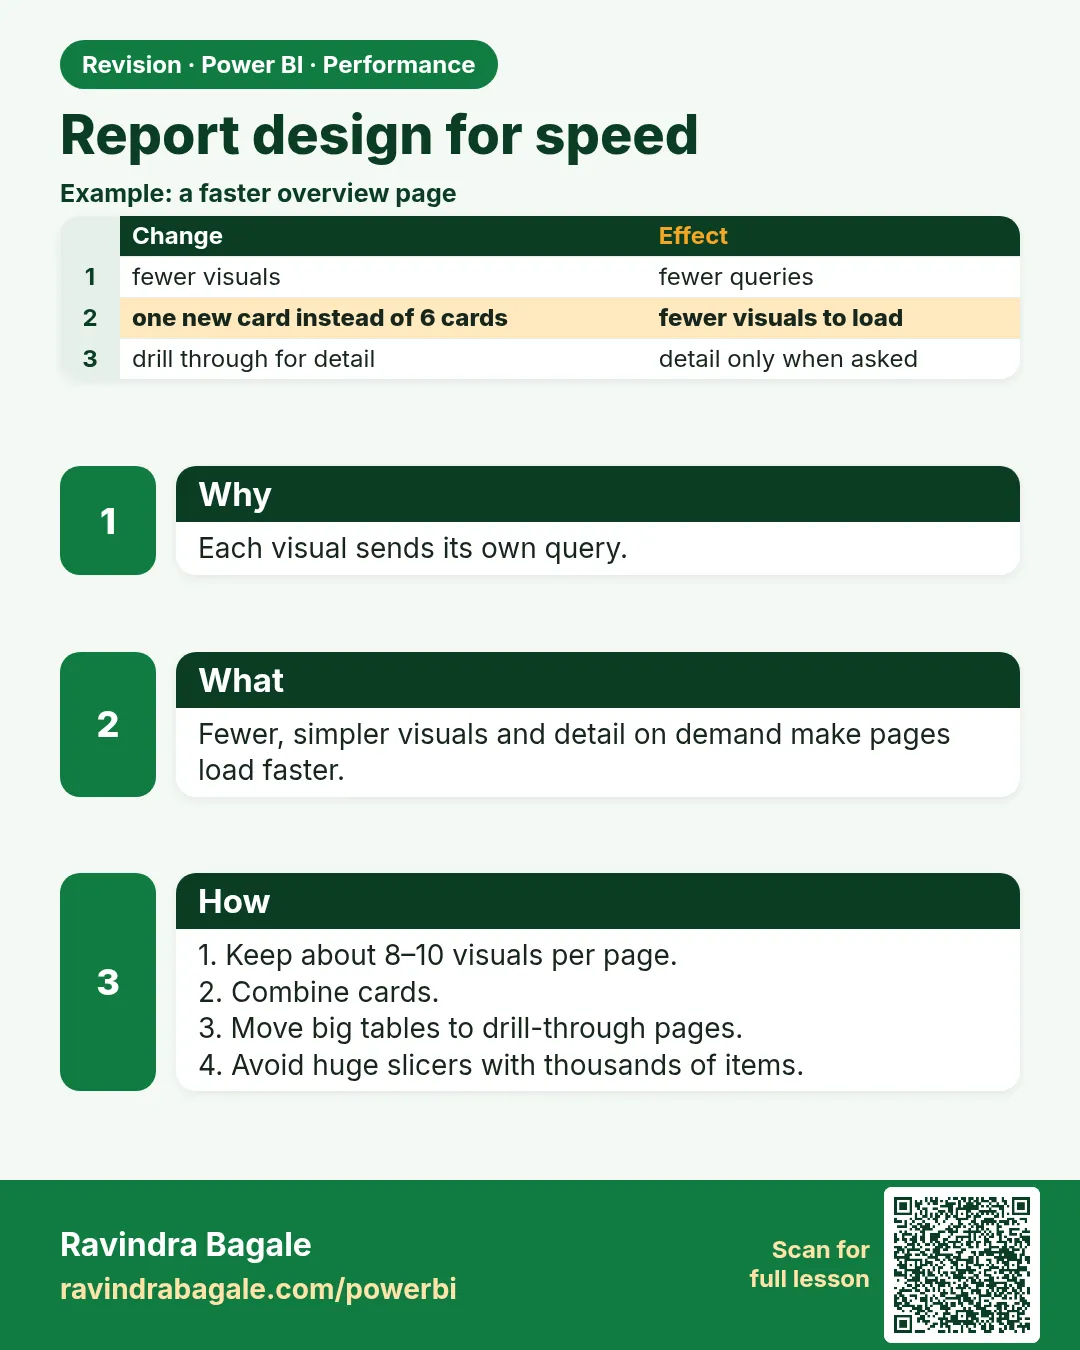
Fewer visuals, fewer fields per visual, and drill-through/tooltip pages for detail make pages faster.
Show the data
| Visual | DAX query (ms) | Visual display (ms) | Other (ms) | Total (ms) |
|---|---|---|---|---|
| Sales card | 40 | 15 | 20 | 75 |
| City bar chart | 120 | 60 | 30 | 210 |
| Store matrix (all columns) | 2,600 | 900 | 150 | 3,650 |
| Category donut | 90 | 40 | 25 | 155 |
| Slicer City | 20 | 10 | 15 | 45 |
About this data: This table uses columns: Visual, DAX query (ms), Visual display (ms), Other (ms), Total (ms). This table uses columns: Page, Total time (sample). This table uses columns: Wrong result, Reason, Correction. Values shown are the lesson examples already on this page (not a new dataset).
Fictional sample data. Practice file: performance_analyzer_sample.csv (source: src/practice/).
Demonstrate
- Remove the full Store matrix from the overview.
- Add a drill-through page for store details.
- Re-run Performance Analyzer.
Show the result
Your result should look like this (fictional sample):
| Page | Total time (sample) |
|---|---|
| Before | 4,135 ms |
| After (matrix moved) | 485 ms |
Explain what happened
The heavy matrix is now only queried when someone drills through.
Explore further
- 485 = 75 + 210 + 155 + 45.
Detailed reference for this lesson:
- Keep the number of visuals per page reasonable; each visual sends at least one query.
- Use drill through and tooltips to show details on demand instead of huge tables on the main page.
- Limit high-density visuals (tables with thousands of rows, maps with many points).
- Optimize › Optimization presets can switch on query reduction – e.g. slicers and filters with an Apply button so queries run only once the user finishes selecting.
- Be careful with heavy custom visuals; test their display time.
- For DirectQuery, keep the source well indexed, reduce visuals per page and consider aggregations or Dual storage mode for dimension tables.
Ravindra Bagale's Tip
Friends, many students put 25 visuals and 8 slicers on one page and then blame the model. Every visual sends queries, so reduce the visuals per page, use the Apply button on slicers, and move detail tables to drill-through pages. Clear?
Ravindra Bagale's Tip – मराठी
मित्रांनो, बरेच students एकाच page वर 25 visuals आणि 8 slicers ठेवतात आणि मग model ला दोष देतात. प्रत्येक visual queries पाठवतो, म्हणून page वरचे visuals कमी करा, slicers वर Apply button वापरा, आणि detail tables drill-through pages वर हलवा. समजलं का?
Ravindra Bagale's Tip – हिंदी
दोस्तों, बहुत से students एक page पर 25 visuals और 8 slicers रख देते हैं और फिर model को दोष देते हैं. हर visual queries भेजता है, इसलिए page पर visuals कम करो, slicers पर Apply button इस्तेमाल करो, और detail tables को drill-through pages पर ले जाओ. समझ आया?
Fix common mistakes
| Wrong result | Reason | Correction |
|---|---|---|
| Still slow | Hidden visuals still query | Delete or move visuals |
| Users miss the detail | No path | Add drill-through button |
| Many cards | One query each | Use a multi-row card |
Practise independently
Practice task
Compute the page total after removing the matrix.
Hints
- Add the other four.
Solution
485 ms.
Think like a professional
Design for the question, then show detail on demand.
 Revision card