27.1 Why Reports Become Slow
Start with a problem
Rani says the Sales page takes 5 seconds to load. Ravindra must find why.
Explain simply
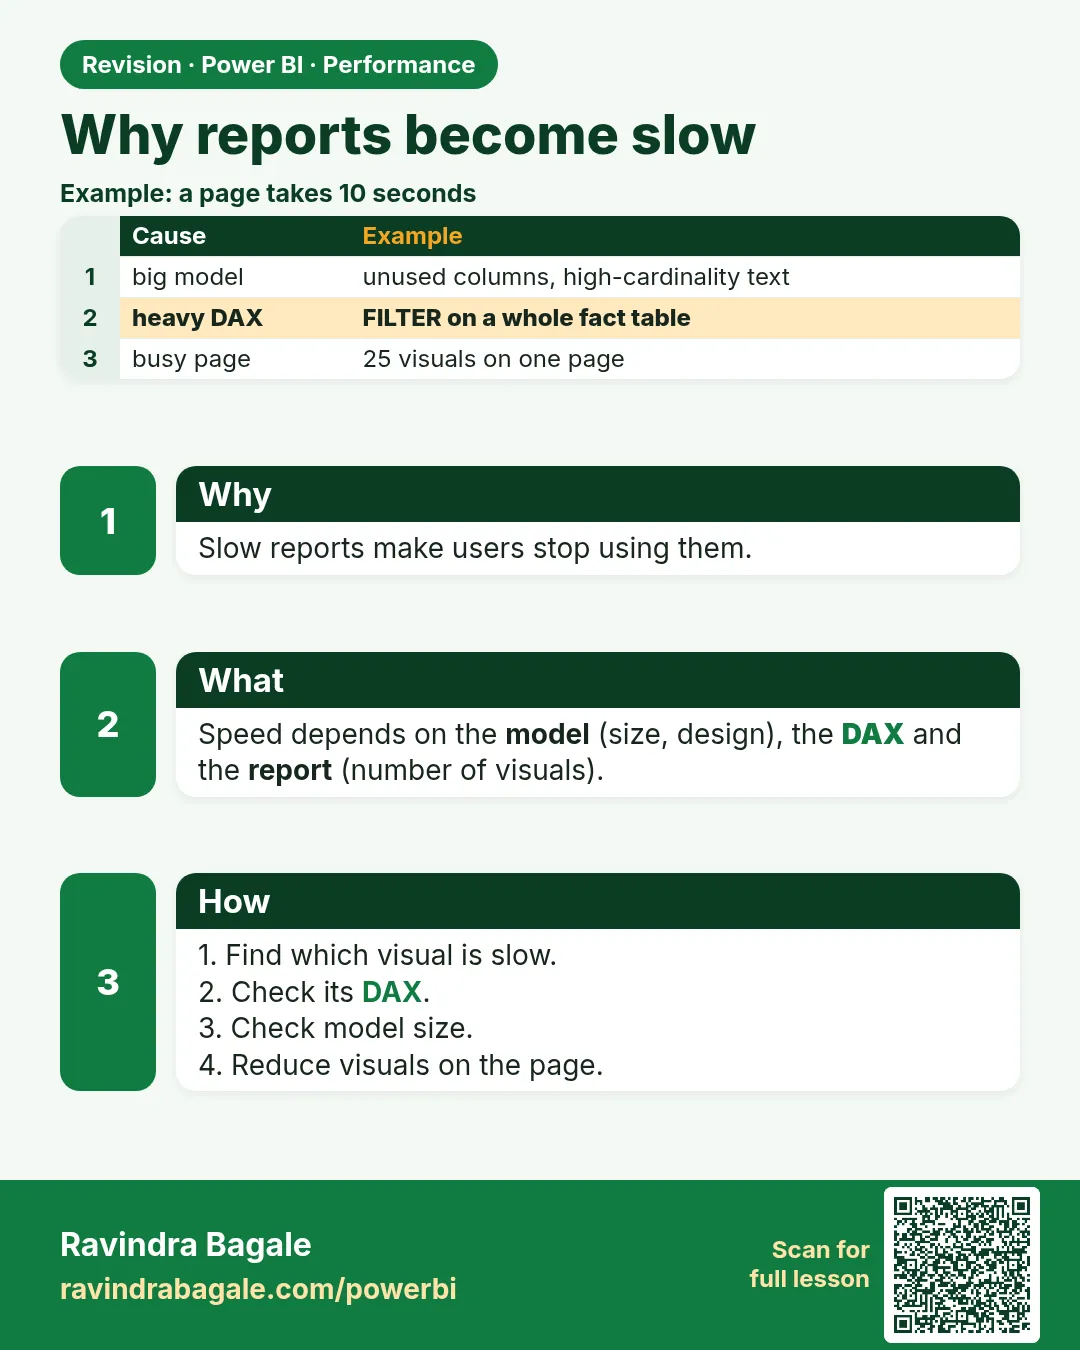
Slowness comes from four places: model size, DAX, too many visuals, and the source (DirectQuery/gateway).
Show the data
| Visual | DAX query (ms) | Visual display (ms) | Other (ms) | Total (ms) |
|---|---|---|---|---|
| Sales card | 40 | 15 | 20 | 75 |
| City bar chart | 120 | 60 | 30 | 210 |
| Store matrix (all columns) | 2,600 | 900 | 150 | 3,650 |
| Category donut | 90 | 40 | 25 | 155 |
| Slicer City | 20 | 10 | 15 | 45 |
About this data: This table uses columns: Visual, DAX query (ms), Visual display (ms), Other (ms), Total (ms). This table uses columns: Slowest, Total. This table uses columns: Wrong result, Reason, Correction. Values shown are the lesson examples already on this page (not a new dataset).
Fictional sample data. Practice file: performance_analyzer_sample.csv (source: src/practice/).
Demonstrate
- List the visuals on the page.
- Open Performance Analyzer (27.2).
- Sort by Total.
- Name the slowest visual.
Show the result
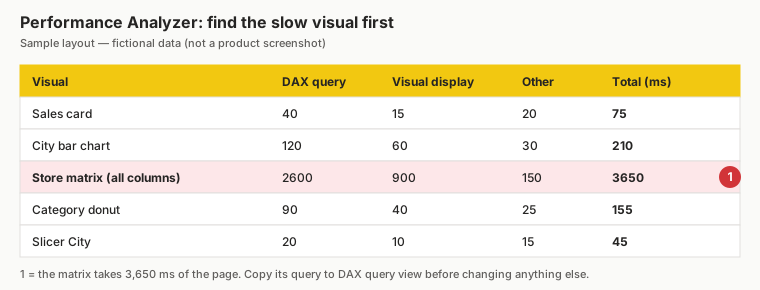
Your result should look like this (fictional sample):
| Slowest | Total |
|---|---|
| Store matrix | 3,650 ms |
Explain what happened
One heavy matrix dominates; the others are fast.
Explore further
- Sum of totals: 75 + 210 + 3,650 + 155 + 45 = 4,135 ms.
Detailed reference for this lesson:
A slow report usually has one or more of these causes:
- A large model: too many columns or rows.
- High-cardinality columns.
- Complex relationships: bi-directional or many-to-many.
- Inefficient DAX.
- Too many visuals on one page.
- A slow DirectQuery source. In DirectQuery the data stays in the source, and every click sends a query to it.
Ravindra Bagale's Tip
Friends, many students guess the cause of slowness and change random things. Measure first with Performance Analyzer, find the slowest visual, and fix that one. Then measure again to prove the improvement. This matters for both exams and interviews.
Ravindra Bagale's Tip – मराठी
मित्रांनो, बरेच students slowness चं कारण अंदाजाने ठरवतात आणि काहीही बदलत बसतात. आधी Performance Analyzer ने मोजा, सगळ्यात slow visual शोधा, आणि तोच दुरुस्त करा. मग सुधारणा सिद्ध करण्यासाठी पुन्हा मोजा. हे exam आणि interview दोन्हीसाठी important आहे.
Ravindra Bagale's Tip – हिंदी
दोस्तों, बहुत से students slowness की वजह का अंदाज़ा लगाते हैं और कुछ भी बदलते रहते हैं. पहले Performance Analyzer से मापो, सबसे slow visual ढूँढो, और उसी को ठीक करो. फिर सुधार साबित करने के लिए दोबारा मापो. यह exam और interview दोनों के लिए ज़रूरी है.
Fix common mistakes
| Wrong result | Reason | Correction |
|---|---|---|
| Rewrote all measures | Guessing | Measure first |
| Blamed the card | No evidence | Check timings |
| Slow only in Service | Gateway/source | Check refresh/DirectQuery |
Practise independently
Practice task
What share of total time is the matrix?
Hints
- 3,650 ÷ 4,135.
Solution
≈ 88.3%.
Think like a professional
Measure before you change. Interviewers like this mindset.
 Revision card