23. Report and Dashboard Design Principles
23.8 How Shraddha Decides a KPI
In short: Shraddha Bagale is the Nashik manager in this fictional file.
Shraddha Bagale is the Nashik manager in this fictional file. Monday, 8:30 IST. She does not open the report to look around. She has until about 11:00, before lunch orders build, to name one dark store. That store gets a rider conversation and a stock check. The other Nashik stores do not get a rider pulled away just because their order card is smaller.
If she names the wrong store, the business does not get a cleaner layout. It gets a late Gangapur through the noon peak, and a College Road team sitting in a meeting it did not need. That is why the dashboard exists. The clicks come after the name is chosen.
Write the decision before the KPI
On paper, one sentence:
Before 11:00 IST I will name the Nashik dark store that is missing the 10-minute promise, and I will not move a rider off a store that is keeping it.
That sentence is the spec. A KPI that does not change the name, or does not stop a bad move, does not go on the page. This is the whole method. The rest is arithmetic on rows you already have.
The rows are the Nashik half of the fictional week in section 23.7. They are not a company result. Her role is Nashik only. Module 28 tests that with shraddha.bagale@example.com.
| Store | Orders | Delivered | Under 10 min | Missed 10 min | Cancelled |
|---|---|---|---|---|---|
| College Road | 12 | 10 | 9 | 1 | 1 |
| Gangapur Road | 8 | 6 | 4 | 2 | 1 |
| Satpur | 6 | 5 | 4 | 1 | 0 |
Missed is delivered minus under 10 minutes. College Road is 10 − 9 = 1. Gangapur is 6 − 4 = 2. Satpur is 5 − 4 = 1. You do not need a new extract. The count was already in the earlier table.
Turn the decision into a question
"Which dark stores are late?" needs a definition, or two managers will bring two answers.
- Late here means a delivered order that took more than 10 minutes. The promise was about arrival, so the denominator is delivered orders, not every order that was placed.
- A cancel is not late. It never arrived, so it has no honest delivery time. It is a second failure, counted on its own.
- Busy is not late. Orders can be high on a store that kept the promise.
The question that matches her sentence is: which Nashik store is missing that promise, and is the miss large enough to move someone today? "How is Nashik doing?" is too wide. It invites total orders onto the title.
Test every candidate, including the popular ones
A number stays only if this is true: if the number improved and Gangapur was still late, she would make the wrong call. If that can happen, the number is vanity for this decision. It can still be a real fact. Vanity does not mean "false". It means "the wrong job".
Total orders fails. Nashik orders are 12 + 8 + 6 = 26. College Road has 12, the largest. Sort the page by orders and College Road is the hero. College Road is also the best promise in the city: 9 of 10 delivered orders are inside 10 minutes, 90%. Gangapur has 8 orders, so it looks quieter, and only 4 of 6 delivered orders are inside 10 minutes, 66.7%. Two of those six were late.
Now move the week forward in your head. College Road goes from 12 orders to 18. Gangapur stays at 4 of 6. Nashik's order card rises. Anyone reading total orders says the city had a better Monday. The store she needed to call is the same store. The business got a larger number and the same noon problem. That is the test, failed in public.
Put the two side by side so the contrast is the lesson, not a slogan.
| Total orders (vanity here) | % delivered under 10 min | |
|---|---|---|
| What it counts | Every order placed, including cancels | Delivered orders inside 10 minutes, divided by delivered orders |
| College Road | 12, the "winner" | 9 ÷ 10 = 90% |
| Gangapur Road | 8, looks smaller | 4 ÷ 6 = 66.7% |
| If it goes up | The page celebrates | She might actually be on time |
| What she does if she trusts it | Calls the busy store, or calls no one | Calls Gangapur |
Delivered sales and AOV fail the same test for this question. Section 23.7 already shows Nashik delivered sales of ₹8,400 and Pune of ₹7,600, and the same AOV of ₹400 on both cities. A matching AOV cannot name Gangapur. A higher sales card cannot name Gangapur. Money answers "what did a delivered basket come to?". It does not answer "who was late?".
Ratings, app opens, item counts, new users are not even in these rows. They arrive because someone says "while we are here". They are how the left-hand page in the earlier picture gets eight coloured cards. None of them names a dark store.
The three KPIs she keeps
Three, not a catalogue.
-
% delivered under 10 minutes. Under-10 delivered orders ÷ delivered orders. Gangapur 66.7% (4 ÷ 6). Satpur 80% (4 ÷ 5). College Road 90% (9 ÷ 10). This is the promise. It is card one because it is the decision. Total orders does not sit beside it as an equal. If someone insists on seeing 26, it goes under the title in small type, labelled "context, not the KPI".
-
Count of deliveries that missed 10 minutes. The rate says Gangapur is worst. The count says the job is 2 deliveries, not 2 and not 20. College Road has 1. Satpur has 1. She does not treat Satpur's single miss as the same emergency as Gangapur's two, and she does not hire on a rate that has no size. A rate without a count is how a small store looks like a crisis.
-
Cancellation rate. Cancelled ÷ all orders. Gangapur 1 ÷ 8 = 12.5%. College Road 1 ÷ 12 = 8.3%. Satpur 0 ÷ 6 = 0%. Cancels never enter the 10-minute rate. A store can look "faster" next week by cancelling the orders it cannot serve. The third KPI stops that trick. Satpur's zero is also why she does not strip Satpur to feed a hunch.
Average minutes would be a fair fourth KPI when every delivered row has minutes, which is the measure in Module 28. This table only marks inside or outside 10 minutes. She does not invent an average to fill a slot. Empty card, honest page.
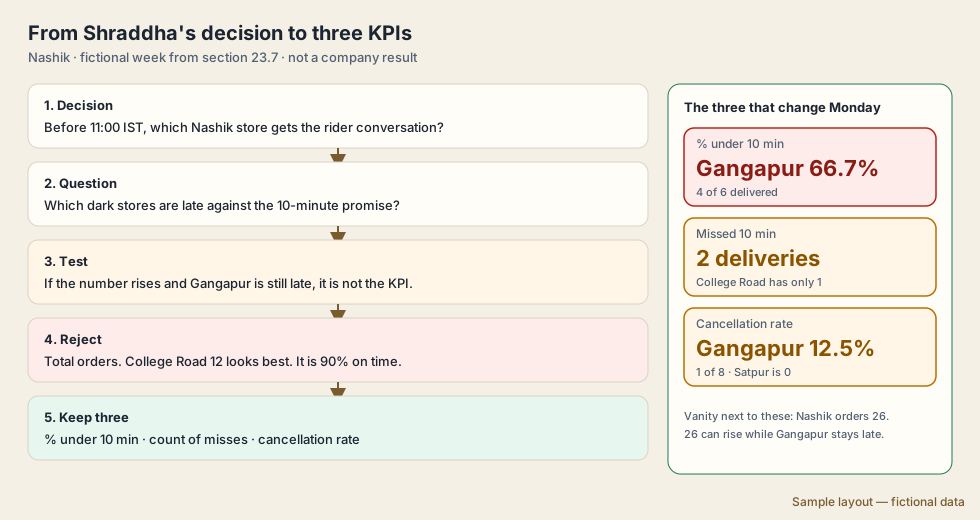
Sample layout — fictional data. Read it top to bottom: decision, question, the test, the rejection of total orders, the three that stay.
What she does at 9:00
She calls Gangapur Road. The sentence she takes into the call is short. Two delivered orders missed 10 minutes. One order of eight was cancelled. Find out whether that was a missing item, a rider after the peak, or a promise the store cannot keep at that hour. The hour itself is the next page, not this one.
She does not open with College Road. Twelve orders is real. It is the pattern to copy (9 of 10, one cancel in twelve), not the problem to staff. She does not pull Satpur's rider because Satpur has only six orders. Six orders with no cancels and one miss is a small clean store. Moving that rider to chase a total-orders ranking would make Satpur late in order to decorate a chart.
What the business gets, and what it does not
It gets a store name before 11:00. It gets a size: two slow deliveries and one cancel. Riders stay at the stores that kept the promise. And Pune gets one definition of "late" that it can reuse for Kothrud without another argument. It gets a page that can pass the five-second test.
It does not get a forecast of Tuesday. It does not get evidence about any real company. These are fictional sample rows. It does not get permission to put 26 orders in the title and call the week a success.
Same trap, one level up: city looks fine, store does not
Pune in the same week is 15 of 19 delivered orders inside 10 minutes, which is 79% to the nearest percent (15 ÷ 19 = 0.789). Nashik is 17 of 21, 81% (17 ÷ 21 = 0.810). A state page that stops at cities says the two cities match, and the call ends. Inside Pune, Kothrud is 3 of 6, 50%, with 2 cancels out of 8 orders (25%). Baner is 5 of 5 and no cancels, on only 6 orders. The city bar hid the store the way Nashik's order card hid Gangapur.
The next picture drills that path: Maharashtra, then Pune, then Kothrud. It steps on its own every few seconds. Shraddha's walk and this drill are one lesson. Rani can start at the state. Ravindra has to finish at the store. A dashboard that cannot make that trip will always congratulate the city.
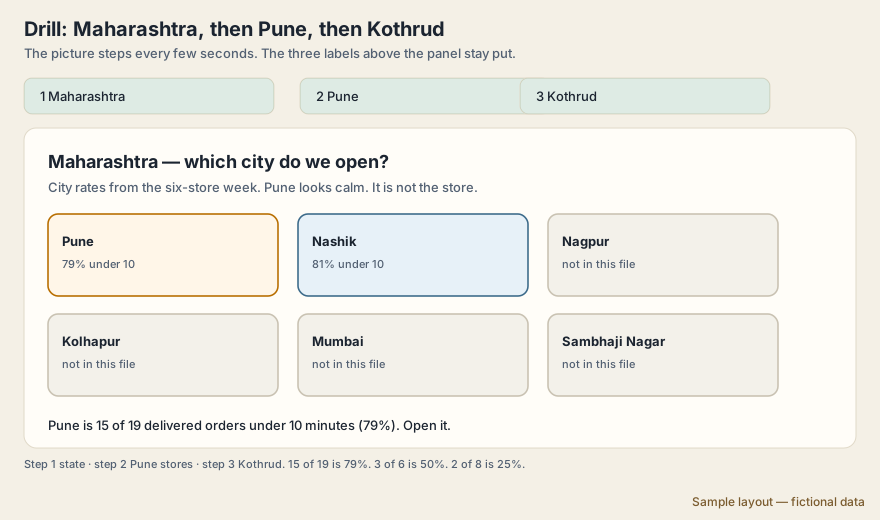
Sample layout — fictional data. The panel moves from the state, to FC Road / Kothrud / Baner, to Kothrud's three numbers. If it stays on the first step, use the line on the picture: 15 of 19 is about 79%, 3 of 6 is 50%, 2 of 8 is 25%. Other cities are named and left blank on purpose. They are not in this six-store file, and a blank is more honest than a made-up rate.
Ravindra Bagale's Tip
Friends, do not copy a KPI list from an article. First write one sentence: which decision will be taken today. Then ask of total orders: if this number goes up, does Gangapur still stay late? If yes, it is a vanity number, not a false one. Don't make this mistake!
Ravindra Bagale's Tip – मराठी
मित्रांनो, KPI ची यादी एखाद्या लेखातून copy करू नका. आधी एक वाक्य लिहा: आज कोणता decision घेणार. मग total orders ला विचारा: हा number वाढला तरी Gangapur late राहतं का? राहत असेल तर तो vanity number आहे, खोटा नाही. चूक करू नका!
Ravindra Bagale's Tip – हिंदी
दोस्तों, KPI की list किसी लेख से copy मत करो. पहले एक वाक्य लिखो: आज कौन-सा decision लेना है. फिर total orders से पूछो: यह number बढ़ने पर भी क्या Gangapur late रहता है? रहता है तो वह vanity number है, झूठा नहीं. ग़लती मत करो!
Fix common mistakes
| Wrong result | Reason | Correction |
|---|---|---|
| Total orders chosen as the KPI | Vanity metric – does not drive the decision | Ask what decision the number changes |
| KPI without definition | Readers assume different formulas | Write the formula under the title |
Practise independently
Practice task
For Pune (306 took 16 min), choose a KPI that shows the delivery problem.
Practice file (fictional): visuals_orders_apr_may_2026.csv
Hints
- Under-10 share.
Solution
% under 10 min for Pune = 1 of 3 = 33.3% (only 301) – a decision-ready KPI.
Thodkyaat sangaycha tar (quick recap)
First the user and their questions, then the layout; one neutral colour and highlight only what matters; and use text or icons along with colour. Now let us move on to reports and dashboards. When you pick a KPI, write the decision first. Total orders does not answer "which store is late". % under 10 minutes, the miss count and the cancellation rate do.
आधी user आणि त्यांचे प्रश्न, मग layout; एकच neutral रंग आणि फक्त महत्त्वाचं highlight; आणि रंगासोबत text/icons सुद्धा वापरा. आता पुढे जाऊया reports आणि dashboards कडे. KPI निवडताना decision आधी लिहा. Total orders हे "कोणता store late आहे" चं उत्तर नाही. % under 10 minutes, miss count आणि cancellation rate हे उत्तर आहे.
पहले user और उनके सवाल, फिर layout; एक neutral रंग और सिर्फ़ ज़रूरी चीज़ highlight; और रंग के साथ text/icons भी इस्तेमाल कीजिए. अब आगे बढ़ते हैं reports और dashboards की ओर. KPI चुनते समय decision पहले लिखिए. Total orders "कौन-सा store late है" का जवाब नहीं है. % under 10 minutes, miss count और cancellation rate जवाब हैं.
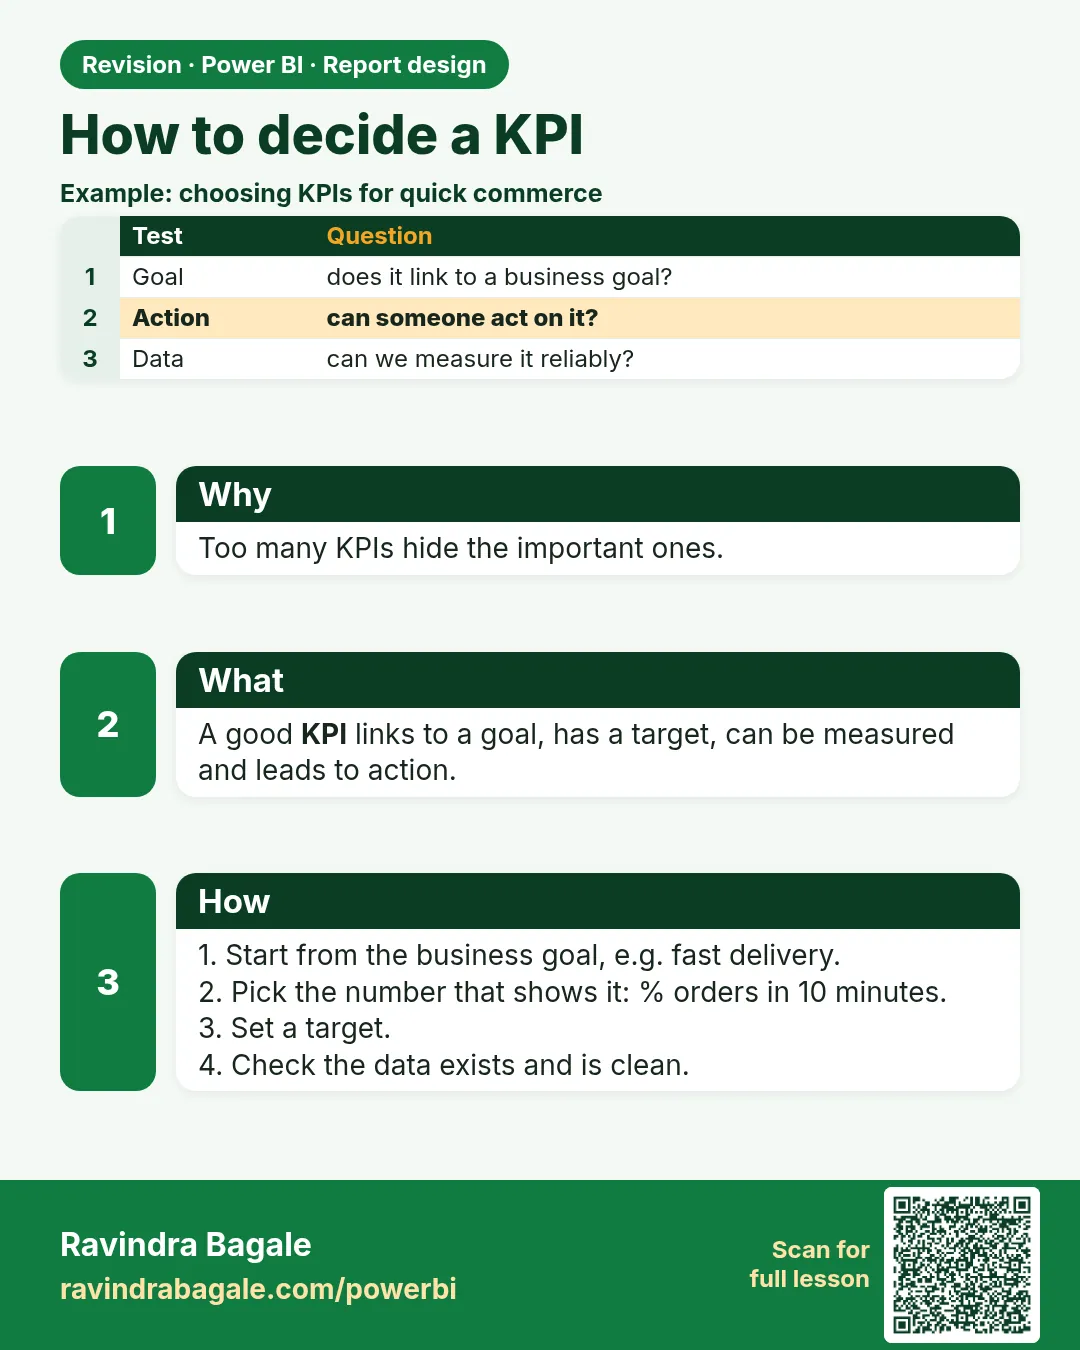 Revision card
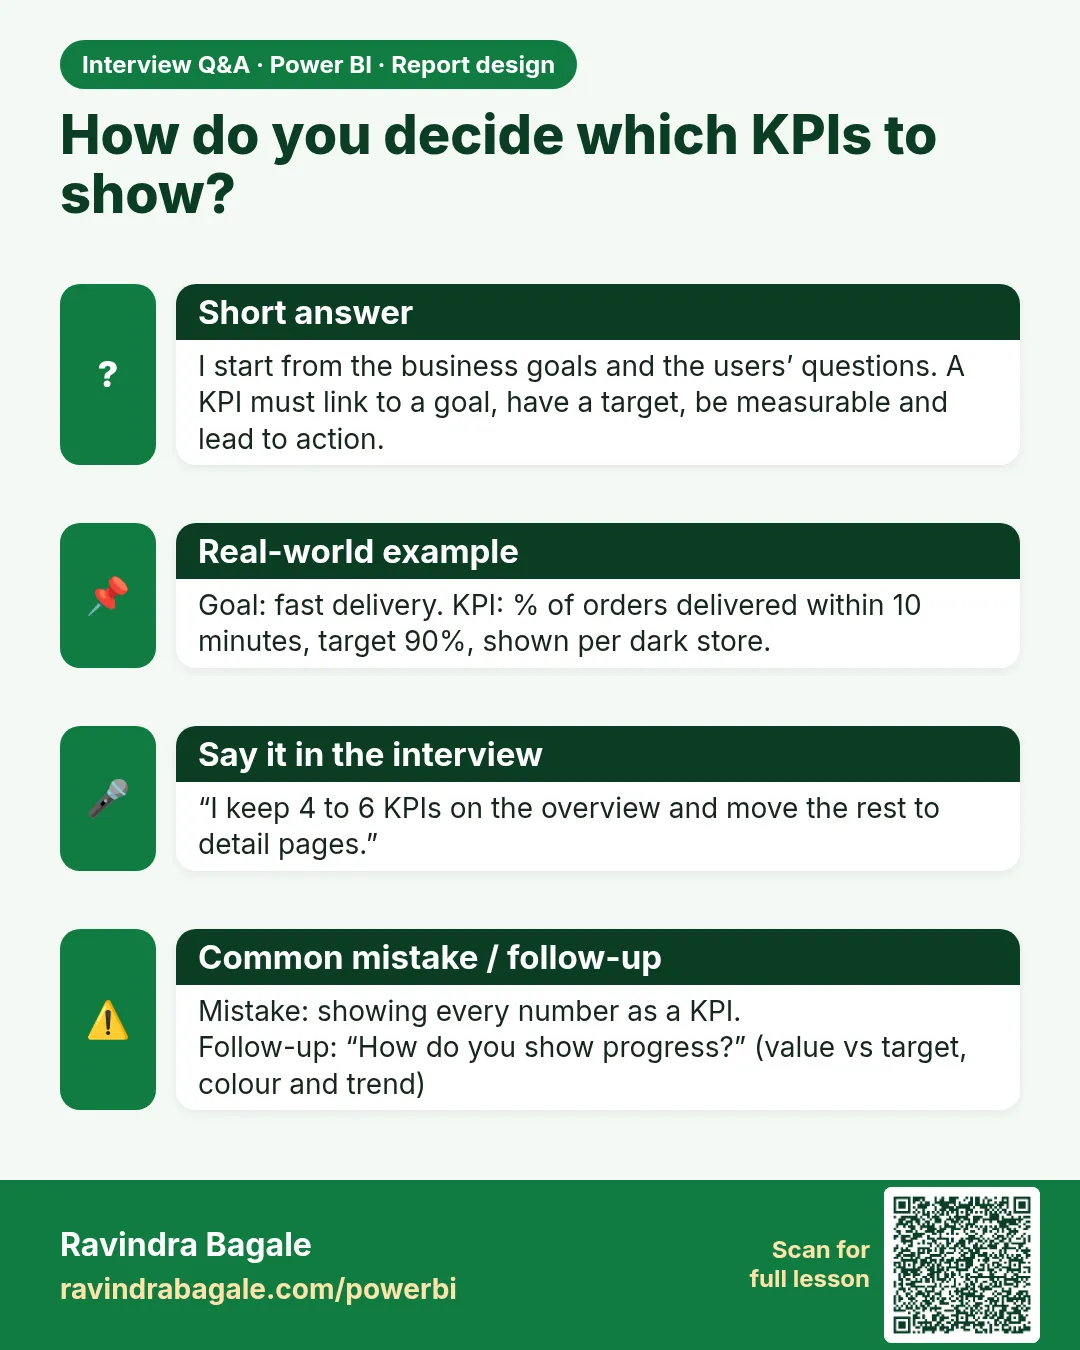 Interview card