23. Report and Dashboard Design Principles
23.6 Accessibility
In short: Accessibility is not a checklist you do after the colours are pretty.
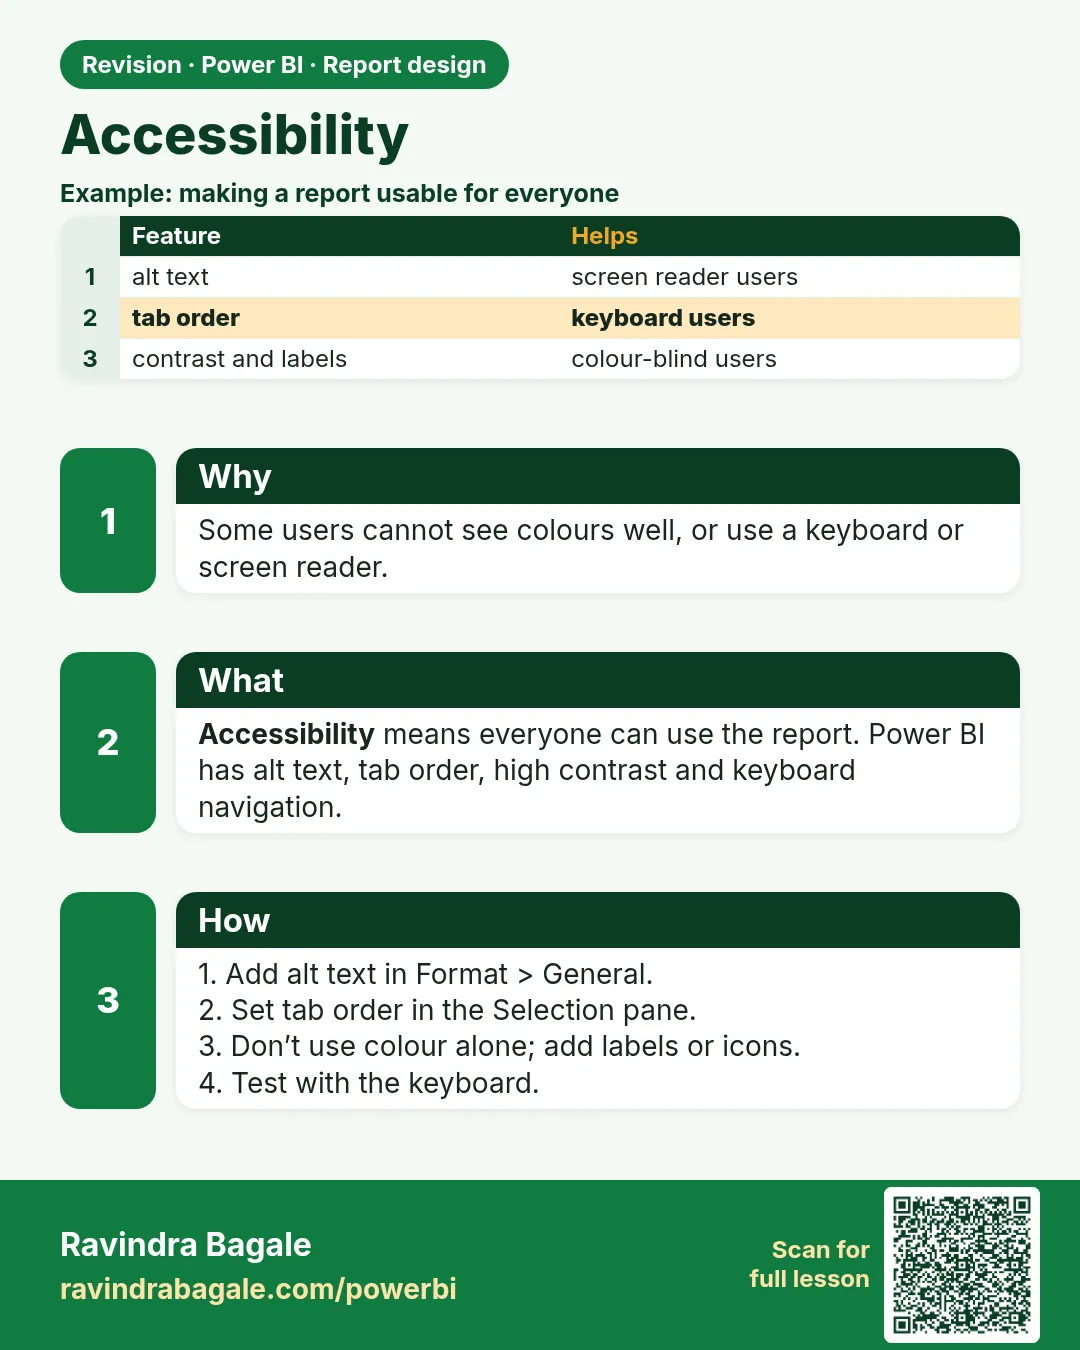
Accessible reports can be used by people with visual or motor impairments, and are simply clearer for everyone.
| Practice | How in Power BI |
|---|---|
| Alt text for visuals | Format › General › Alt text (can also use a measure for dynamic alt text) |
| Tab order for keyboard users | View › Selection › Tab order – arrange logical order; hide decorative shapes from tab order |
| Do not rely on colour alone | Add data labels, markers with different shapes, icons or text |
| Contrast | Dark text on light background (or vice versa); avoid light grey text |
| Readable font sizes | Avoid very small text; titles and labels large enough to read on a projector |
| Clear titles and labels | Every visual should be understandable on its own |
| Built-in accessible themes | Some built-in themes are designed with accessibility in mind (look for high-contrast/colour-blind friendly options) |
| Keyboard shortcuts | Users can press Alt + Shift + F11 to show a visual's data as a table |
About this data: This table uses columns: Practice, How in Power BI. This table uses columns: Wrong result, Reason, Correction. Values shown are the lesson examples already on this page (not a new dataset).
Accessibility is not a checklist you do after the colours are pretty. It is how the decision survives contact with a real room. The Monday call may be a laptop, a phone at the counter, or a projector. Shraddha may be walking the store. Someone in the room may not separate red from green. If the only sign of "late" is a red bar, that person does not get the name, and the business quietly depends on whoever can see the hue.
Say the rate in text. "66.7%, 4 of 6" still works when the colour does not. Alt text is the same sentence for someone who hears the page instead of seeing it. Tab order is the path you already chose: title, the decision card, the comparison, the action. Decorative shapes stay out of that path so a keyboard user does not tour the logo.
The 5-second test below is the business test. If a classmate cannot say "Gangapur" after five seconds on the Nashik page, the page failed, no matter how correct the DAX is. Fix the page. Do not explain it for two minutes and call that a dashboard.
The 5-second test
Show your report page to someone for five seconds. If they cannot tell you the main message, simplify the page.
Ravindra Bagale's Tip
Friends, many students rely on colour alone (red/green) to show good or bad, which colour-blind users can't see. Add icons, labels or text as well, check contrast, set alt text on visuals and set a sensible tab order in the Selection pane. Don't make this mistake!
Ravindra Bagale's Tip – मराठी
मित्रांनो, बरेच students चांगलं किंवा वाईट दाखवण्यासाठी फक्त रंगावर (लाल/हिरवा) अवलंबून राहतात, जे colour-blind users ना दिसत नाही. सोबत icons, labels किंवा text पण जोडा, contrast चेक करा, visuals वर alt text set करा आणि Selection pane मध्ये योग्य tab order set करा. ही चूक करू नका!
Ravindra Bagale's Tip – हिंदी
दोस्तों, बहुत से students अच्छा या बुरा दिखाने के लिए सिर्फ़ रंग (लाल/हरा) पर निर्भर रहते हैं, जो colour-blind users नहीं देख पाते. साथ में icons, labels या text भी जोड़ो, contrast check करो, visuals पर alt text set करो और Selection pane में सही tab order set करो. यह गलती मत करना!
Fix common mistakes
| Wrong result | Reason | Correction |
|---|---|---|
| Red/green only for status | Colour-blind users cannot tell | Add icons or text labels |
| Screen reader reads visual | No alt text | Set alt text: Bar chart, Pune ₹850 highest |
Practise independently
Practice task
Write alt text for the City chart.
Practice file (fictional): visuals_orders_apr_may_2026.csv
Hints
- Name chart type, top item, scale.
Solution
Bar chart of sales by city: Pune ₹850, Nashik ₹800, Kolhapur ₹450 (fictional).
 Revision card