23. Report and Dashboard Design Principles
23.1 Start With the Audience and Questions
Quick answer: the short, self-contained version of this lesson is the guide Power BI Report Layout Design.
Report design starts with the audience — example — in 30 seconds
What: Good design starts with who reads the report and which questions they ask. Charts come last.
Why: A page with 12 visuals looks busy. The state head needs 4 answers in 5 seconds.
Tiny example: Question "Where are deliveries late?" → one bar chart of % late by city, sorted high to low.
Report design starts with the audience — example — 30 सेकंदात
काय: चांगलं design report कोण वाचतं आणि ते कोणते प्रश्न विचारतात इथून सुरू होतं. Charts शेवटी येतात.
का: 12 visuals असलेलं page गर्दीचं दिसतं. State head ना 5 सेकंदात 4 उत्तरं हवीत.
छोटं उदाहरण: प्रश्न "Deliveries कुठे late आहेत?" → शहरानुसार % late चा एक bar chart, मोठ्याकडून लहानाकडे sort केलेला.
Report design starts with the audience — example — 30 सेकंड में
क्या: अच्छा design इससे शुरू होता है कि report कौन पढ़ता है और वे कौन-से सवाल पूछते हैं. Charts आख़िर में आते हैं.
क्यों: 12 visuals वाला page भीड़ भरा दिखता है. State head को 5 सेकंड में 4 जवाब चाहिए.
छोटा उदाहरण: सवाल "Deliveries कहाँ late हैं?" → शहर के हिसाब से % late का एक bar chart, बड़े से छोटे sort किया हुआ.
First look at the data (before → after):
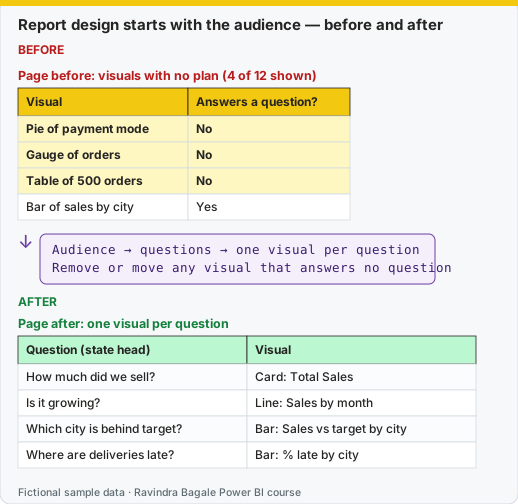
Same before / after tables as text
Before — Page before: visuals with no plan (4 of 12 shown)
| Visual | Answers a question? |
|---|---|
| Pie of payment mode | No |
| Gauge of orders | No |
| Table of 500 orders | No |
| Bar of sales by city | Yes |
About this data: This table uses columns: Visual, Answers a question?. This table uses columns: Question (state head), Visual. This table uses columns: Wrong result, Reason, Correction. Values shown are the lesson examples already on this page (not a new dataset).
Formula / click path
Audience → questions → one visual per question
Remove or move any visual that answers no question
After — Page after: one visual per question
| Question (state head) | Visual |
|---|---|
| How much did we sell? | Card: Total Sales |
| Is it growing? | Line: Sales by month |
| Which city is behind target? | Bar: Sales vs target by city |
| Where are deliveries late? | Bar: % late by city |
Do it step by step:
- Write the audience at the top of your page plan, for example "Blinkit Maharashtra state head".
- Write 3 to 5 questions in their words.
- Next to each question, write one KPI or one visual.
- Mark every visual on the current page that answers none of the questions.
- Delete those visuals or move them to a detail page.
- Do the 5-second test: can a new person find the answer to question 1 in 5 seconds?
एक-एक step करून बघा:
- तुमच्या page plan च्या वर audience लिहा, उदा. "Blinkit Maharashtra state head".
- त्यांच्या शब्दांत 3 ते 5 प्रश्न लिहा.
- प्रत्येक प्रश्नापुढे एक KPI किंवा एक visual लिहा.
- सध्याच्या page वरचा जो visual कुठल्याच प्रश्नाचं उत्तर देत नाही, त्यावर खूण करा.
- ते visuals delete करा किंवा detail page वर हलवा.
- 5-second test करा: नवीन माणसाला प्रश्न 1 चं उत्तर 5 सेकंदात सापडतं का?
एक-एक step करके देखिए:
- अपने page plan के ऊपर audience लिखिए, जैसे "Blinkit Maharashtra state head".
- उनके शब्दों में 3 से 5 सवाल लिखिए.
- हर सवाल के आगे एक KPI या एक visual लिखिए.
- मौजूदा page का जो visual किसी सवाल का जवाब नहीं देता, उस पर निशान लगाइए.
- उन visuals को delete कीजिए या detail page पर ले जाइए.
- 5-second test कीजिए: नए व्यक्ति को सवाल 1 का जवाब 5 सेकंड में मिलता है?
Before opening Power BI, ask:
- Who will use the report? (CEO, city manager, dark store staff)
- What decisions will they make with it?
- Which 3–5 KPIs matter most to them?
- How often will they look at it, and on which device?
The dashboard exists because someone has to act before the next peak, not because a page was empty. In this course the peak is lunch and evening in a Maharashtra dark store, in IST. The person acting is a city manager or the operations lead. If the page does not change what they do before that peak, the business got a picture. It did not get a decision.
Think about what the business actually receives when the page is right.
- A name. Not "sales are fine". A store, a city, or a platform.
- A size. Two late deliveries is a conversation. Twenty is a staffing plan. The page has to show which one it is.
- A shared meaning. "Late" means the same thing in Pune and in Nashik: a delivered order outside the 10-minute promise. If one person counts every order and another counts only delivered orders, they will argue from the same file and both sound sure.
- A stop. The things that do not change today's action stay off the first screen. That is a gift to the reader, not a missing feature.
Think about what the business receives when the page is wrong. The Monday call starts from the biggest number. The biggest number in a busy week is often total orders. The store that needs a rider is not always the store with the most orders. A rider moves to the loud card. The quiet late store waits until a customer complains. That is the whole cost. It is larger than an ugly colour.
So the four questions at the top of this section are not a form to fill before you are "allowed" to click. They are how you protect that Monday.
- Who changes the grain. Rani, looking across cities, can live with a city bar for the first ten seconds. Shraddha Bagale in Nashik cannot. Her job is a dark store. Ravindra Bagale in Pune has the same job on different stores. A page drawn for Rani and handed to Shraddha will look complete and still hide Gangapur inside a Nashik bar.
- What decision changes the maths. "Are we inside the promise?" needs a rate with a denominator you can say out loud. "Were we busy?" needs a count. Mixing them on one card is how a vanity metric gets a title.
- Which 3–5 KPIs is a limit, not a challenge to reach five. Three that change the decision beat eight that describe the business. Section 23.8 walks one decision down to three, on Nashik rows you can add by hand.
- How often, and on which device changes density. A phone at a dark-store counter gets the cards. A laptop in the Monday call can take one more chart. Neither device gets a gallery.
A report that answers clear questions for a specific audience is nehmi more useful than one with many charts. The charts are the evidence. The question is the product.
Ravindra Bagale's Tip
Friends, many students design for themselves instead of the audience, and a city manager gets a page full of technical detail. Write down who will use each page and the three questions they ask every morning, and design only for those. Don't worry – after doing it two or three times, it becomes a habit.
Ravindra Bagale's Tip – मराठी
मित्रांनो, बरेच students audience साठी नाही तर स्वतःसाठी design करतात, आणि city manager ला technical तपशीलाने भरलेलं page मिळतं. प्रत्येक page कोण वापरणार आणि ते रोज सकाळी कोणते तीन प्रश्न विचारतात ते लिहून काढा, आणि फक्त त्यांच्यासाठीच design करा. घाबरू नका, दोन-तीन वेळा केलं की सवय होते.
Ravindra Bagale's Tip – हिंदी
दोस्तों, बहुत से students audience के लिए नहीं बल्कि अपने लिए design करते हैं, और city manager को technical details से भरा page मिलता है. लिखो कि हर page कौन इस्तेमाल करेगा और वे हर सुबह कौन से तीन सवाल पूछते हैं, और सिर्फ़ उन्हीं के लिए design करो. घबराओ मत, दो-तीन बार करने पर आदत हो जाती है.
Fix common mistakes
| Wrong result | Reason | Correction |
|---|---|---|
| Page full of technical columns | Designed for yourself | List the user and their 3 questions first |
| Manager cannot find Kolhapur | No city filter in view | Add a City slicer in the header |
Practise independently
Practice task
Write the three morning questions for Zoya (Kolhapur manager) and pick one visual for each.
Practice file (fictional): visuals_orders_apr_may_2026.csv
Hints
- Sales, delivery speed, cancellations.
Solution
Total Sales card (₹450), Avg delivery card (7.0 min), Cancellation rate card (1 of 2 = 50%).
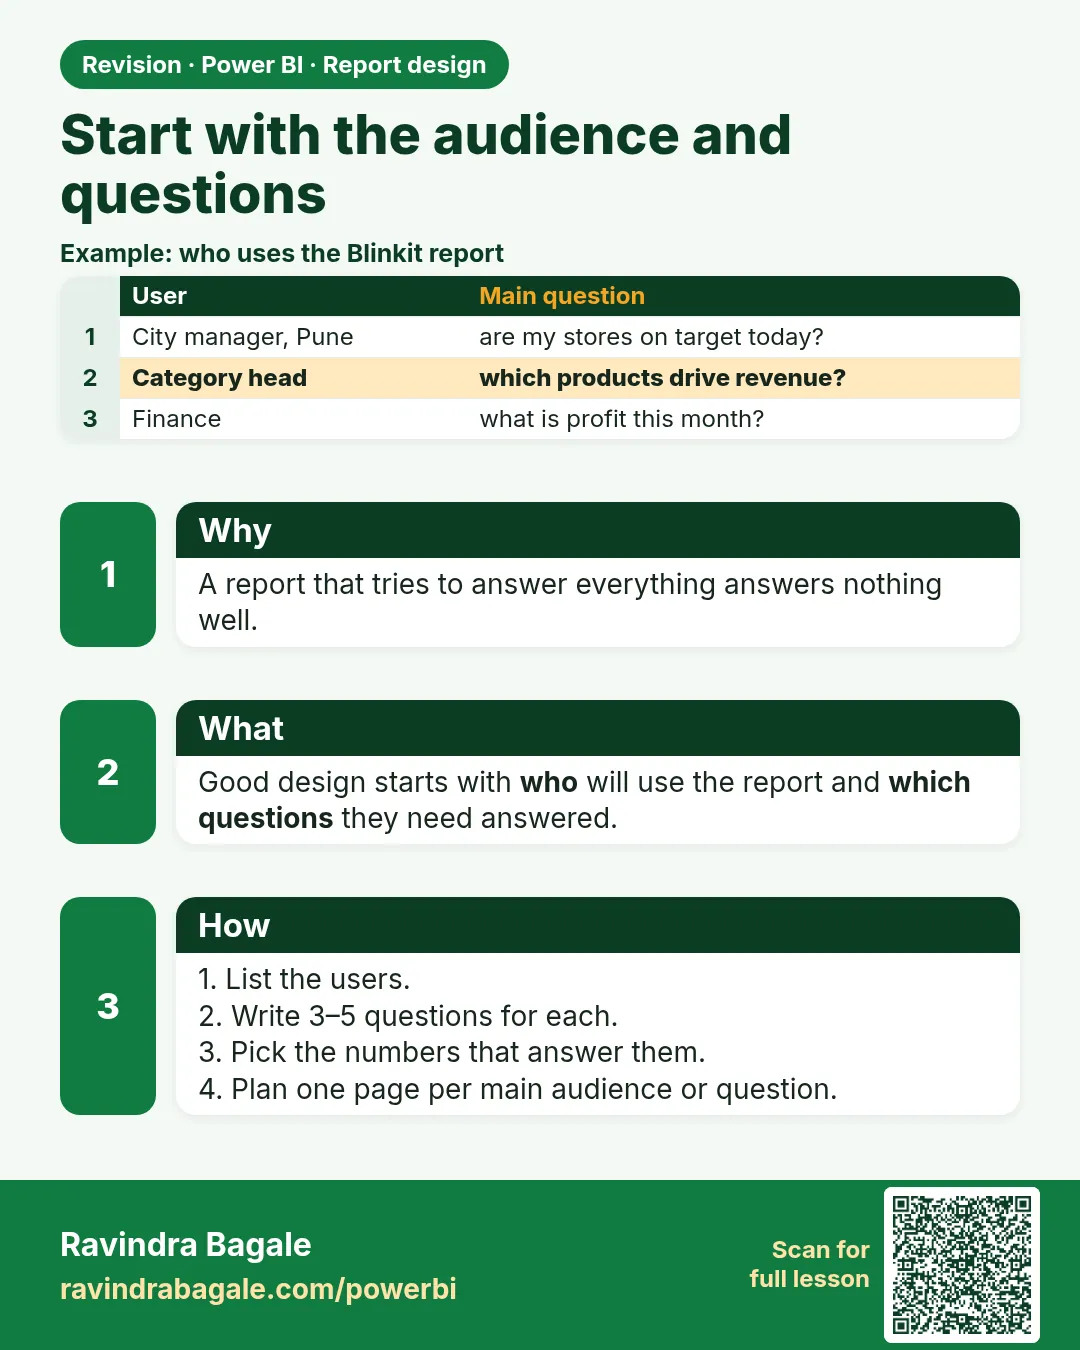 Revision card