18.3 Report Page Tooltips
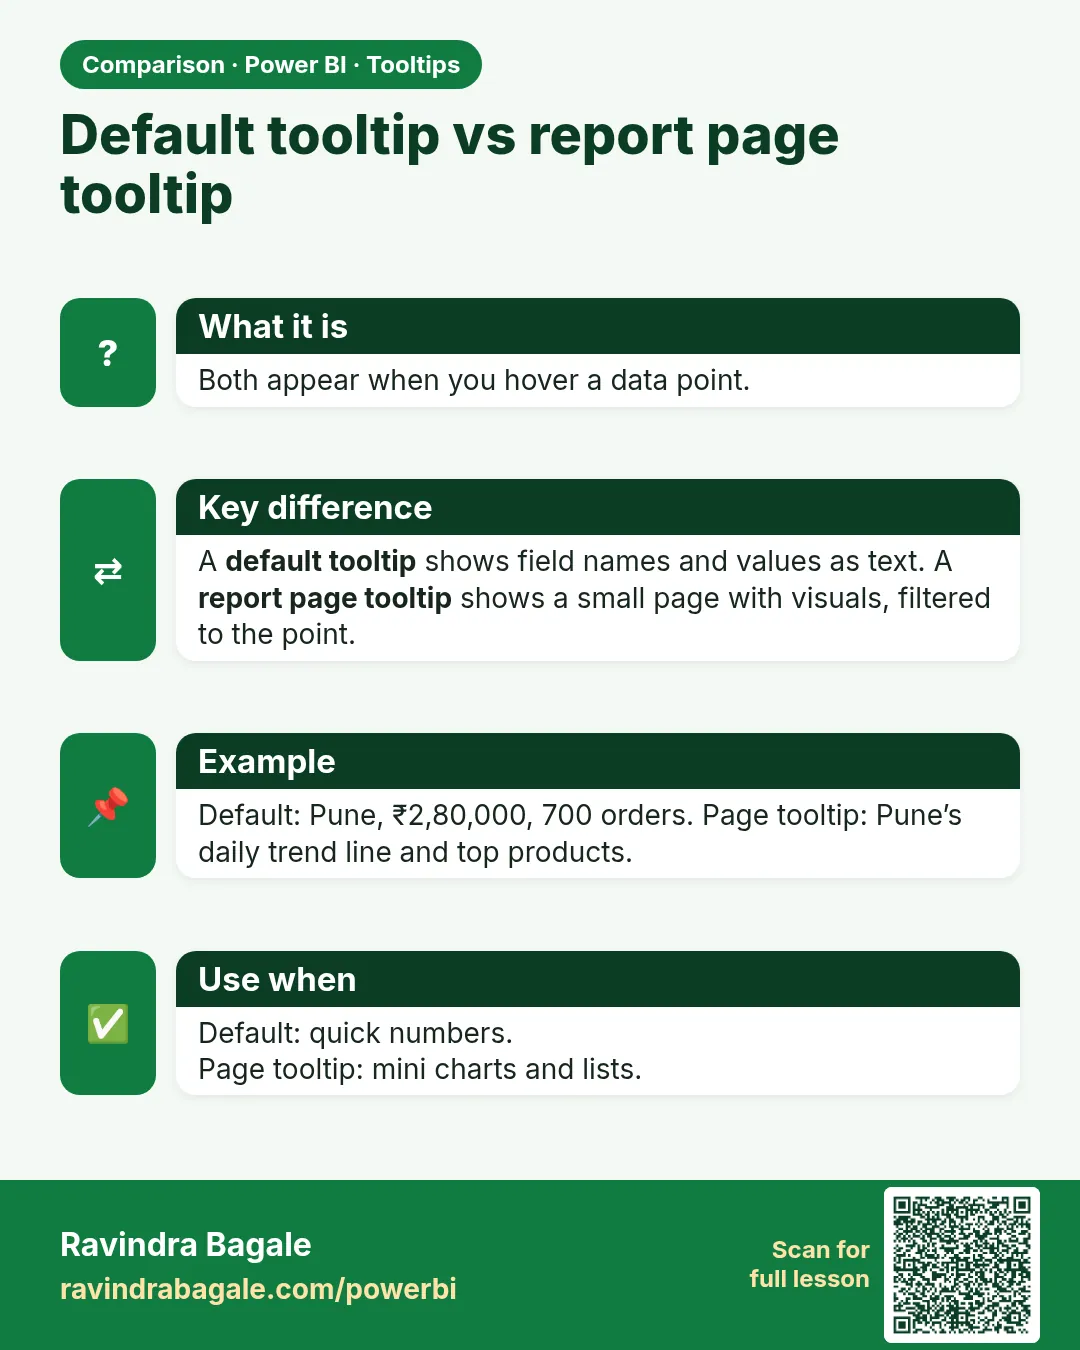
In short: A report page tooltip is a small page designed as a tooltip.
Quick answer: the short, self-contained version of this lesson is the guide Power BI Report Page Tooltips.
Start with a problem
Rani wants a mini dashboard to pop up when she hovers a city: four KPI numbers in a neat card.
Explain simply
A report page tooltip is a small page designed as a tooltip. When users hover a visual, Power BI shows that page filtered to the hovered point.
Show the data
| City | Orders | Total Sales (₹) | Avg delivery mins (delivered) | Under 10 min |
|---|---|---|---|---|
| Pune | 3 | 850 | 12.0 | 1 of 3 |
| Nashik | 3 | 800 | 11.3 | 1 of 3 |
| Kolhapur | 2 | 450 | 7.0 | 1 of 1 |
| Total | 8 | 2,100 | 11.0 | 3 of 7 |
About this data: This table uses columns: City, Orders, Total Sales (₹), Avg delivery mins (delivered), Under 10 min. This table uses columns: Hover Nashik, Value. This table uses columns: Hover on, Tooltip shows. This table uses columns: Card on the tooltip page, Pune value. Values shown are the lesson examples already on this page (not a new dataset).
Fictional sample data. Practice file: visuals_orders_apr_may_2026.csv (source: src/practice/).
Demonstrate
- New page › rename TT City.
- Format page › Canvas settings › Type › Tooltip (small size).
- Format page › Page information › Allow use as tooltip › On.
- Add four cards:
Total Orders,Total Sales,Avg Delivery Mins,% Under 10. - Go to the City chart › Format › General › Tooltips › Type: Report page › Page: TT City.
- Hide the TT City page; hover Nashik.
Show the result
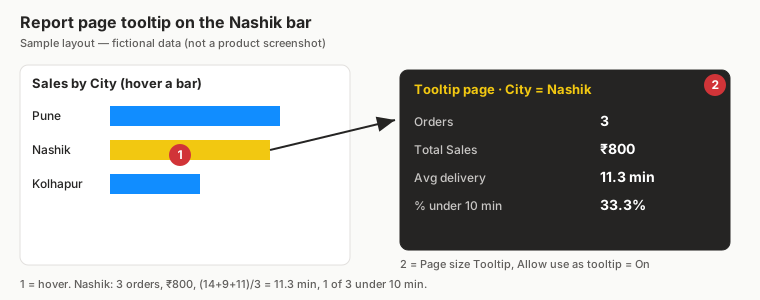
Your result should look like this (fictional sample):
| Hover Nashik | Value |
|---|---|
| Orders | 3 |
| Total Sales | ₹800 |
| Avg delivery | 11.3 min |
| % under 10 min | 33.3% |
Explain what happened
The hovered City is passed as a filter to the tooltip page, so every card shows Nashik values.
Explore further
- Add a tooltip field in the tooltip page's Tooltip well to restrict which visuals use it automatically.
Detailed reference for this lesson:
Report page tooltip in Power BI with example — in 30 seconds
What: A report page tooltip is a small report page that pops up when you hover over a data point.
Why: The bar shows only Pune sales. On hover the manager also wants orders, AOV and delivery time.
Tiny example: Hover over Pune: a mini page shows Orders 3, AOV ₹300 and Avg delivery 9.5 minutes.
Report page tooltip in Power BI with example — 30 सेकंदात
काय: Report page tooltip म्हणजे data point वर mouse नेल्यावर pop-up होणारं छोटं report page.
का: Bar फक्त Pune चा sales दाखवतो. Hover केल्यावर manager ना orders, AOV आणि delivery time पण हवेत.
छोटं उदाहरण: Pune वर hover करा: एक छोटं page Orders 3, AOV ₹300 आणि Avg delivery 9.5 मिनिटं दाखवतं.
Report page tooltip in Power BI with example — 30 सेकंड में
क्या: Report page tooltip एक छोटा report page है जो data point पर mouse ले जाने पर pop-up होता है.
क्यों: Bar सिर्फ़ Pune की sales दिखाता है. Hover करने पर manager को orders, AOV और delivery time भी चाहिए.
छोटा उदाहरण: Pune पर hover कीजिए: एक छोटा page Orders 3, AOV ₹300 और Avg delivery 9.5 मिनट दिखाता है.
First look at the data (before → after):
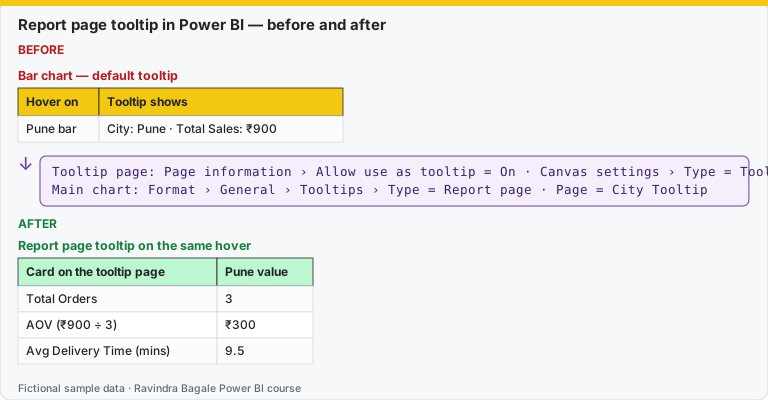
Same before / after tables as text
Before — Bar chart — default tooltip
| Hover on | Tooltip shows |
|---|---|
| Pune bar | City: Pune · Total Sales: ₹900 |
Formula / click path
Tooltip page: Page information › Allow use as tooltip = On · Canvas settings › Type = Tooltip
Main chart: Format › General › Tooltips › Type = Report page · Page = City Tooltip
After — Report page tooltip on the same hover
| Card on the tooltip page | Pune value |
|---|---|
| Total Orders | 3 |
| AOV (₹900 ÷ 3) | ₹300 |
| Avg Delivery Time (mins) | 9.5 |
Do it step by step:
- Add a page. Name it City Tooltip.
- In Format page › Page information, turn on Allow use as tooltip.
- In Canvas settings, set Type = Tooltip.
- Add three cards: Total Orders, AOV and Avg Delivery Time (mins).
- Go back to the main chart. In Format › General › Tooltips, set Type = Report page and Page = City Tooltip.
- Hover over Pune. Check: 3, ₹300 and 9.5.
एक-एक step करून बघा:
- एक page जोडा. नाव City Tooltip द्या.
- Format page › Page information मध्ये Allow use as tooltip चालू करा.
- Canvas settings मध्ये Type = Tooltip set करा.
- तीन cards टाका: Total Orders, AOV आणि Avg Delivery Time (mins).
- मुख्य chart वर परत जा. Format › General › Tooltips मध्ये Type = Report page आणि Page = City Tooltip set करा.
- Pune वर hover करा. तपासा: 3, ₹300 आणि 9.5.
एक-एक step करके देखिए:
- एक page जोड़िए. नाम City Tooltip रखिए.
- Format page › Page information में Allow use as tooltip चालू कीजिए.
- Canvas settings में Type = Tooltip set कीजिए.
- तीन cards लगाइए: Total Orders, AOV और Avg Delivery Time (mins).
- मुख्य chart पर वापस जाइए. Format › General › Tooltips में Type = Report page और Page = City Tooltip set कीजिए.
- Pune पर hover कीजिए. जाँचिए: 3, ₹300 और 9.5.
A report page tooltip is a mini report page that appears on hover, filtered to the hovered item.
Steps in Power BI – "City snapshot" tooltip
- Add a new page and rename it TT City Snapshot.
- Click an empty area of the canvas › Format page (paintbrush with no visual selected).
- Page information › Allow use as tooltip = On.
- Canvas settings › Type = Tooltip (a small canvas, 320 × 240 pixels). Choose Custom for a different size, but keep it small. Set Vertical alignment to Top.
- Optionally set Canvas background colour and transparency.
- Build small visuals: a card for Avg Delivery Time (mins), a card for % Delivered Under 10 Mins, and a small column chart of Total Orders by Order Hour. Keep titles short.
- In the Build visual pane of the tooltip page (no visual selected), drag
DarkStore[City]into the Tooltip fields well (Add tooltip fields here). The page then appears automatically for any visual that uses City. - Go back to the main page › select "Orders by City" › Format visual › General › Tooltips › Type = Report page, Page = TT City Snapshot (or Auto).
- Right-click the tooltip page tab › Hide page.
- Hover over Nashik. The mini page appears, filtered to Nashik.
A report page tooltip needs a little setup, but users get a lot out of it. Build one at least once.
Report page tooltip ला थोडा setup लागतो, पण user ला त्याचा खूप फायदा होतो. एकदा नक्की बनवून बघा.
Report page tooltip के लिए थोड़ा setup चाहिए, पर user को इसका बहुत फ़ायदा होता है. एक बार ज़रूर बनाकर देखिए.
Ravindra Bagale's Tip
Look, friends: if the tooltip page isn't listed, Allow use as tooltip is off. If it shows totals for all cities, the field used on the tooltip page isn't in the main visual, so add City to the Tooltip fields well. Keep tooltip pages small with few visuals, or they will be slow and cover the report. It's very simple – just make it a habit.
Ravindra Bagale's Tip – मराठी
हे बघा मित्रांनो: tooltip page list मध्ये दिसत नसेल तर Allow use as tooltip बंद आहे. तो सगळ्या cities चे totals दाखवत असेल तर tooltip page वर वापरलेलं field main visual मध्ये नाही, म्हणून City ला Tooltip fields well मध्ये जोडा. Tooltip pages लहान आणि कमी visuals असलेली ठेवा, नाहीतर ती slow होतात आणि report झाकतात. एकदम simple आहे, फक्त सवय लावून घ्या.
Ravindra Bagale's Tip – हिंदी
देखो दोस्तों: tooltip page list में न दिखे तो Allow use as tooltip बंद है. अगर वह सभी cities के totals दिखाए तो tooltip page पर इस्तेमाल हुआ field main visual में नहीं है, इसलिए City को Tooltip fields well में जोड़ो. Tooltip pages छोटे और कम visuals वाले रखो, वरना वे slow होंगे और report को ढक देंगे. बहुत आसान है, बस आदत बना लो.
Fix common mistakes
| Wrong result | Reason | Correction |
|---|---|---|
| Tooltip page not listed | Allow use as tooltip Off | Turn it On |
| Tooltip shows all-city totals | Cards use a field not related to the hovered field | Fix the relationship or use the same field |
| Tooltip page visible to users | Not hidden | Hide the page |
Practise independently
Practice task
Hover Pune. Write the four card values.
Hints
- Pune: 301, 302, 306.
Solution
Orders 3, Sales ₹850, Avg 12.0 min, % under 10 33.3%.
Think like a professional
Report page tooltips give managers detail without leaving the page – a polished touch interviewers notice in portfolios.
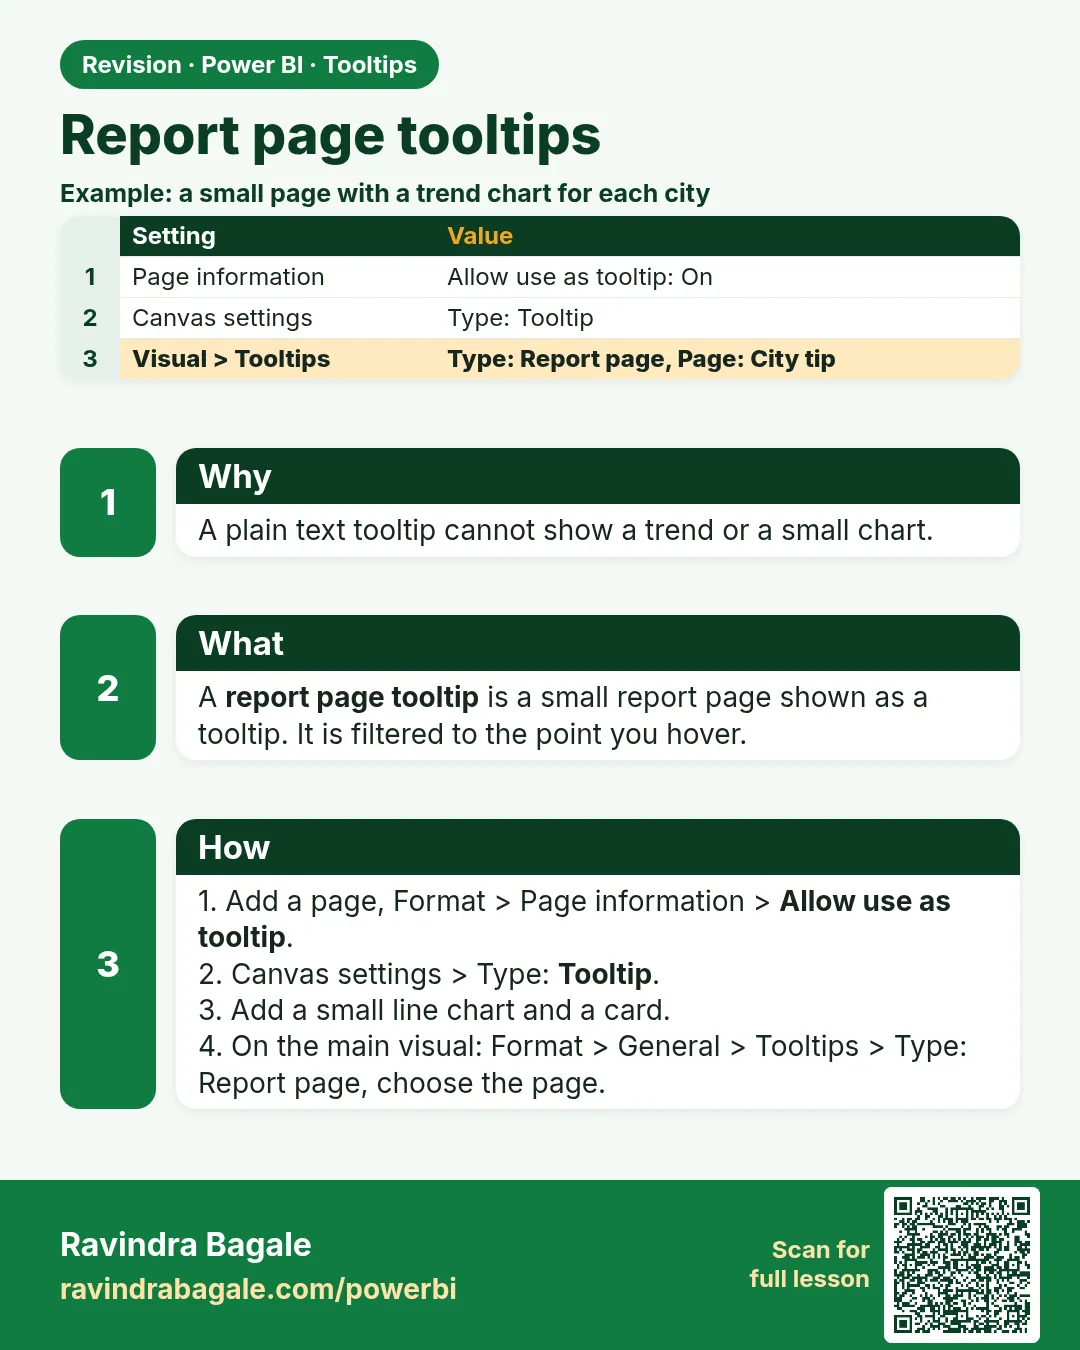 Revision card
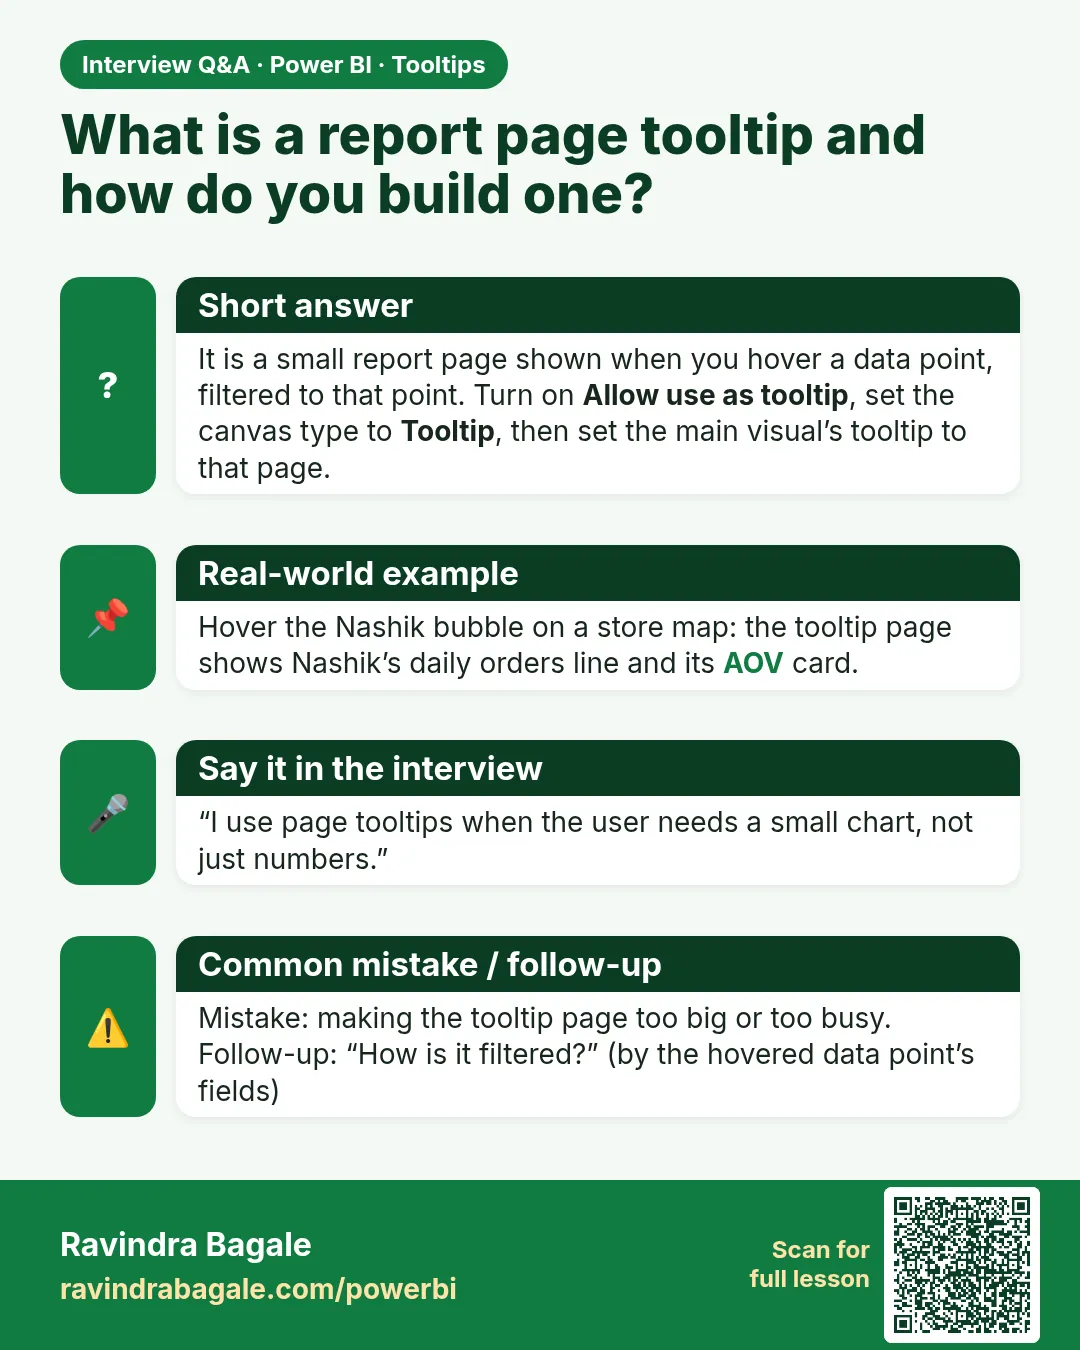 Interview card
 Comparison card