16.6 Tips for Drill-friendly Reports
In short: A drill-friendly report tells users which level they are on, keeps the drill path short, and gives a clear way back.
Start with a problem
Shahrukh built drill features on every chart, but users get lost and call him to ask where they are.
Explain simply
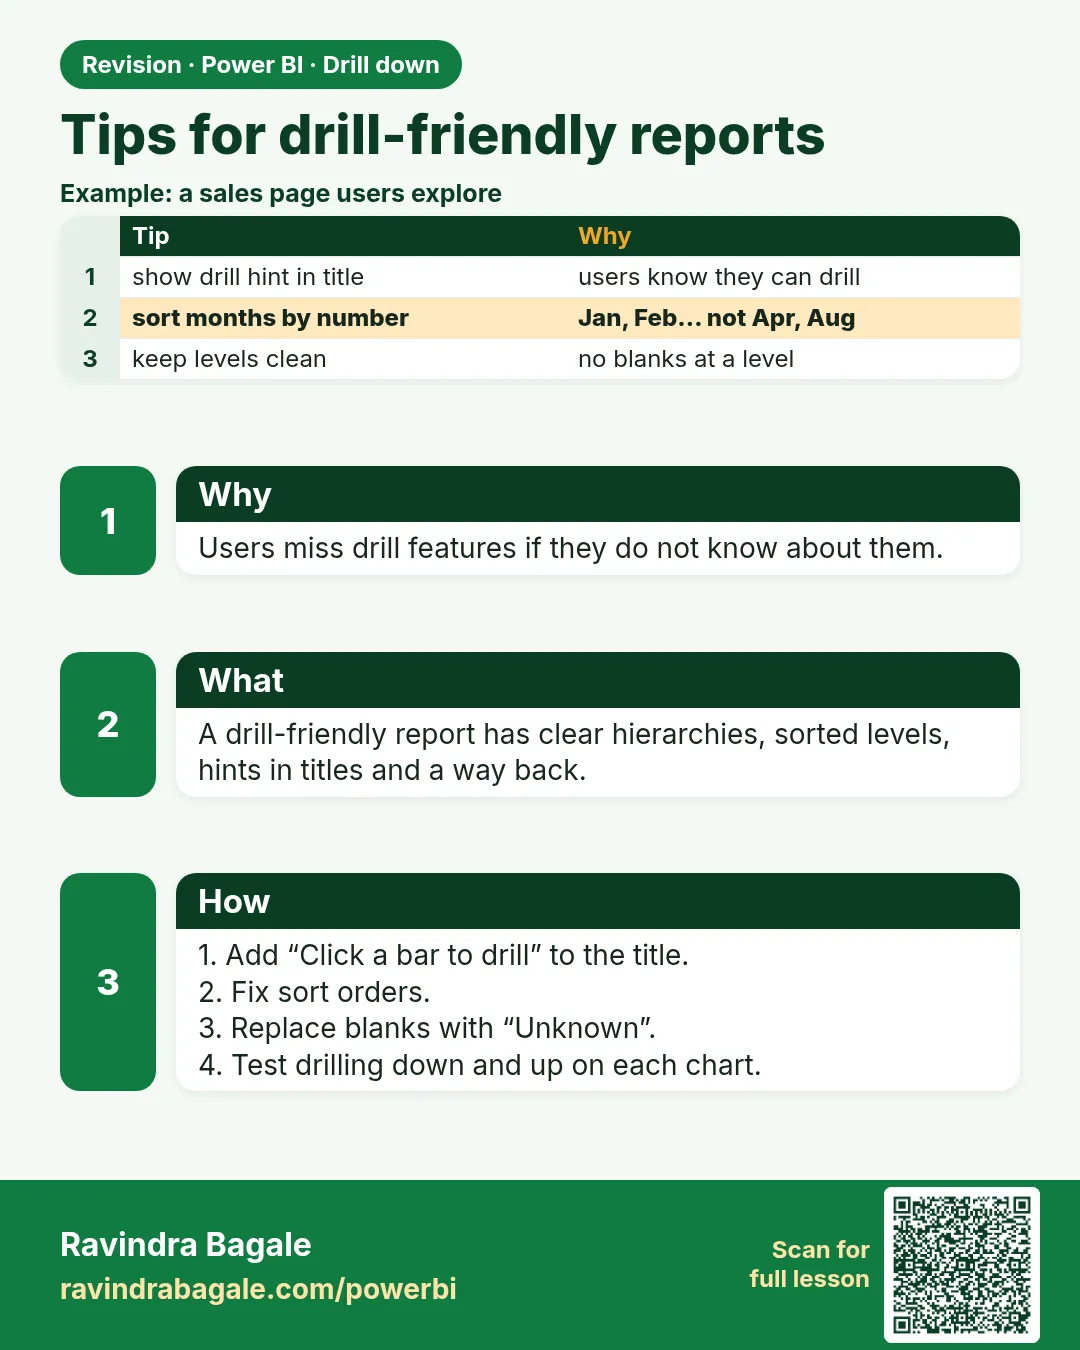
A drill-friendly report tells users which level they are on, keeps the drill path short, and gives a clear way back.
Show the data
| Tip | Example |
|---|---|
| Dynamic title shows level | "Sales by Store – Pune" |
| Max 3 levels | City, then Store, then Category |
| Short note | "Use ↓ on the chart to drill" |
About this data: This table uses columns: Tip, Example. This table uses columns: Level, Title. This table uses columns: Wrong result, Reason, Correction. Values shown are the lesson examples already on this page (not a new dataset).
Fictional sample data. Practice file: visuals_orders_apr_may_2026.csv (source: src/practice/).
Demonstrate
- Create
Drill Title = "Sales by " & IF(ISINSCOPE(Orders[Store]), "Store – " & SELECTEDVALUE(Orders[City]), "City"). - Chart › Format › General › Title › fx › Field value ›
Drill Title. - Add a small text box: Use ↓ to drill; ↑ to go back.
- Test: drill into Pune; the title should change.
Show the result
Your result should look like this (fictional sample):
| Level | Title |
|---|---|
| City | Sales by City |
| Store (Pune) | Sales by Store – Pune |
Explain what happened
ISINSCOPE returns TRUE when the visual is grouping by Store, so the title switches when you drill.
Explore further
- Drill-through (Module 17) is better than deep drill for detail pages.
Detailed reference for this lesson:
- Tell users that drilling exists: add a subtitle "Use ↓ to drill into areas and stores".
- Drill works per visual. Other visuals on the page are not drilled, but they are filtered if you click a bar in drill mode (cross-filter).
- Drill state can be saved in a bookmark (Module 19), for example "Pune areas view".
- In the Service, the drill icons appear on hover. Viewers may need Header icons visible (General › Header icons).
- Keep hierarchies short (3–4 levels) and levels unique (Store Name should be unique).
Practice task
Simple bhashet sangaycha tar, create a matrix with Product hierarchy rows and Date hierarchy columns. (a) Expand only Dairy & Breakfast. (b) Expand all columns to Quarter, keeping years. (c) Exclude Personal Care. (d) Explain to Ruhi why Go to next level on Month gives different numbers from Expand all down.
Ravindra Bagale's Tip
Friends, many students build drill paths so deep (Region › City › Area › Store › Product › Day) that users get lost. Keep hierarchies to three or four levels, and use drill-through for the detailed view instead of drilling ever deeper. Don't make this mistake!
Ravindra Bagale's Tip – मराठी
मित्रांनो, बरेच students इतके खोल drill paths बनवतात (Region › City › Area › Store › Product › Day) की users हरवून जातात. Hierarchies तीन-चार levels पर्यंतच ठेवा, आणि आणखी खोल drill करत राहण्याऐवजी तपशीलवार view साठी drill-through वापरा. ही चूक करू नका!
Ravindra Bagale's Tip – हिंदी
दोस्तों, बहुत से students इतने गहरे drill paths बनाते हैं (Region › City › Area › Store › Product › Day) कि users खो जाते हैं. Hierarchies तीन-चार levels तक ही रखो, और और गहरा drill करते रहने की जगह detailed view के लिए drill-through इस्तेमाल करो. यह गलती मत करना!
Fix common mistakes
| Wrong result | Reason | Correction |
|---|---|---|
| Title says *Store – * with nothing | Several cities in scope (next level) | Use a fallback text in SELECTEDVALUE, e.g. "All cities" |
| Users drill five levels deep | Too long a path | Limit to three levels |
| Title never changes | Static title | Use fx with the measure |
Practise independently
Practice task
What title shows after Go to the next level (all stores)?
Hints
- SELECTEDVALUE with several cities returns blank or the fallback.
Solution
With SELECTEDVALUE(Orders[City], "All cities") the title is Sales by Store – All cities.
Think like a professional
Usability is part of quality. Fewer support calls is a real result you can mention in an interview.
Thodkyaat sangaycha tar (quick recap)
Hierarchy first, then drill. If you use Go to the next level on Month, the years get mixed, so use Expand all down. Now let us move on to drill through.
आधी hierarchy, मग drill; Month वर Go to the next level केलं तर वर्षं mix होतात, म्हणून Expand all down वापरा. आता पुढे जाऊया drill through कडे.
पहले hierarchy, फिर drill; Month पर Go to the next level किया तो साल mix हो जाते हैं, इसलिए Expand all down इस्तेमाल कीजिए. अब आगे बढ़ते हैं drill through की ओर.
 Revision card