16.4 Matrix: Expand, Collapse and +/- Icons
Quick answer: the short, self-contained version of this lesson is the guide Power BI Matrix Visual.
Start with a problem
Rani opens a matrix and sees only cities. She cannot find the stores and thinks data is missing.
Explain simply
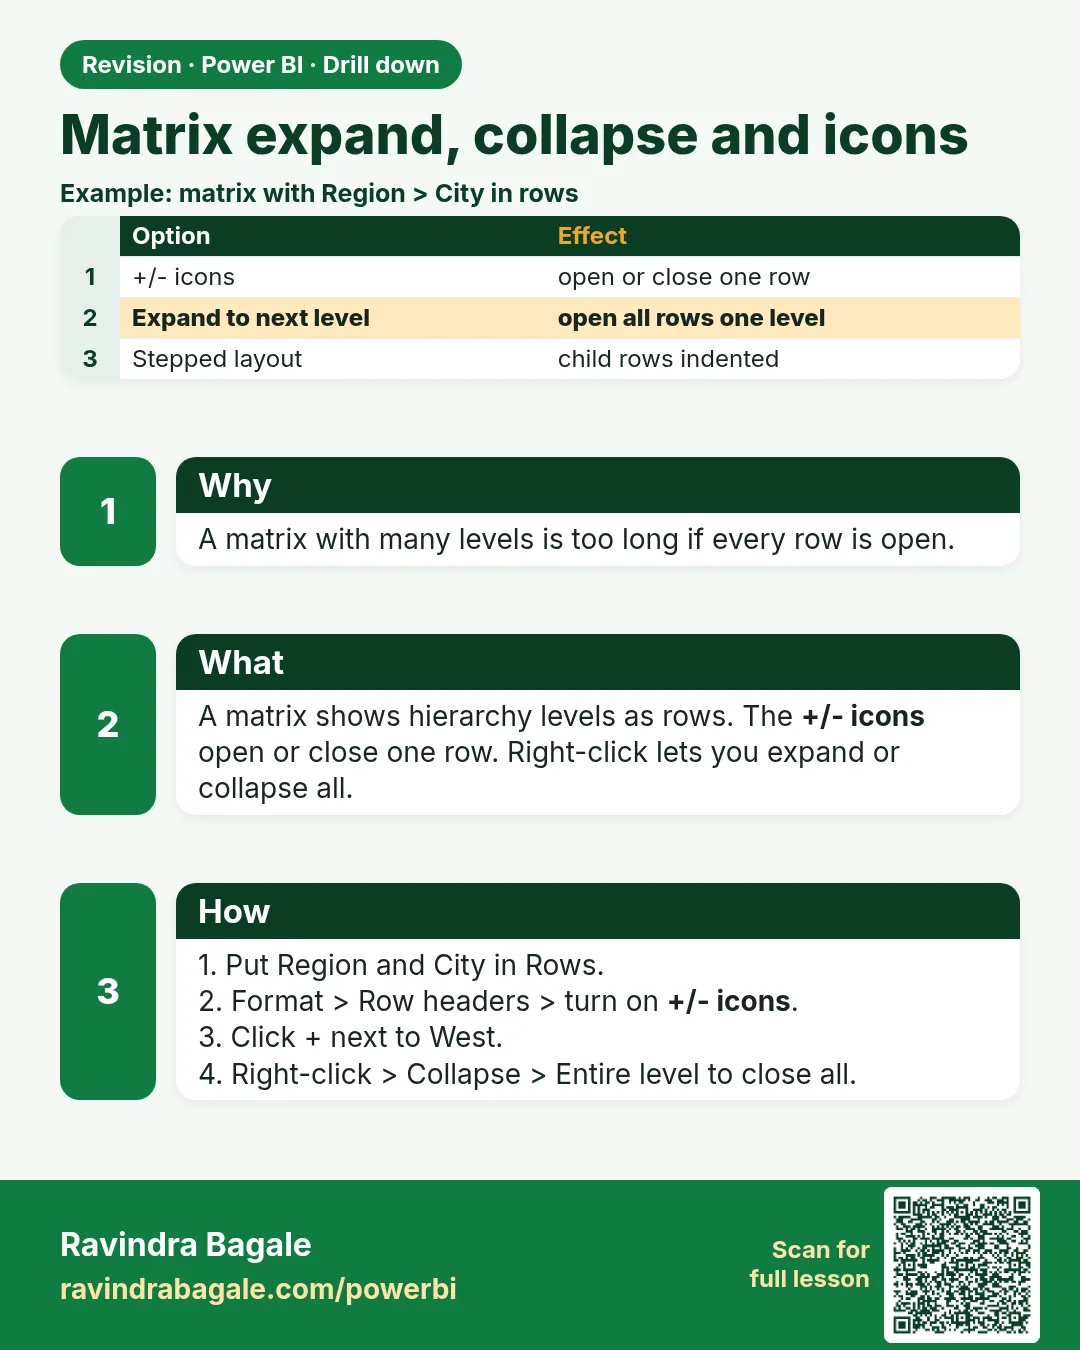
A matrix with several row fields can expand and collapse each parent with +/− icons, and show subtotals per level. The default expansion level is saved with the report.
Show the data
| City | Store | Total Sales (₹) |
|---|---|---|
| Pune | Kothrud | 650 |
| Pune | Baner | 200 |
| Nashik | College Road | 500 |
| Nashik | Gangapur | 300 |
| Kolhapur | Rajarampuri | 450 |
About this data: This table uses columns: City, Store, Total Sales (₹). This table uses columns: Row, Total Sales (₹). This table uses columns: Wrong result, Reason, Correction. Values shown are the lesson examples already on this page (not a new dataset).
Fictional sample data. Practice file: visuals_orders_apr_may_2026.csv (source: src/practice/).
Demonstrate
- Matrix: Rows
City, thenStore; ValuesTotal Sales. - Format › Visual › Row headers › +/- icons On.
- Click + next to Pune.
- Right-click › Expand › Entire level to open all cities.
- Collapse back to the level you want users to see first, then save.
Show the result
Your result should look like this (fictional sample):
| Row | Total Sales (₹) |
|---|---|
| Pune (subtotal) | 850 |
| — Kothrud | 650 |
| — Baner | 200 |
| Nashik (collapsed) | 800 |
| Kolhapur (collapsed) | 450 |
| Total | 2,100 |
Explain what happened
Each parent row shows a subtotal with only its City filter; children add the Store filter. Collapsing hides children but keeps the parent subtotal.
Explore further
- Stepped layout indents children; turn it off for a tabular look.
Detailed reference for this lesson:
A matrix with a hierarchy in Rows behaves slightly differently.
Steps in Power BI
- Insert a Matrix. Rows = Location hierarchy; Columns = Platform; Values = Total Orders, Avg Delivery Time (mins).
- Format visual › Visual › Row headers › Options › +/- icons = On. Each city now has a + to expand it on its own.
- Right-click a row header, e.g. Pune › Expand › Selection (only Pune) or Entire level (all cities). Collapse › Selection / Entire level works the same way.
- The header drill icons (↓ ⇊ ⤓ ↑) also work on the matrix. Expand all down shows the next level for every row, with subtotals.
- Row headers › Options › Stepped layout On (indented, compact) or Off (each level in its own column). Row subtotals › Per row level lets you turn subtotals on/off for City or Area separately.
- Put the hierarchy in Columns (e.g. Date hierarchy) and use the same icons to drill across columns (the drill header lets you choose Rows or Columns).
Ravindra Bagale's Tip
Friends, many students collapse the matrix before saving, and users think data is missing. Decide the default expansion level on purpose, and turn on the +/- icons so users can see that rows can be expanded. It's very simple – just make it a habit.
Ravindra Bagale's Tip – मराठी
मित्रांनो, बरेच students save करण्याआधी matrix collapse करतात, आणि users ना वाटतं data missing आहे. Default expansion level मुद्दाम ठरवा, आणि +/- icons चालू करा म्हणजे rows expand करता येतात हे users ना दिसेल. एकदम simple आहे, फक्त सवय लावून घ्या.
Ravindra Bagale's Tip – हिंदी
दोस्तों, बहुत से students save करने से पहले matrix को collapse कर देते हैं, और users को लगता है कि data missing है. Default expansion level सोच-समझकर तय करो, और +/- icons चालू करो ताकि users देख सकें कि rows expand हो सकती हैं. बहुत आसान है, बस आदत बना लो.
Fix common mistakes
| Wrong result | Reason | Correction |
|---|---|---|
| Users think stores are missing | Saved collapsed with no icons | Turn on +/- icons and choose the default level deliberately |
| Subtotal not equal to children sum | Non-additive measure | Expected for averages; explain in a note |
| Icons too small | Default size | Increase icon size in Row headers |
Practise independently
Practice task
Expand Nashik only. Write the rows shown.
Hints
- Nashik subtotal 800.
Solution
Pune 850 (collapsed), Nashik 800 → College Road 500, Gangapur 300, Kolhapur 450, Total 2,100.
Think like a professional
The saved expansion state is a design decision. Ask users which level they read first.
 Revision card