16.3 Drill Down vs Expand – the Difference
Start with a problem
Amir and Salman argue: one says drill down and expand are the same, the other says they give different totals.
Explain simply
Drill down replaces the current level with the next level (only children are shown). Expand shows the next level together with the parent, so labels combine (Pune Kothrud). Totals are the same; context and labels differ.
Show the data
| Mode | Labels | Number of bars |
|---|---|---|
| Drill down on Pune | Kothrud, Baner | 2 |
| Next level | 5 stores | 5 |
| Expand all | City + Store | 5 |
About this data: This table uses columns: Mode, Labels, Number of bars. This table uses columns: View, Sum of bars. This table uses columns: Year, Month, Sales (₹). This table uses columns: Month, Sales (₹). Values shown are the lesson examples already on this page (not a new dataset).
Fictional sample data. Practice file: visuals_orders_apr_may_2026.csv (source: src/practice/).
Demonstrate
- Start at City level.
- Use Drill mode and click Pune → 2 bars.
- Drill up, then Expand all down one level → 5 bars with City + Store labels.
- Compare both with a card of
Total Sales(₹2,100).
Show the result
Your result should look like this (fictional sample):
| View | Sum of bars |
|---|---|
| Drill on Pune | ₹850 |
| Expand all | ₹2,100 |
Explain what happened
Drill on Pune adds a City = Pune filter; expand does not filter, it just adds a level, so all cities stay.
Explore further
- In a matrix, expand shows subtotals for each parent (16.4).
Detailed reference for this lesson:
Drill down vs expand all in Power BI with example — in 30 seconds
What: "Go to the next level" shows only the next level, mixing parents. "Expand all down" keeps the parent with every child.
Why: If you go from Year to Month, January 2024 and January 2025 become one bar. The manager reads the wrong number.
Tiny example: Go to next level: Jan = ₹500 (two years together). Expand all down: 2024 Jan ₹200 and 2025 Jan ₹300.
Drill down vs expand all in Power BI with example — 30 सेकंदात
काय: "Go to the next level" फक्त पुढचा level दाखवतो, parents mix करून. "Expand all down" प्रत्येक child सोबत parent ठेवतो.
का: Year वरून Month वर गेलात तर January 2024 आणि January 2025 एकच bar होतात. Manager चुकीचा number वाचतात.
छोटं उदाहरण: Go to next level: Jan = ₹500 (दोन वर्षं एकत्र). Expand all down: 2024 Jan ₹200 आणि 2025 Jan ₹300.
Drill down vs expand all in Power BI with example — 30 सेकंड में
क्या: "Go to the next level" सिर्फ़ अगला level दिखाता है, parents को mix करके. "Expand all down" हर child के साथ parent रखता है.
क्यों: Year से Month पर गए तो January 2024 और January 2025 एक ही bar बन जाते हैं. Manager ग़लत number पढ़ते हैं.
छोटा उदाहरण: Go to next level: Jan = ₹500 (दो साल एक साथ). Expand all down: 2024 Jan ₹200 और 2025 Jan ₹300.
First look at the data (before → after):
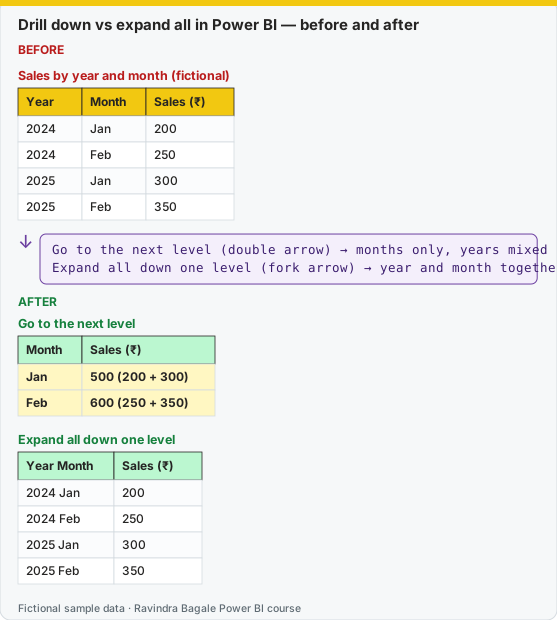
Same before / after tables as text
Before — Sales by year and month (fictional)
| Year | Month | Sales (₹) |
|---|---|---|
| 2024 | Jan | 200 |
| 2024 | Feb | 250 |
| 2025 | Jan | 300 |
| 2025 | Feb | 350 |
Formula / click path
Go to the next level (double arrow)  → months only, years mixed
Expand all down one level (fork arrow) → year and month together
After — Go to the next level
| Month | Sales (₹) |
|---|---|
| Jan | 500 (200 + 300) |
| Feb | 600 (250 + 350) |
After — Expand all down one level
| Year Month | Sales (₹) |
|---|---|
| 2024 Jan | 200 |
| 2024 Feb | 250 |
| 2025 Jan | 300 |
| 2025 Feb | 350 |
Do it step by step:
- Put the Date hierarchy (Year, Month) on the X-axis of a column chart.
- Hover over the chart. The drill icons appear at the top.
- Click Go to the next level (double arrow). Jan shows ₹500. That mixes 2024 and 2025.
- Click Drill up.
- Click Expand all down one level (fork arrow). 2024 Jan shows ₹200 and 2025 Jan shows ₹300.
- For one year only: turn on Drill down (single arrow), then click the 2025 bar.
एक-एक step करून बघा:
- Column chart च्या X-axis वर Date hierarchy (Year, Month) टाका.
- Chart वर mouse न्या. वर drill icons दिसतात.
- Go to the next level (double arrow) वर click करा. Jan ₹500 दाखवतो. त्यात 2024 आणि 2025 mix झालेत.
- Drill up वर click करा.
- Expand all down one level (fork arrow) वर click करा. 2024 Jan ₹200 आणि 2025 Jan ₹300 दिसतात.
- फक्त एका वर्षासाठी: Drill down (single arrow) चालू करा, मग 2025 च्या bar वर click करा.
एक-एक step करके देखिए:
- Column chart के X-axis पर Date hierarchy (Year, Month) डालिए.
- Chart पर mouse ले जाइए. ऊपर drill icons दिखते हैं.
- Go to the next level (double arrow) पर click कीजिए. Jan ₹500 दिखाता है. उसमें 2024 और 2025 mix हैं.
- Drill up पर click कीजिए.
- Expand all down one level (fork arrow) पर click कीजिए. 2024 Jan ₹200 और 2025 Jan ₹300 दिखते हैं.
- सिर्फ़ एक साल के लिए: Drill down (single arrow) चालू कीजिए, फिर 2025 के bar पर click कीजिए.
| Drill down / Go to next level | Expand all down one level | |
|---|---|---|
| Parent level after the action | Hidden (replaced) | Kept and combined with the child |
| Axis labels | Child only ("Kothrud") | Parent + child ("Pune Kothrud") |
| Same child name in two parents | Summed together (e.g. two "Station Road" areas merged) | Kept separate |
| Best for | Focusing on one item (drill mode) or comparing children across parents | Seeing detail while keeping context |
He farak kalla ki drill cha confusion sampla. Aata pudhe jaauya matrix kade.
Ravindra Bagale's Tip
Friends, don't make a mistake here: using Go to next level on Month across several years adds January 2024 and January 2025 together. Use Expand all down to keep the Year context, or use a Year Month column. Always check the axis labels after drilling. Try it once more, then move on.
Ravindra Bagale's Tip – मराठी
मित्रांनो, इथे चूक करू नका: अनेक वर्षांच्या data वर Month साठी Go to next level वापरलं तर January 2024 आणि January 2025 एकत्र जोडले जातात. Year चा context ठेवण्यासाठी Expand all down वापरा, किंवा Year Month column वापरा. Drill केल्यानंतर नेहमी axis labels चेक करा. पुन्हा एकदा करून बघा, मग पुढे जा.
Ravindra Bagale's Tip – हिंदी
दोस्तों, यहाँ गलती मत करना: कई सालों के data पर Month के लिए Go to next level इस्तेमाल करने से January 2024 और January 2025 आपस में जुड़ जाते हैं. Year का context रखने के लिए Expand all down इस्तेमाल करो, या Year Month column इस्तेमाल करो. Drill करने के बाद हमेशा axis labels check करो. एक बार फिर करके देखो, फिर आगे बढ़ो.
Fix common mistakes
| Wrong result | Reason | Correction |
|---|---|---|
| Card still shows ₹2,100 after drill | Drill filters only that visual | Expected; drill does not filter other visuals |
| Long combined labels | Expand concatenates levels | Use drill, or turn off Concatenate labels in X-axis format |
| Different totals assumed | Confusing filter vs level | Explain: drill filters, expand does not |
Practise independently
Practice task
After Expand all, what is the label and value of the Kolhapur bar?
Hints
- Kolhapur has one store.
Solution
Kolhapur Rajarampuri – ₹450.
Think like a professional
Knowing drill vs expand is a common interview question. Answer with the label difference and the filter difference.
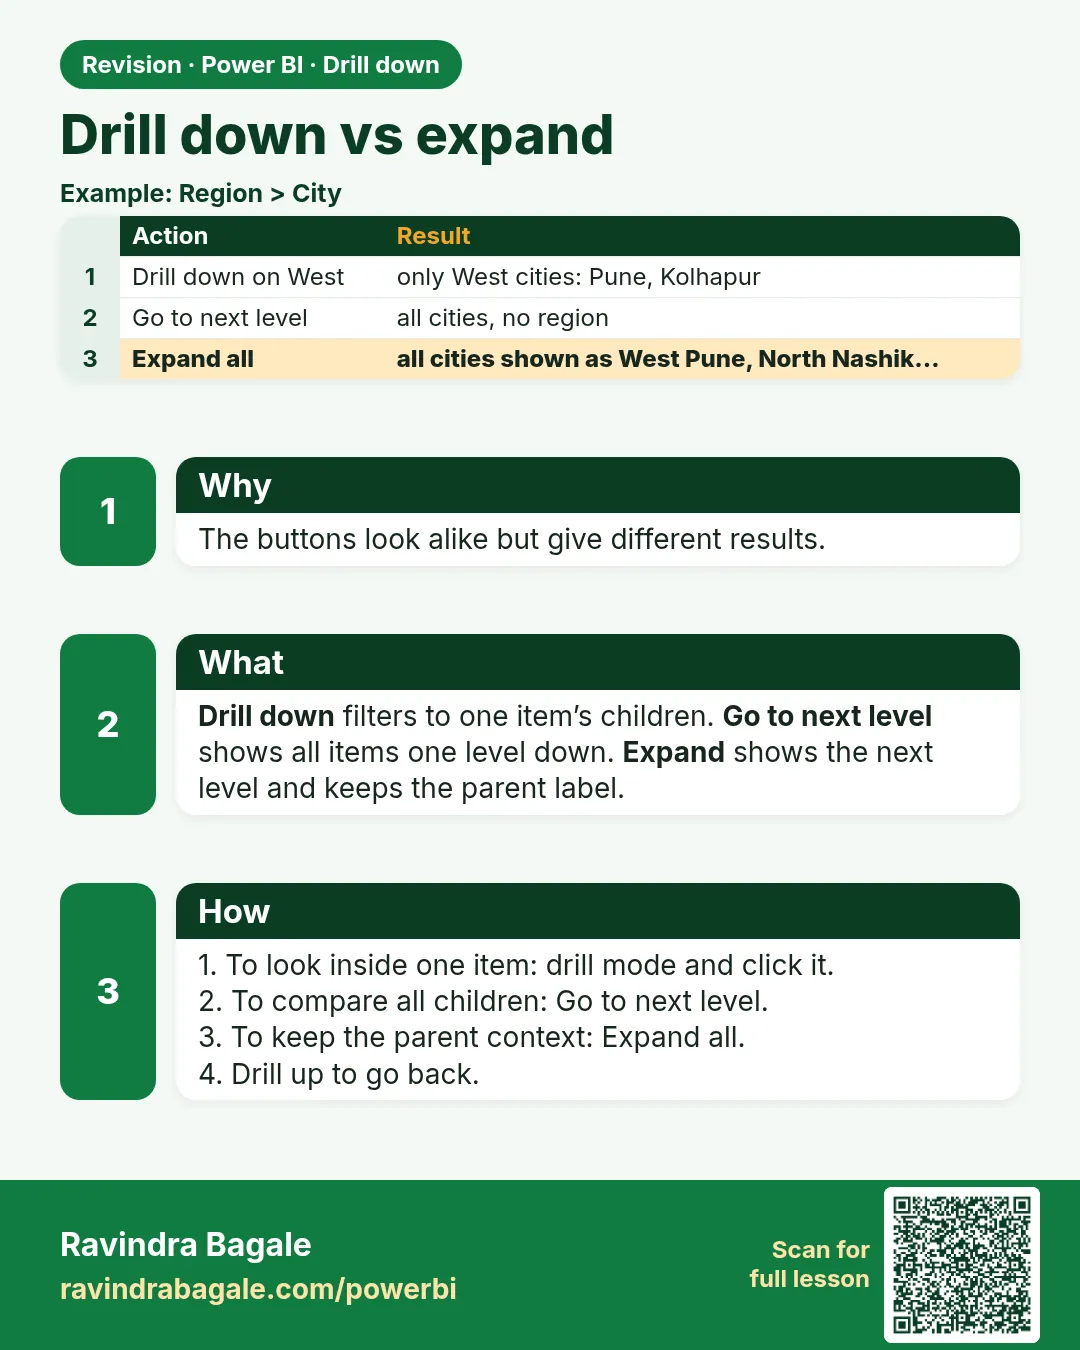 Revision card
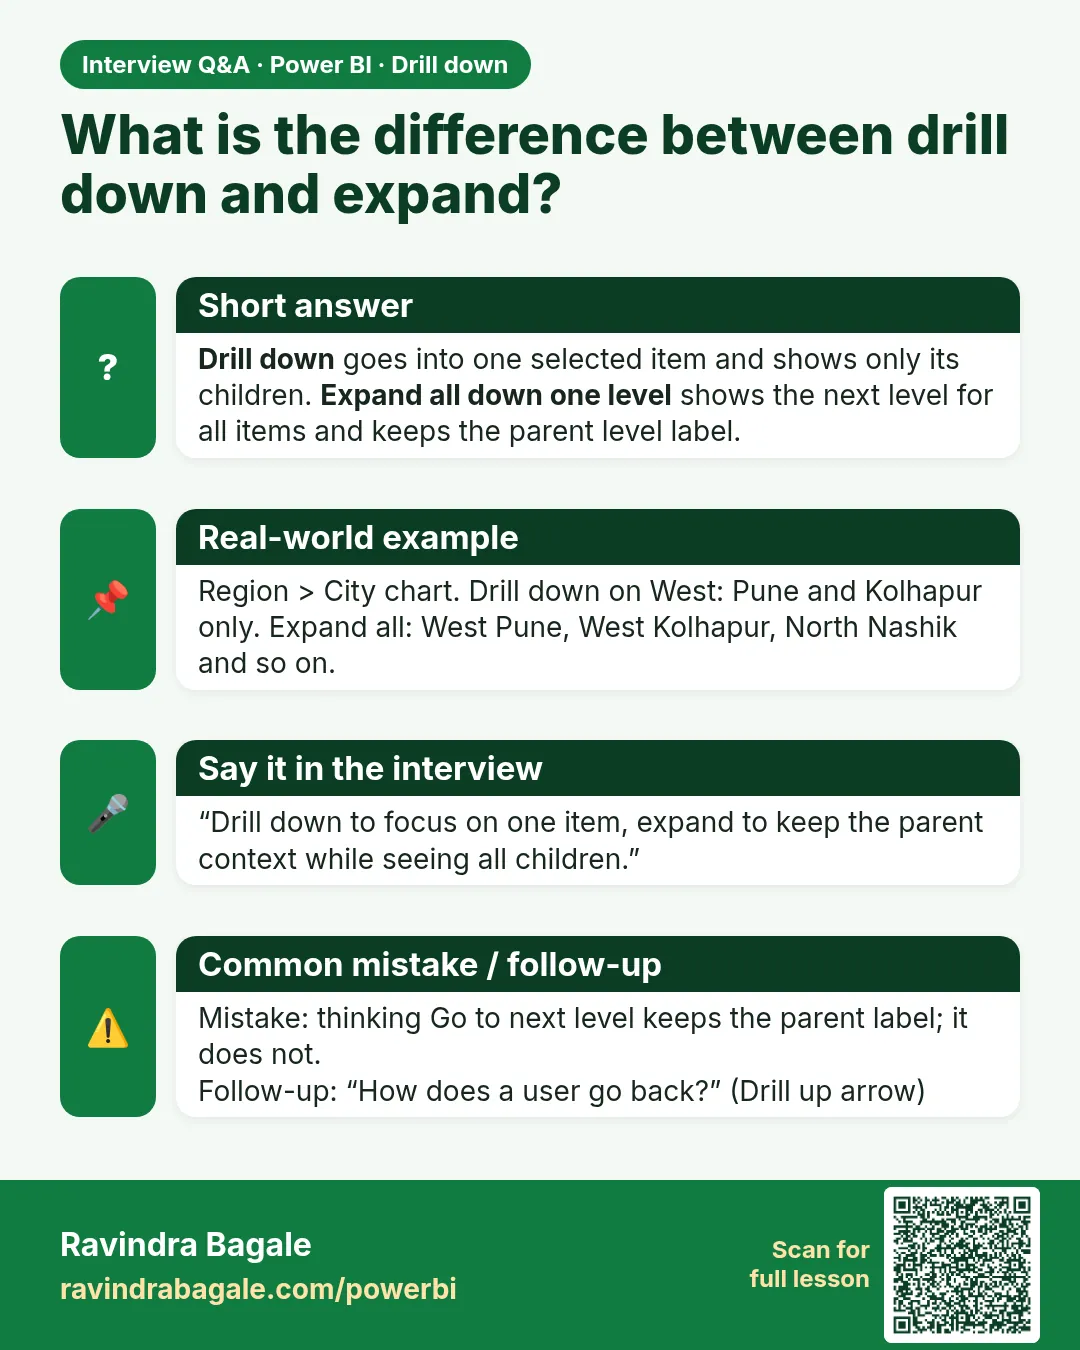 Interview card
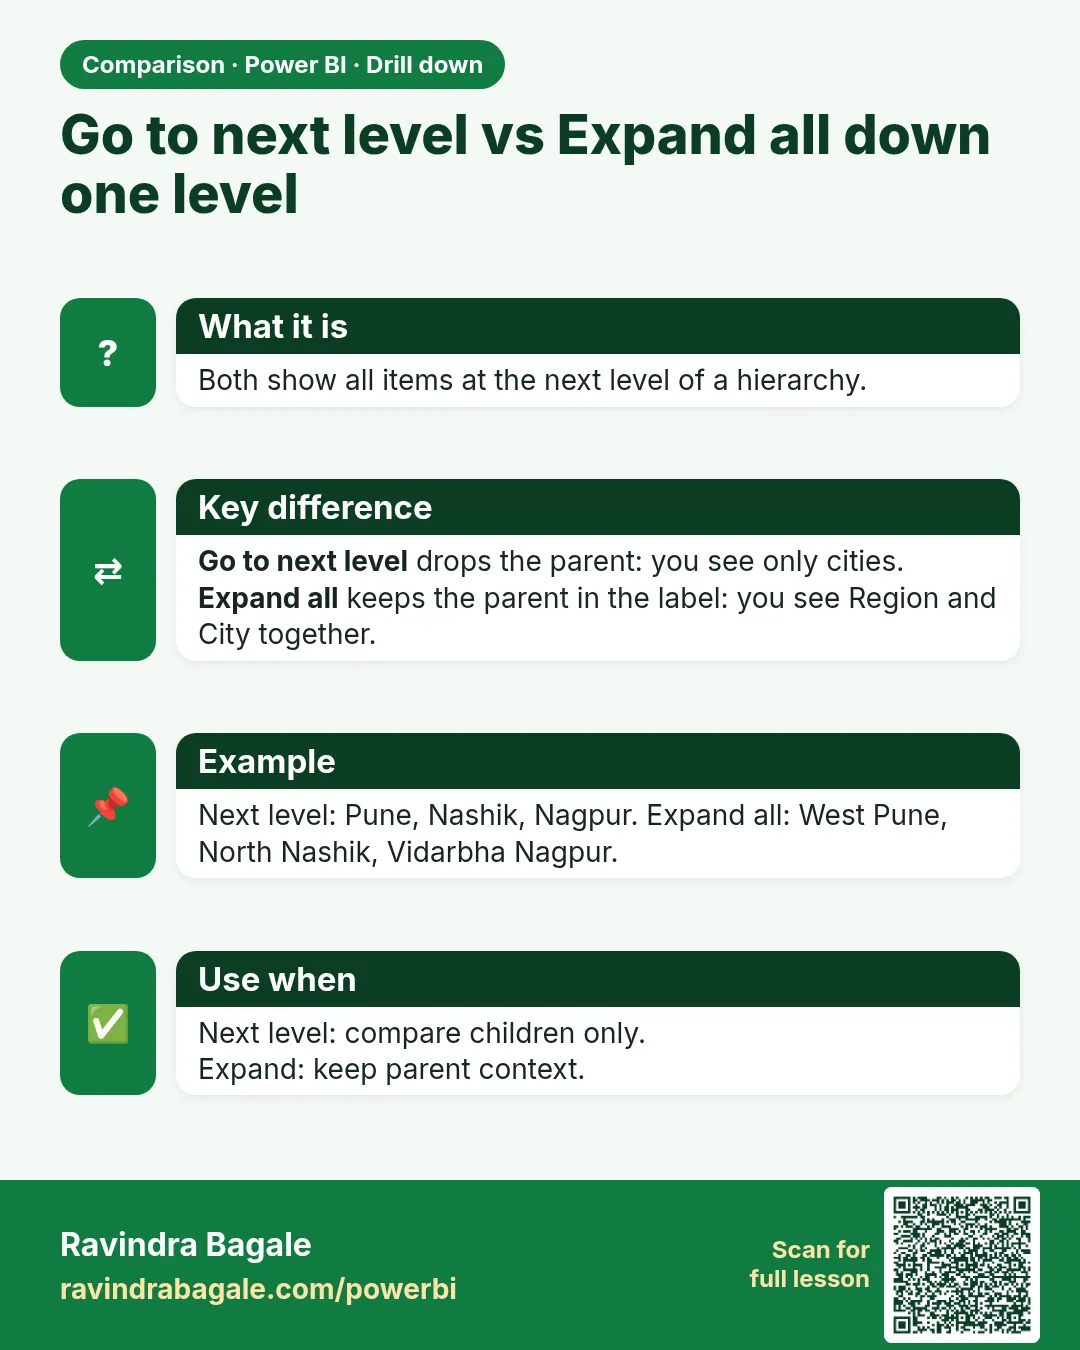 Comparison card